Schematic overview of the cellular and molecular mechanisms involved in the cancer progression, including the proposed cellular and molecular mechanisms in cancer cells trajectory. AT1: alveolar type 1 cells; AT2: alveolar type 2 cells; AAH: atypical adenomatous hyperplasia; AIS: adenocarcinoma in situ; MIA: minimally invasive adenocarcinoma; IA: invasive adenocarcinoma; EMT: epithelial-mesenchymal transition

Home

Download

Statistics

Help

Contact

Center for Computational Systems Medicine
leaf

Gene summary

leaf

Malignant transformation analysis

leaf

Malignant transformation related pathway analysis

leaf

Cell-cell communication analysis

leaf

Single-cell gene regulatory network inference analysis

leaf

Somatic mutation of malignant transformation related genes

leaf

Related drugs of malignant transformation related genes

Gene: PDP1

Gene summary for PDP1

check button Gene summary.

Gene informationSpeciesHuman
Gene symbol

PDP1

Gene ID

54704

Gene namepyruvate dehydrogenase phosphatase catalytic subunit 1
Gene AliasPDH
Cytomap8q22.1
Gene Typeprotein-coding
GO ID

GO:0006464

UniProtAcc

Q9P0J1


Top

Malignant transformation analysis

check button Identification of the aberrant gene expression in precancerous and cancerous lesions by comparing the gene expression of stem-like cells in diseased tissues with normal stem cells
check button Malignant transformation involving gene list.
Entrez IDSymbolReplicatesSpeciesOrganTissueAdj P-valueLog2FCMalignancy
54704PDP1LZE4THumanEsophagusESCC2.06e-146.48e-010.0811
54704PDP1LZE8THumanEsophagusESCC2.15e-062.49e-010.067
54704PDP1LZE20THumanEsophagusESCC6.69e-032.93e-010.0662
54704PDP1LZE22THumanEsophagusESCC5.19e-043.29e-020.068
54704PDP1LZE24THumanEsophagusESCC2.50e-043.59e-010.0596
54704PDP1LZE21THumanEsophagusESCC1.11e-025.32e-010.0655
54704PDP1P2T-EHumanEsophagusESCC1.61e-122.50e-010.1177
54704PDP1P4T-EHumanEsophagusESCC4.39e-113.69e-010.1323
54704PDP1P5T-EHumanEsophagusESCC2.47e-174.01e-010.1327
54704PDP1P8T-EHumanEsophagusESCC1.36e-103.80e-010.0889
54704PDP1P9T-EHumanEsophagusESCC2.38e-102.62e-010.1131
54704PDP1P10T-EHumanEsophagusESCC1.19e-13-4.45e-020.116
54704PDP1P11T-EHumanEsophagusESCC2.89e-151.25e+000.1426
54704PDP1P12T-EHumanEsophagusESCC5.39e-205.16e-010.1122
54704PDP1P15T-EHumanEsophagusESCC9.94e-102.86e-010.1149
54704PDP1P16T-EHumanEsophagusESCC2.18e-241.47e-010.1153
54704PDP1P17T-EHumanEsophagusESCC9.48e-086.59e-010.1278
54704PDP1P20T-EHumanEsophagusESCC2.10e-112.91e-010.1124
54704PDP1P21T-EHumanEsophagusESCC4.58e-329.54e-010.1617
54704PDP1P22T-EHumanEsophagusESCC8.38e-161.07e-010.1236
Page: 1 2 3 4 5 

check button Transcriptomic changes along malignancy continuum.
TissueExpression DynamicsAbbreviation
Colorectum (GSE201348)The image shows the transcriptomic changes along malignancy continuum.log2FC in expression of this searched gene in stem-like cells from each diseased tissue sample relative to stem-like cells in normal samples in each tissue plotted against the malignancy continuum. Samples are colored based on if they are from different disease stage.FAP: Familial adenomatous polyposis
CRC: Colorectal cancer
Colorectum (HTA11)The image shows the transcriptomic changes along malignancy continuum.log2FC in expression of this searched gene in stem-like cells from each diseased tissue sample relative to stem-like cells in normal samples in each tissue plotted against the malignancy continuum. Samples are colored based on if they are from different disease stage.AD: Adenomas
SER: Sessile serrated lesions
MSI-H: Microsatellite-high colorectal cancer
MSS: Microsatellite stable colorectal cancer
EsophagusThe image shows the transcriptomic changes along malignancy continuum.log2FC in expression of this searched gene in stem-like cells from each diseased tissue sample relative to stem-like cells in normal samples in each tissue plotted against the malignancy continuum. Samples are colored based on if they are from different disease stage.
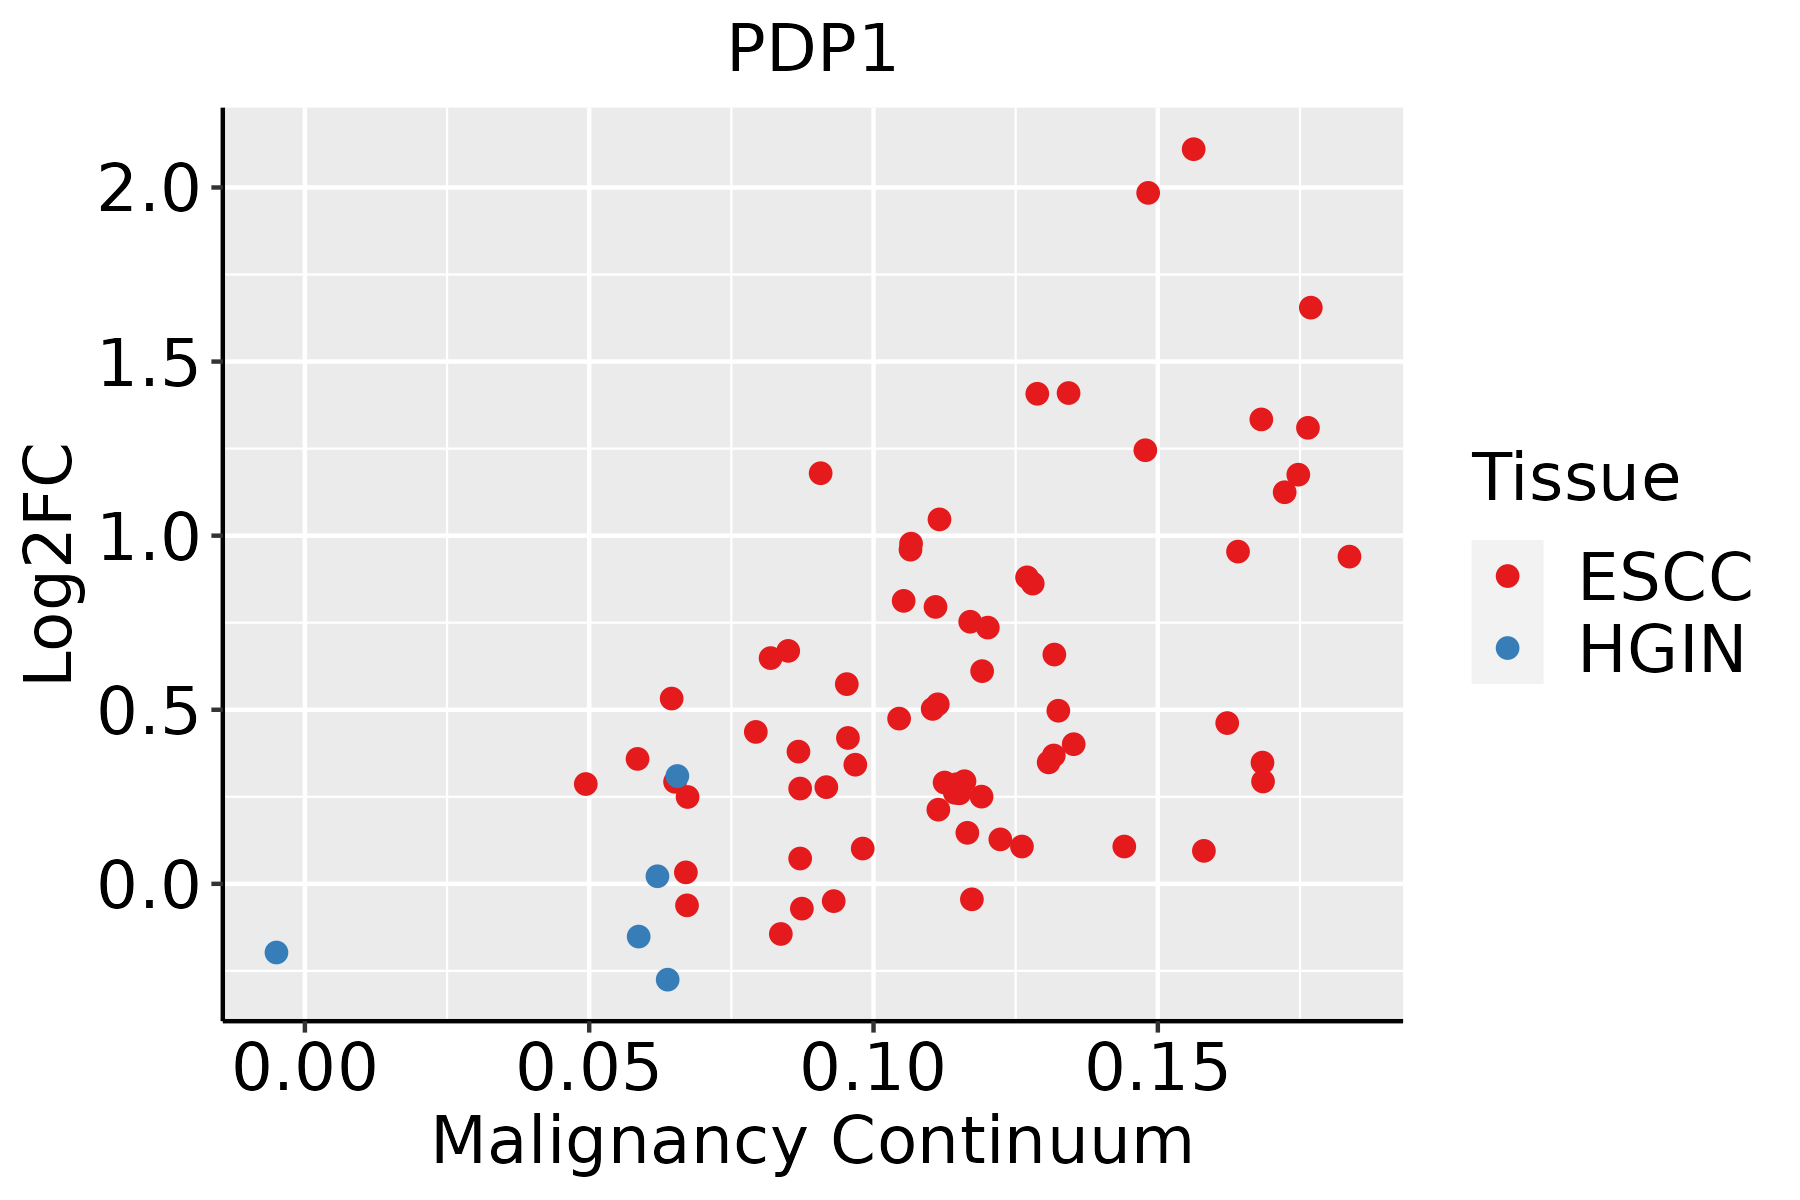
ESCC: Esophageal squamous cell carcinoma
HGIN: High-grade intraepithelial neoplasias
LGIN: Low-grade intraepithelial neoplasias
LiverThe image shows the transcriptomic changes along malignancy continuum.log2FC in expression of this searched gene in stem-like cells from each diseased tissue sample relative to stem-like cells in normal samples in each tissue plotted against the malignancy continuum. Samples are colored based on if they are from different disease stage.
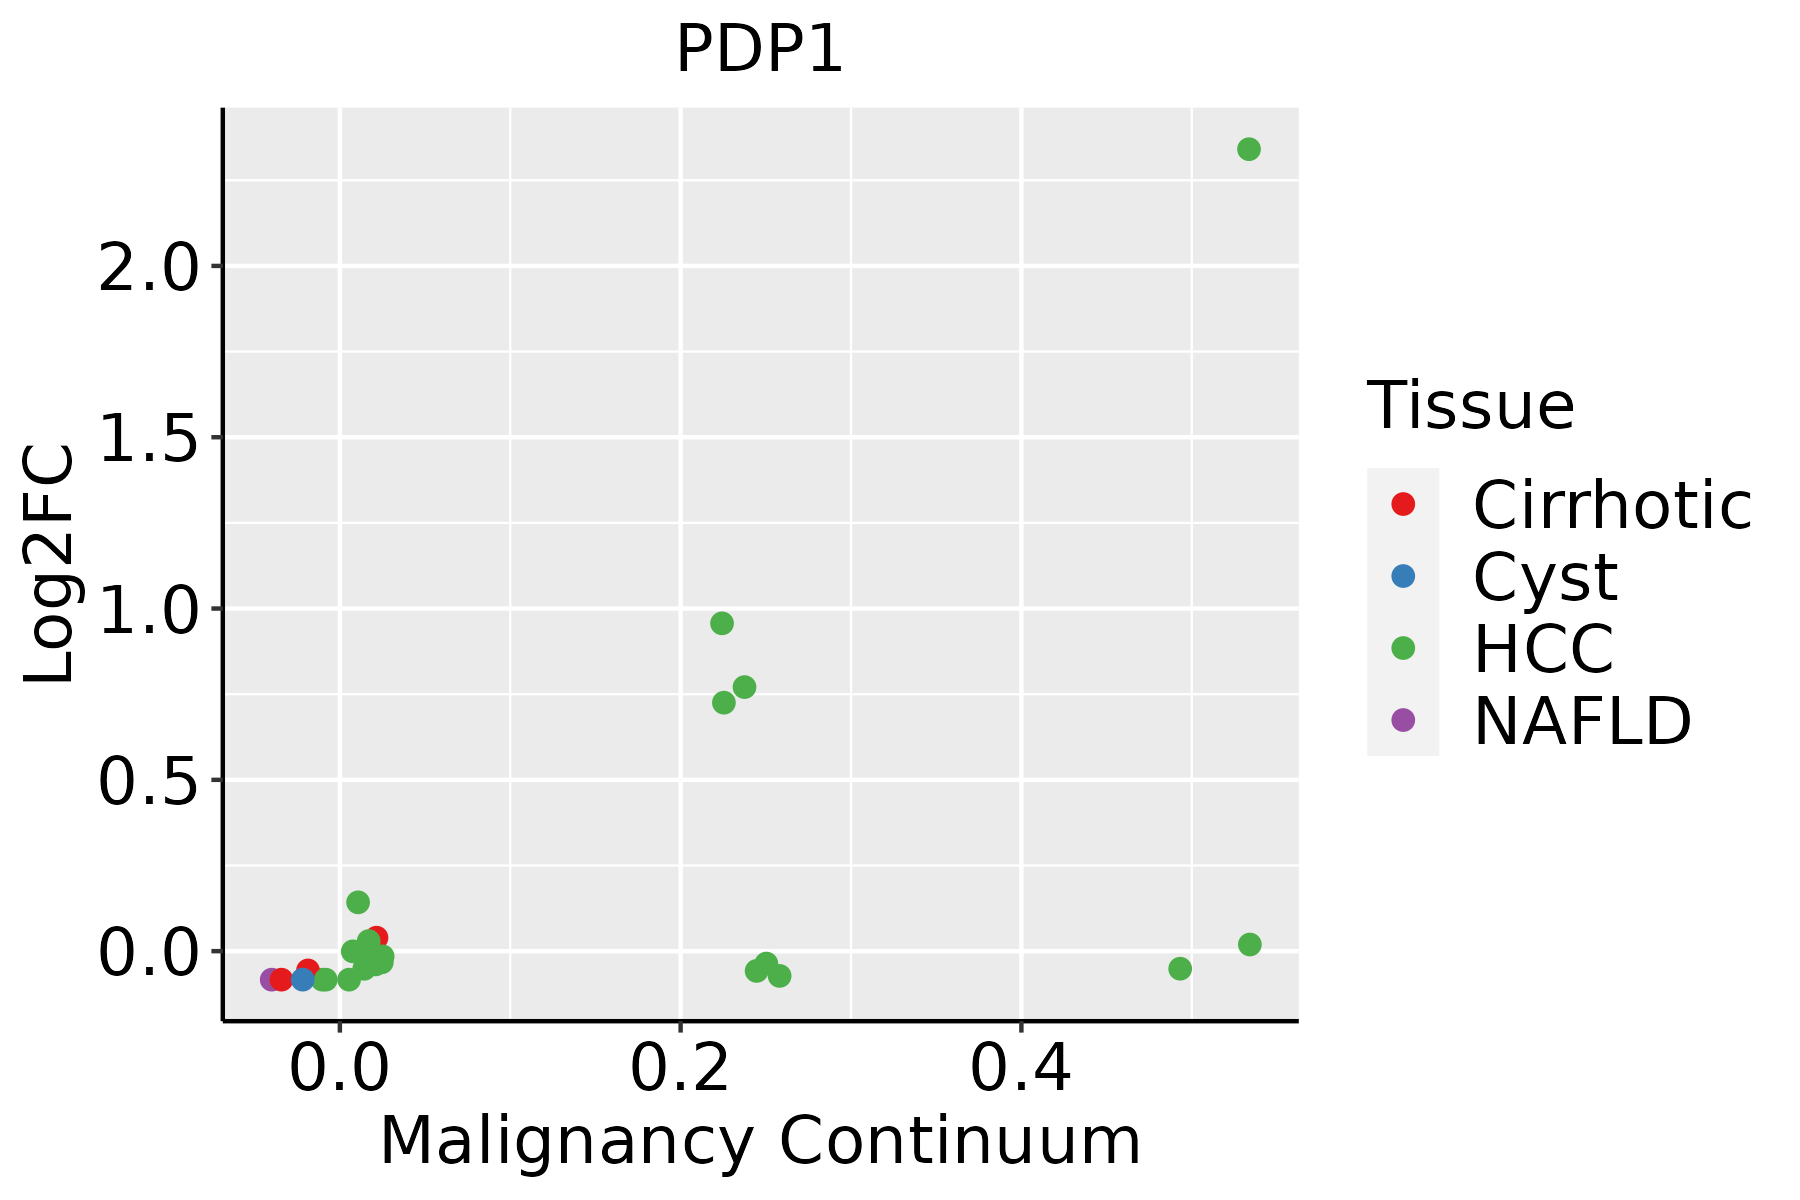
HCC: Hepatocellular carcinoma
NAFLD: Non-alcoholic fatty liver disease
Oral CavityThe image shows the transcriptomic changes along malignancy continuum.log2FC in expression of this searched gene in stem-like cells from each diseased tissue sample relative to stem-like cells in normal samples in each tissue plotted against the malignancy continuum. Samples are colored based on if they are from different disease stage.
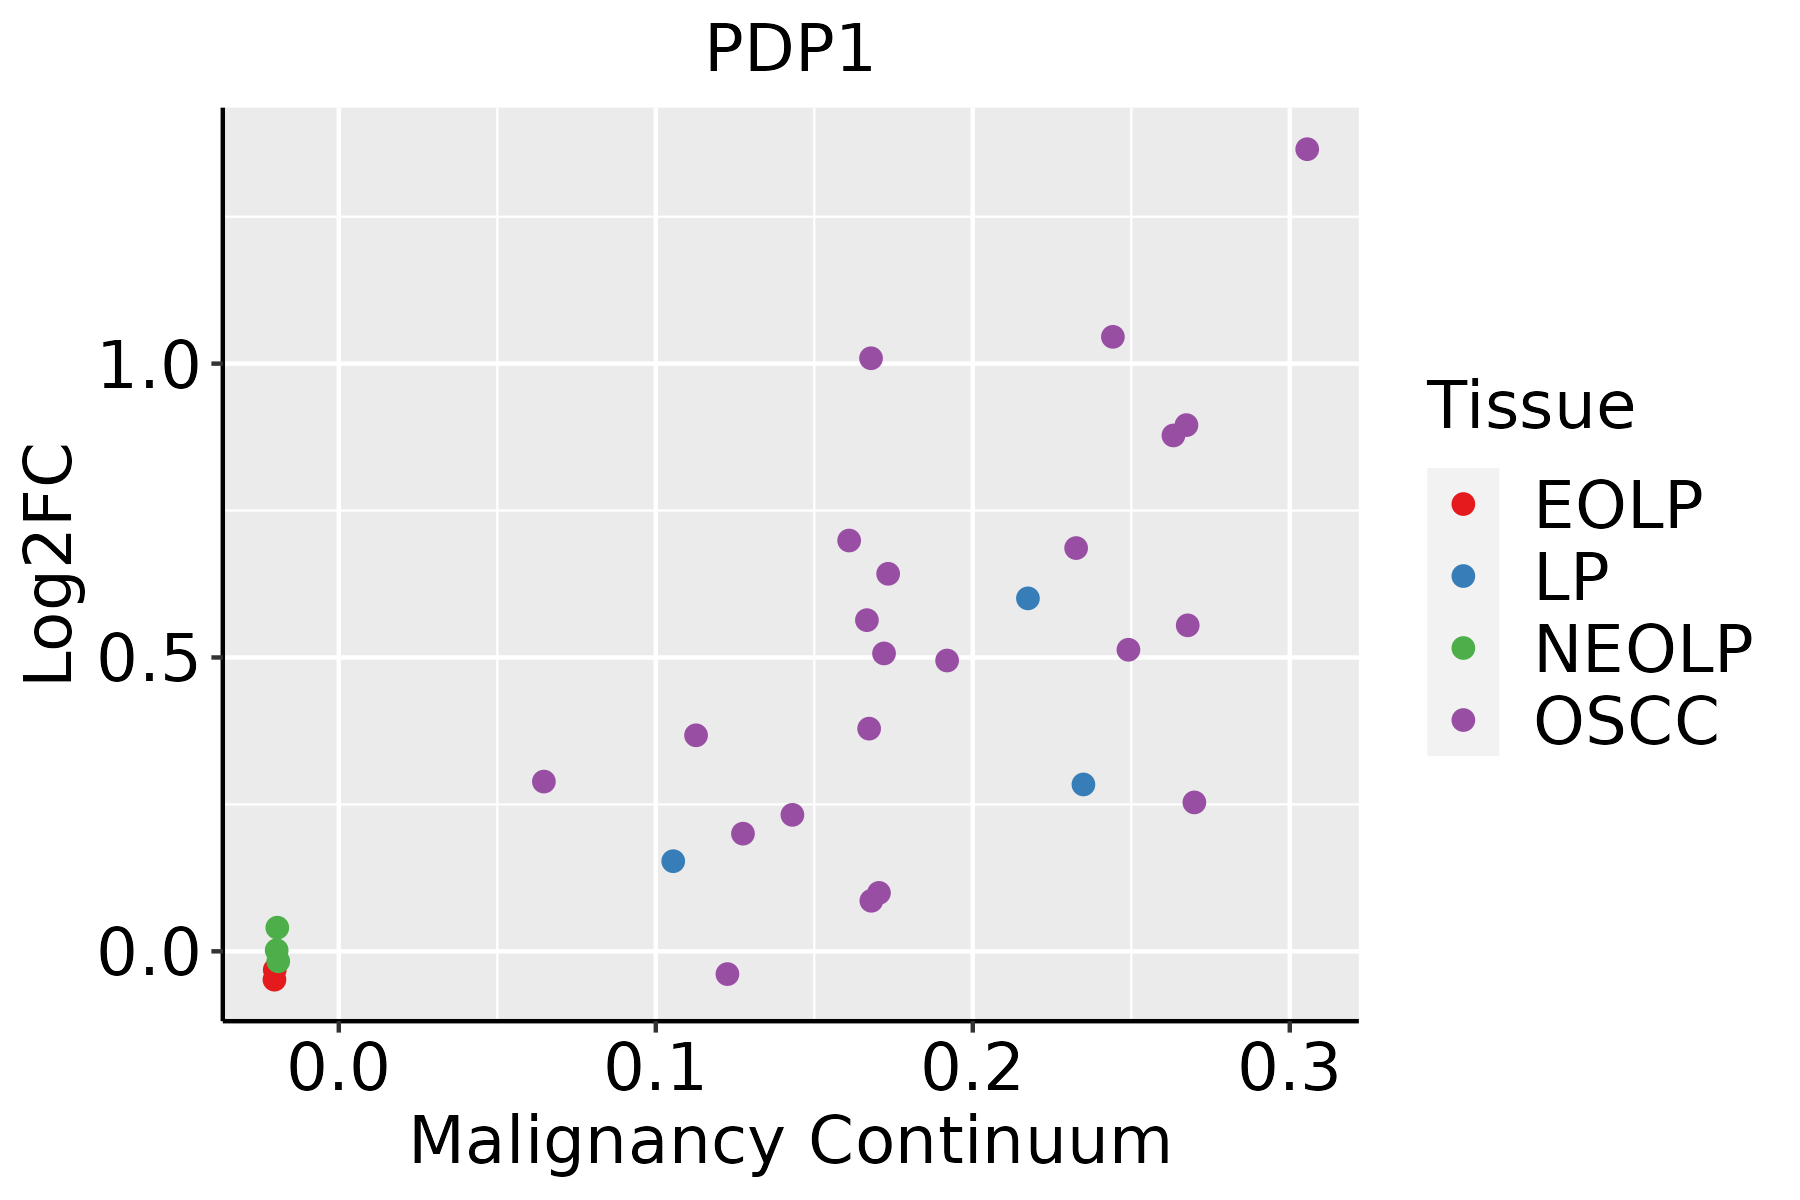
EOLP: Erosive Oral lichen planus
LP: leukoplakia
NEOLP: Non-erosive oral lichen planus
OSCC: Oral squamous cell carcinoma
SkinThe image shows the transcriptomic changes along malignancy continuum.log2FC in expression of this searched gene in stem-like cells from each diseased tissue sample relative to stem-like cells in normal samples in each tissue plotted against the malignancy continuum. Samples are colored based on if they are from different disease stage.
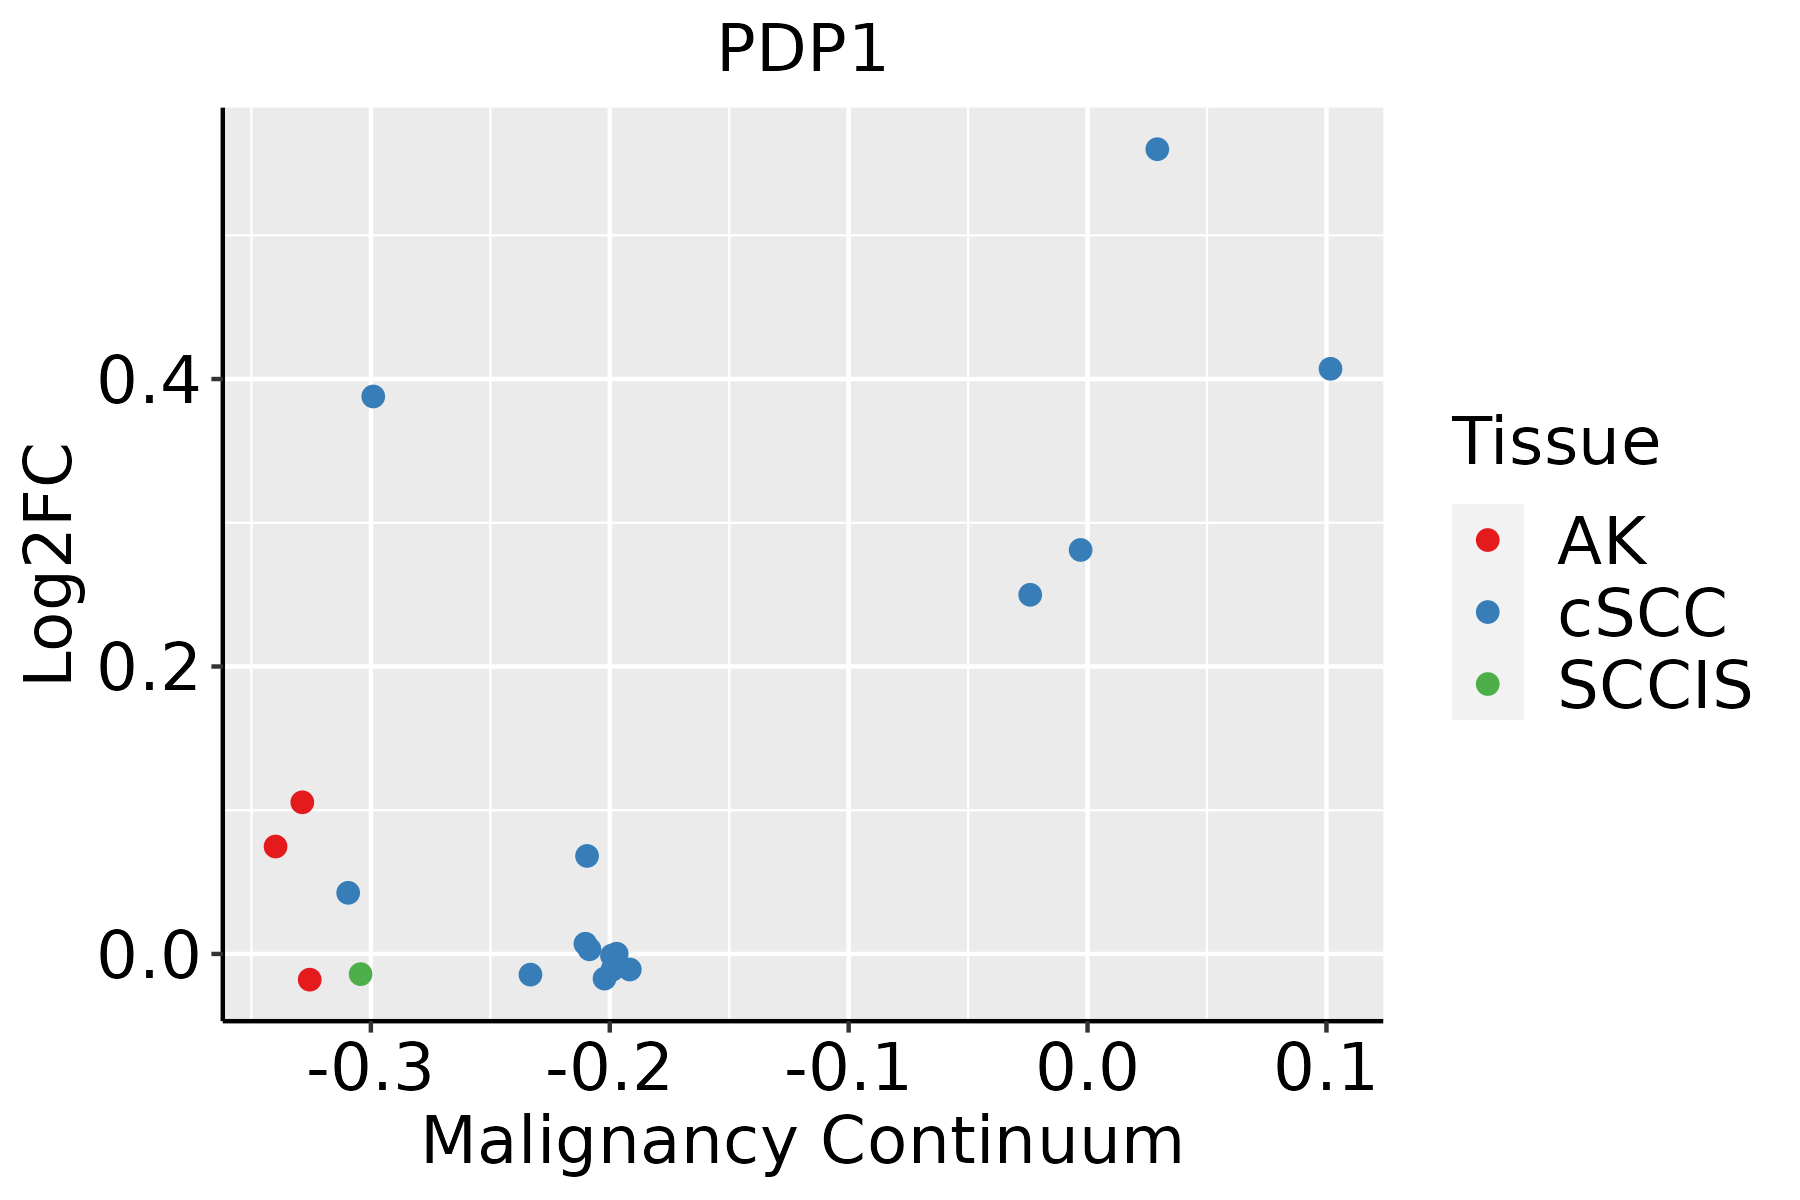
AK: Actinic keratosis
cSCC: Cutaneous squamous cell carcinoma
SCCIS:squamous cell carcinoma in situ
ThyroidThe image shows the transcriptomic changes along malignancy continuum.log2FC in expression of this searched gene in stem-like cells from each diseased tissue sample relative to stem-like cells in normal samples in each tissue plotted against the malignancy continuum. Samples are colored based on if they are from different disease stage.
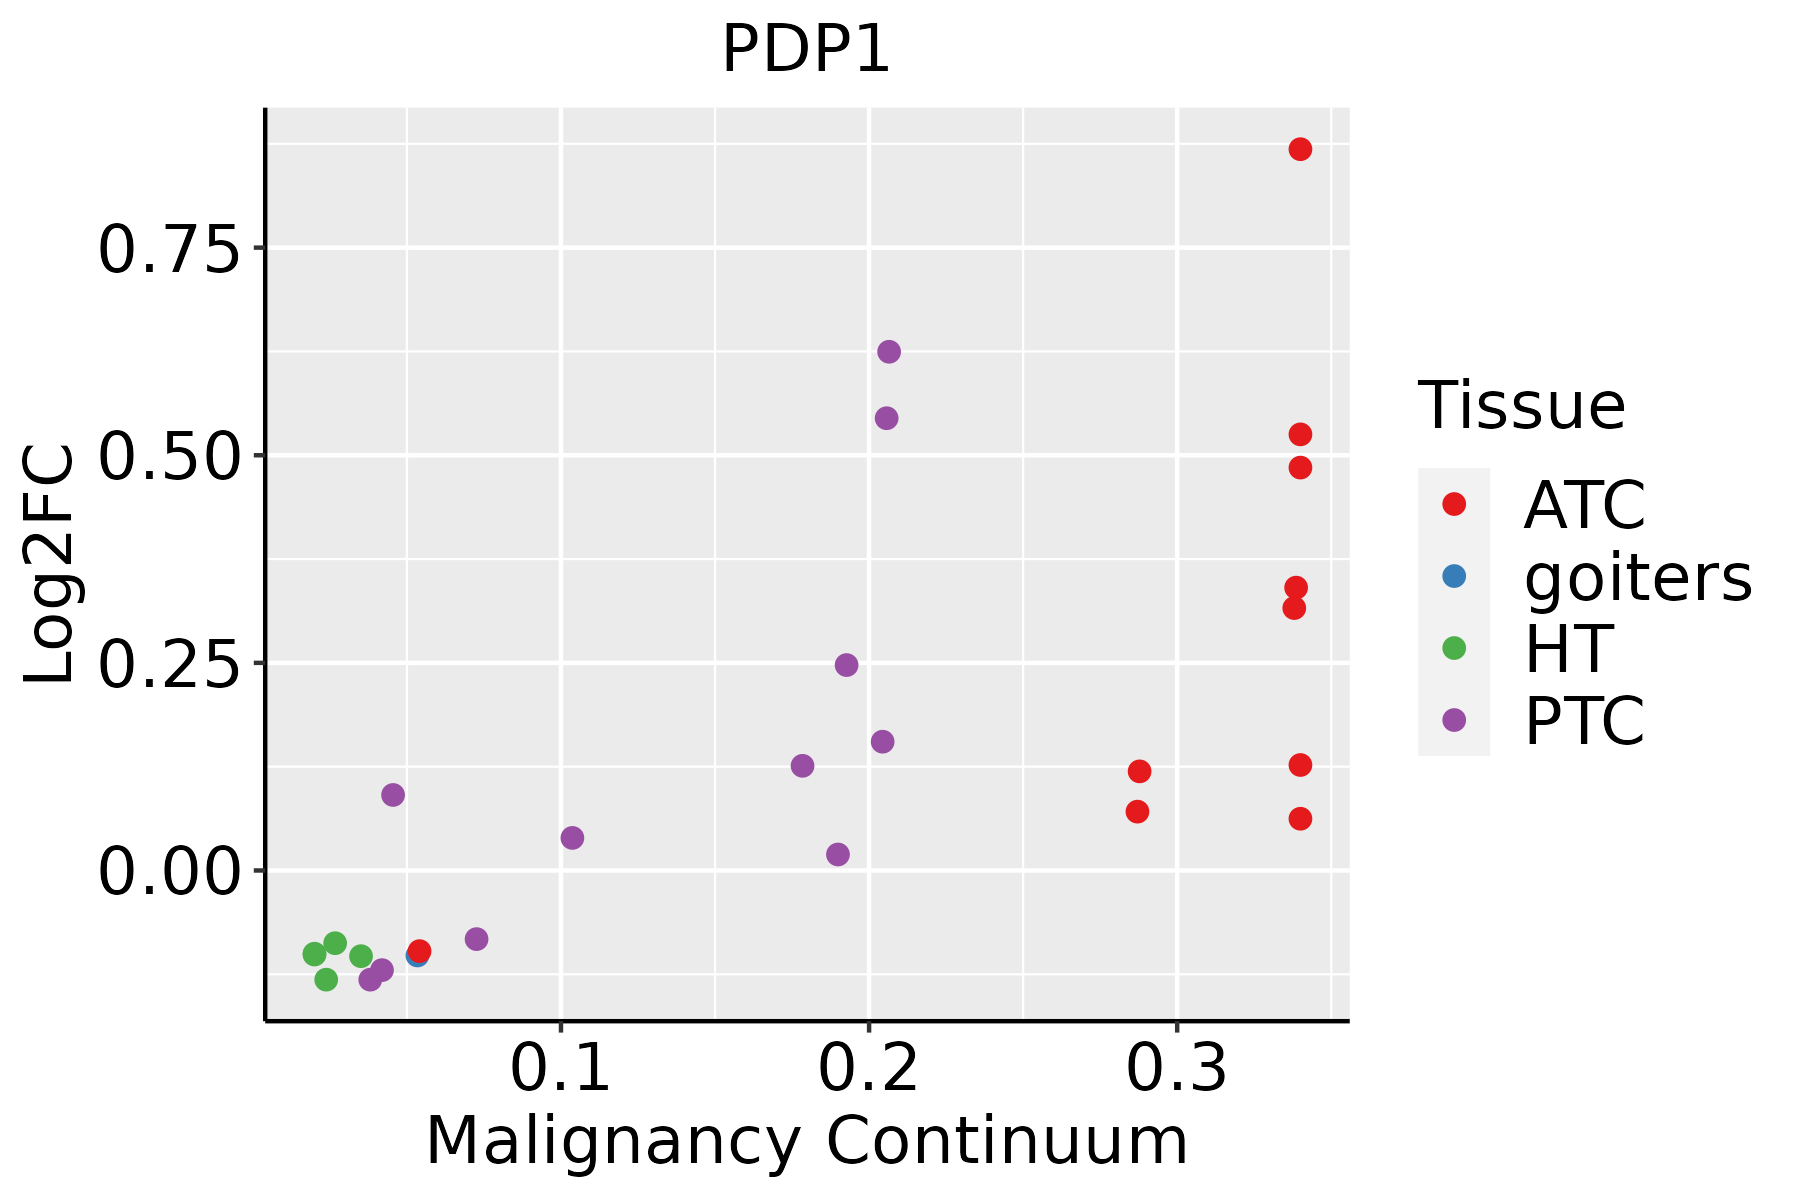
ATC: Anaplastic thyroid cancer
HT: Hashimoto's thyroiditis
PTC: Papillary thyroid cancer
∗log2FC in expression of this searched gene in stem-like cells from each diseased tissue sample relative to stem-like cells in normal samples in each tissue plotted against the malignancy continuum. Samples are colored based on if they are from different disease stage.

Top

Malignant transformation related pathway analysis

check buttonFind out the enriched GO biological processes and KEGG pathways involved in transition from healthy to precancer to cancer
check button Figure of enriched GO biological processes.
TissueDisease StageEnriched GO biological Processes
ColorectumADGO analysis - Figure of enriched GO biological processes: Top 15 enriched GO BP terms are showed in the bar plot of each disease state in each tissue. Each row represents a significant GO biological process which is colored according to the -log10(p.adjust).
ColorectumSERGO analysis - Figure of enriched GO biological processes: Top 15 enriched GO BP terms are showed in the bar plot of each disease state in each tissue. Each row represents a significant GO biological process which is colored according to the -log10(p.adjust).
ColorectumMSSGO analysis - Figure of enriched GO biological processes: Top 15 enriched GO BP terms are showed in the bar plot of each disease state in each tissue. Each row represents a significant GO biological process which is colored according to the -log10(p.adjust).
ColorectumMSI-HGO analysis - Figure of enriched GO biological processes: Top 15 enriched GO BP terms are showed in the bar plot of each disease state in each tissue. Each row represents a significant GO biological process which is colored according to the -log10(p.adjust).
ColorectumFAPGO analysis - Figure of enriched GO biological processes: Top 15 enriched GO BP terms are showed in the bar plot of each disease state in each tissue. Each row represents a significant GO biological process which is colored according to the -log10(p.adjust).
∗Top 15 enriched GO BP terms are showed in the bar plot of each disease state in each tissue. Each row represents a significant GO biological process which is colored according to the -log10(p.adjust).
Page: 1 2 3 4 5 6 7 8 9 

check button Enriched GO biological processes.
GO IDTissueDisease StageDescriptionGene RatioBg Ratiopvaluep.adjustCount
GO:001631110EsophagusESCCdephosphorylation251/8552417/187231.26e-092.99e-08251
GO:000647018EsophagusESCCprotein dephosphorylation177/8552281/187233.13e-096.72e-08177
GO:00359703EsophagusESCCpeptidyl-threonine dephosphorylation13/855216/187234.05e-031.62e-0213
GO:00513534EsophagusESCCpositive regulation of oxidoreductase activity37/855259/187236.23e-032.29e-0237
GO:001631121LiverHCCdephosphorylation230/7958417/187231.00e-071.96e-06230
GO:000647021LiverHCCprotein dephosphorylation162/7958281/187231.91e-073.46e-06162
GO:00359701LiverHCCpeptidyl-threonine dephosphorylation13/795816/187231.84e-039.42e-0313
GO:000647015Oral cavityOSCCprotein dephosphorylation162/7305281/187231.56e-104.56e-09162
GO:00163119Oral cavityOSCCdephosphorylation220/7305417/187236.33e-091.34e-07220
GO:00359702Oral cavityOSCCpeptidyl-threonine dephosphorylation13/730516/187237.05e-043.89e-0313
GO:00513533Oral cavityOSCCpositive regulation of oxidoreductase activity35/730559/187231.24e-036.23e-0335
GO:000647016Oral cavityLPprotein dephosphorylation89/4623281/187234.60e-032.93e-0289
GO:000647024SkincSCCprotein dephosphorylation111/4864281/187234.10e-077.96e-06111
GO:001631115SkincSCCdephosphorylation134/4864417/187232.65e-031.50e-02134
GO:001631116ThyroidPTCdephosphorylation174/5968417/187231.20e-051.31e-04174
GO:000647020ThyroidPTCprotein dephosphorylation123/5968281/187231.69e-051.77e-04123
GO:0006470111ThyroidATCprotein dephosphorylation129/6293281/187231.11e-051.09e-04129
GO:001631117ThyroidATCdephosphorylation179/6293417/187233.88e-053.15e-04179
Page: 1 

check button Enriched KEGG pathways.
Pathway IDTissueDisease StageDescriptionGene RatioBg Ratiopvaluep.adjustqvalueCount
Page: 1 

Top

Cell-cell communication analysis

check buttonIdentification of potential cell-cell interactions between two cell types and their ligand-receptor pairs for different disease states
LigandReceptorLRpairPathwayTissueDisease Stage
Page: 1 

Top

Single-cell gene regulatory network inference analysis

check buttonFind out the significant the regulons (TFs) and the target genes of each regulon across cell types for different disease states
TFCell TypeTissueDisease StageTarget GeneRSSRegulon Activity
∗The dot plots of a searched regulon are shown for all cell subpopulations in each disease state of each tissue based on the regulon specific score inferred using pySCENIC and by calculating the average expression.
Page: 1 

Top

Somatic mutation of malignant transformation related genes

check buttonAnnotation of somatic variants for genes involved in malignant transformation
Hugo SymbolVariant ClassVariant ClassificationdbSNP RSHGVScHGVSpHGVSp ShortSWISSPROTBIOTYPESIFTPolyPhenTumor Sample BarcodeTissueHistologySexAgeStageTherapy TypesDrugsOutcome
PDP1SNVMissense_Mutationc.1655N>Ap.Ser552Tyrp.S552YQ9P0J1protein_codingdeleterious(0.02)benign(0.139)TCGA-AN-A046-01Breastbreast invasive carcinomaFemale>=65I/IIUnknownUnknownSD
PDP1SNVMissense_Mutationc.916N>Ap.Gly306Serp.G306SQ9P0J1protein_codingtolerated(0.06)possibly_damaging(0.479)TCGA-BH-A0HF-01Breastbreast invasive carcinomaFemale>=65I/IIHormone TherapyarimidexSD
PDP1SNVMissense_Mutationc.700N>Cp.Phe234Leup.F234LQ9P0J1protein_codingtolerated(0.66)benign(0.115)TCGA-D8-A142-01Breastbreast invasive carcinomaFemale>=65I/IIChemotherapycyclophosphamidSD
PDP1SNVMissense_Mutationc.878C>Ap.Ala293Glup.A293EQ9P0J1protein_codingdeleterious(0)probably_damaging(1)TCGA-D8-A1JK-01Breastbreast invasive carcinomaFemale>=65I/IIUnknownUnknownSD
PDP1SNVMissense_Mutationc.880T>Ap.Phe294Ilep.F294IQ9P0J1protein_codingdeleterious(0.04)probably_damaging(0.959)TCGA-D8-A1JK-01Breastbreast invasive carcinomaFemale>=65I/IIUnknownUnknownSD
PDP1insertionFrame_Shift_Insnovelc.468_469insCAGGCACATTTTCATTGTTTTTTp.Cys157GlnfsTer51p.C157Qfs*51Q9P0J1protein_codingTCGA-A8-A09D-01Breastbreast invasive carcinomaFemale<65I/IIChemotherapydoxorubicinCR
PDP1insertionFrame_Shift_Insnovelc.1183_1184insTTTTCCTTATAGCTGCTAAGCAGGGAACACTGTTAGTAGGTp.Glu395ValfsTer21p.E395Vfs*21Q9P0J1protein_codingTCGA-AN-A0FV-01Breastbreast invasive carcinomaFemale<65I/IIUnknownUnknownSD
PDP1insertionFrame_Shift_Insnovelc.1255_1256insCATCTCCTCAGCTTTCCCCAGCCAAp.Tyr419SerfsTer13p.Y419Sfs*13Q9P0J1protein_codingTCGA-AO-A0JB-01Breastbreast invasive carcinomaFemale<65III/IVChemotherapycyclophosphamideSD
PDP1SNVMissense_Mutationnovelc.711N>Cp.Leu237Phep.L237FQ9P0J1protein_codingtolerated(0.36)probably_damaging(1)TCGA-C5-A2LZ-01Cervixcervical & endocervical cancerFemale>=65III/IVUnknownUnknownPD
PDP1SNVMissense_Mutationc.1173N>Cp.Lys391Asnp.K391NQ9P0J1protein_codingtolerated(0.2)benign(0.043)TCGA-EK-A2RJ-01Cervixcervical & endocervical cancerFemale<65I/IIUnknownUnknownSD
Page: 1 2 3 4 5 6 

Top

Related drugs of malignant transformation related genes

check buttonIdentification of chemicals and drugs interact with genes involved in malignant transfromation
(DGIdb 4.0)
Entrez IDSymbolCategoryInteraction TypesDrug Claim NameDrug NamePMIDs
Page: 1