
|
|||||
|
 | |
| |
| |
| |
| |
| |
|
Gene: PDLIM7 |
Gene summary for PDLIM7 |
| Gene information | Species | Human | Gene symbol | PDLIM7 | Gene ID | 9260 |
| Gene name | PDZ and LIM domain 7 | |
| Gene Alias | LMP1 | |
| Cytomap | 5q35.3 | |
| Gene Type | protein-coding | GO ID | GO:0001503 | UniProtAcc | Q9NR12 |
Top |
Malignant transformation analysis |
| Identification of the aberrant gene expression in precancerous and cancerous lesions by comparing the gene expression of stem-like cells in diseased tissues with normal stem cells |
| Entrez ID | Symbol | Replicates | Species | Organ | Tissue | Adj P-value | Log2FC | Malignancy |
| 9260 | PDLIM7 | LZE4T | Human | Esophagus | ESCC | 3.19e-07 | 2.51e-01 | 0.0811 |
| 9260 | PDLIM7 | LZE7T | Human | Esophagus | ESCC | 6.69e-08 | 2.11e-01 | 0.0667 |
| 9260 | PDLIM7 | LZE8T | Human | Esophagus | ESCC | 7.04e-04 | 1.18e-01 | 0.067 |
| 9260 | PDLIM7 | LZE20T | Human | Esophagus | ESCC | 4.06e-11 | 4.35e-01 | 0.0662 |
| 9260 | PDLIM7 | LZE24T | Human | Esophagus | ESCC | 3.07e-13 | 2.01e-01 | 0.0596 |
| 9260 | PDLIM7 | LZE6T | Human | Esophagus | ESCC | 2.10e-10 | 5.53e-01 | 0.0845 |
| 9260 | PDLIM7 | P1T-E | Human | Esophagus | ESCC | 4.40e-12 | 4.25e-01 | 0.0875 |
| 9260 | PDLIM7 | P2T-E | Human | Esophagus | ESCC | 1.90e-41 | 6.62e-01 | 0.1177 |
| 9260 | PDLIM7 | P4T-E | Human | Esophagus | ESCC | 3.94e-18 | 5.72e-01 | 0.1323 |
| 9260 | PDLIM7 | P5T-E | Human | Esophagus | ESCC | 3.90e-66 | 1.14e+00 | 0.1327 |
| 9260 | PDLIM7 | P8T-E | Human | Esophagus | ESCC | 5.20e-14 | 2.71e-01 | 0.0889 |
| 9260 | PDLIM7 | P9T-E | Human | Esophagus | ESCC | 5.35e-08 | 5.04e-01 | 0.1131 |
| 9260 | PDLIM7 | P10T-E | Human | Esophagus | ESCC | 9.53e-22 | 5.27e-01 | 0.116 |
| 9260 | PDLIM7 | P11T-E | Human | Esophagus | ESCC | 3.36e-35 | 1.59e+00 | 0.1426 |
| 9260 | PDLIM7 | P12T-E | Human | Esophagus | ESCC | 5.67e-28 | 5.00e-01 | 0.1122 |
| 9260 | PDLIM7 | P15T-E | Human | Esophagus | ESCC | 8.87e-21 | 6.04e-01 | 0.1149 |
| 9260 | PDLIM7 | P16T-E | Human | Esophagus | ESCC | 2.82e-27 | 5.39e-01 | 0.1153 |
| 9260 | PDLIM7 | P17T-E | Human | Esophagus | ESCC | 2.25e-32 | 1.56e+00 | 0.1278 |
| 9260 | PDLIM7 | P19T-E | Human | Esophagus | ESCC | 2.05e-27 | 2.40e+00 | 0.1662 |
| 9260 | PDLIM7 | P20T-E | Human | Esophagus | ESCC | 1.55e-06 | 3.89e-01 | 0.1124 |
| Page: 1 2 3 4 5 6 |
| Tissue | Expression Dynamics | Abbreviation |
| Esophagus | 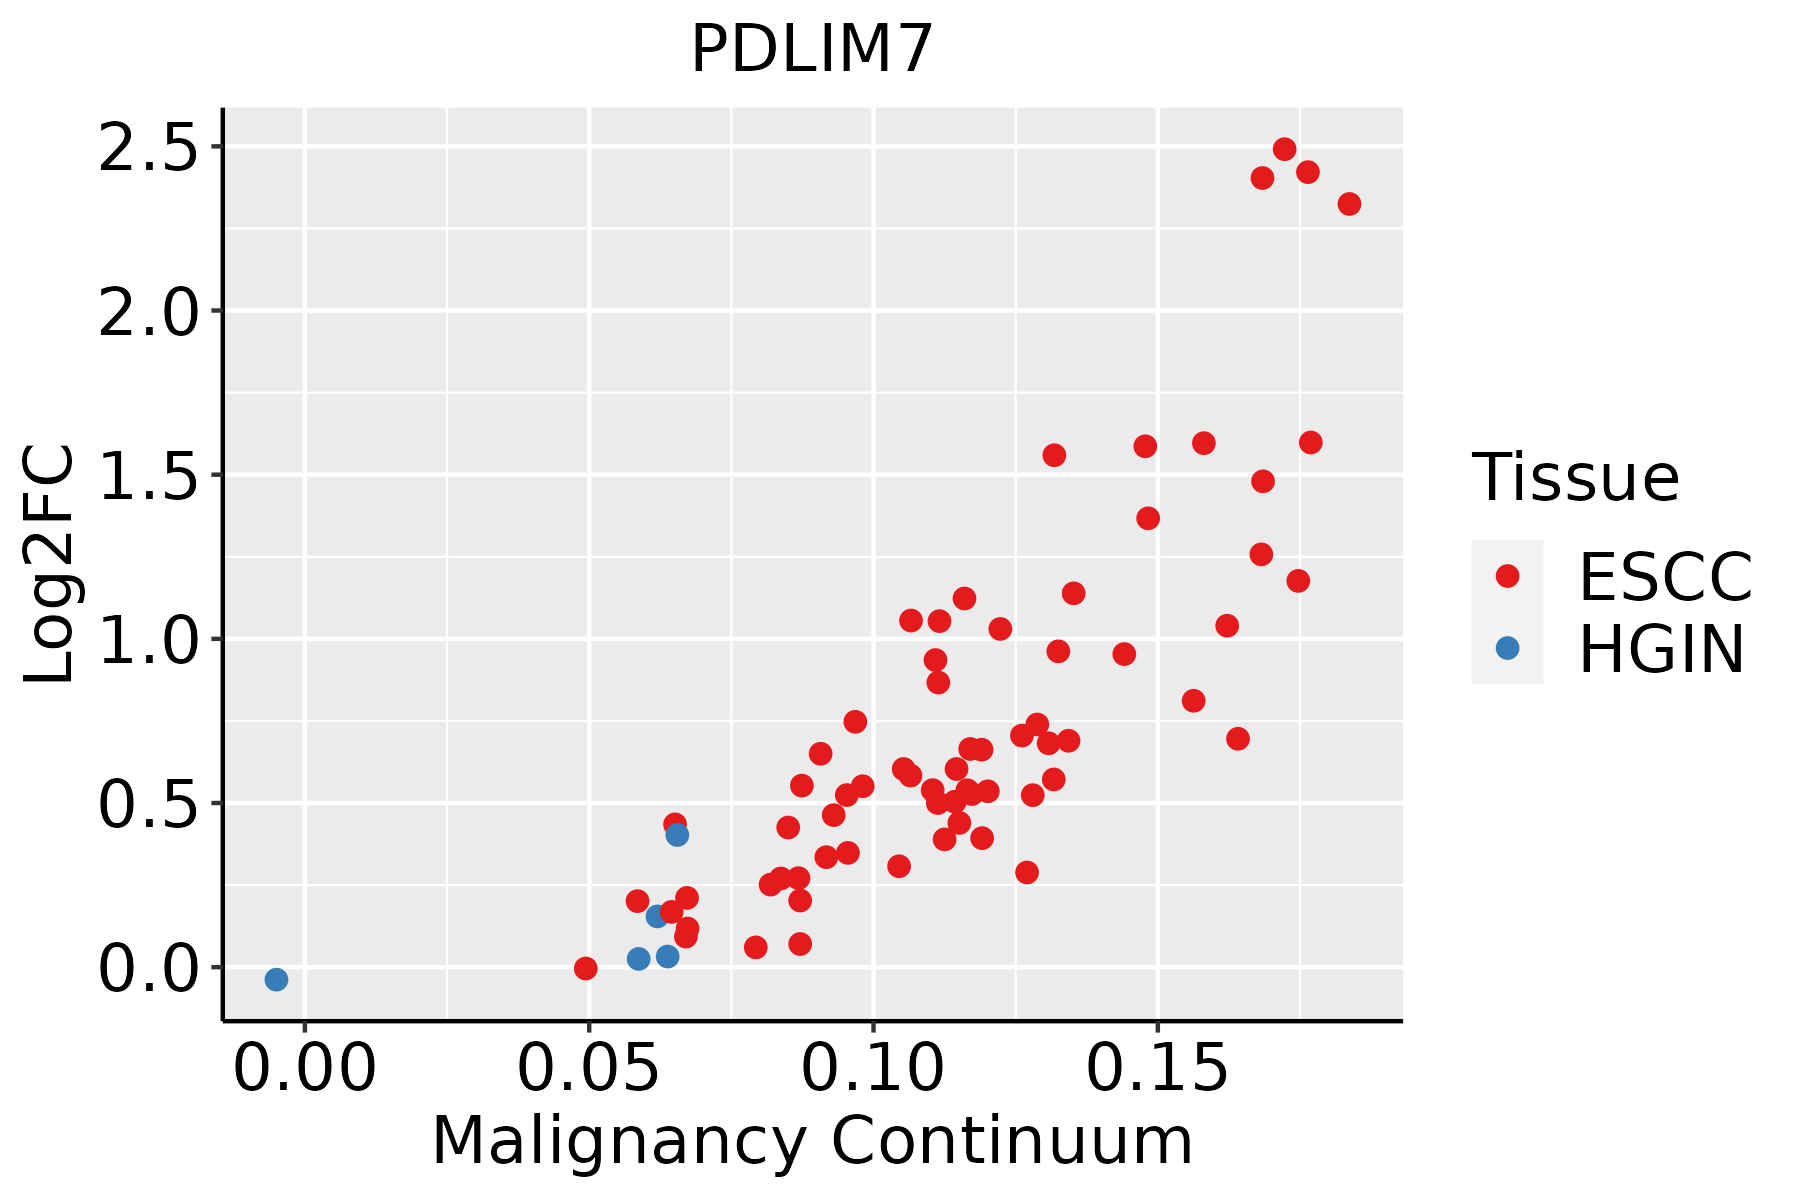 | ESCC: Esophageal squamous cell carcinoma |
| HGIN: High-grade intraepithelial neoplasias | ||
| LGIN: Low-grade intraepithelial neoplasias | ||
| Liver | 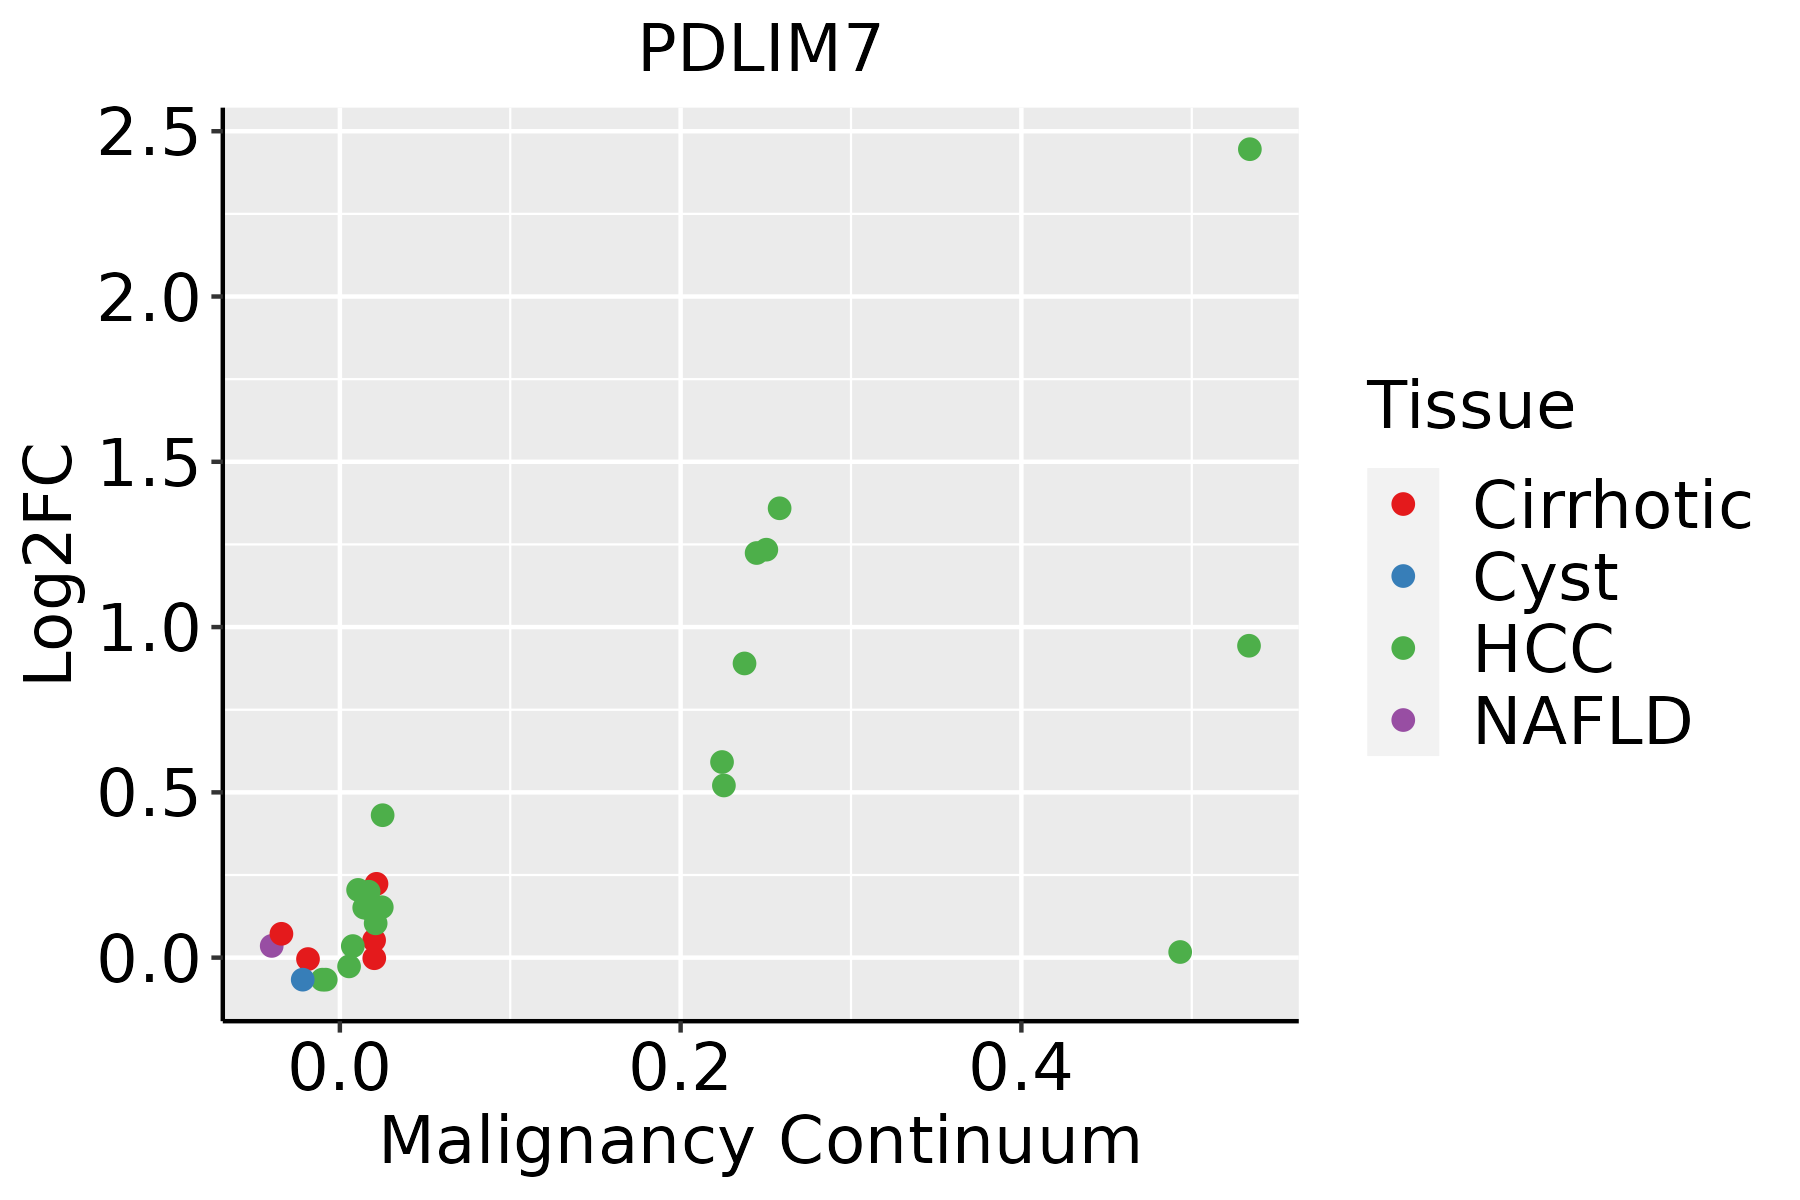 | HCC: Hepatocellular carcinoma |
| NAFLD: Non-alcoholic fatty liver disease | ||
| Oral Cavity | 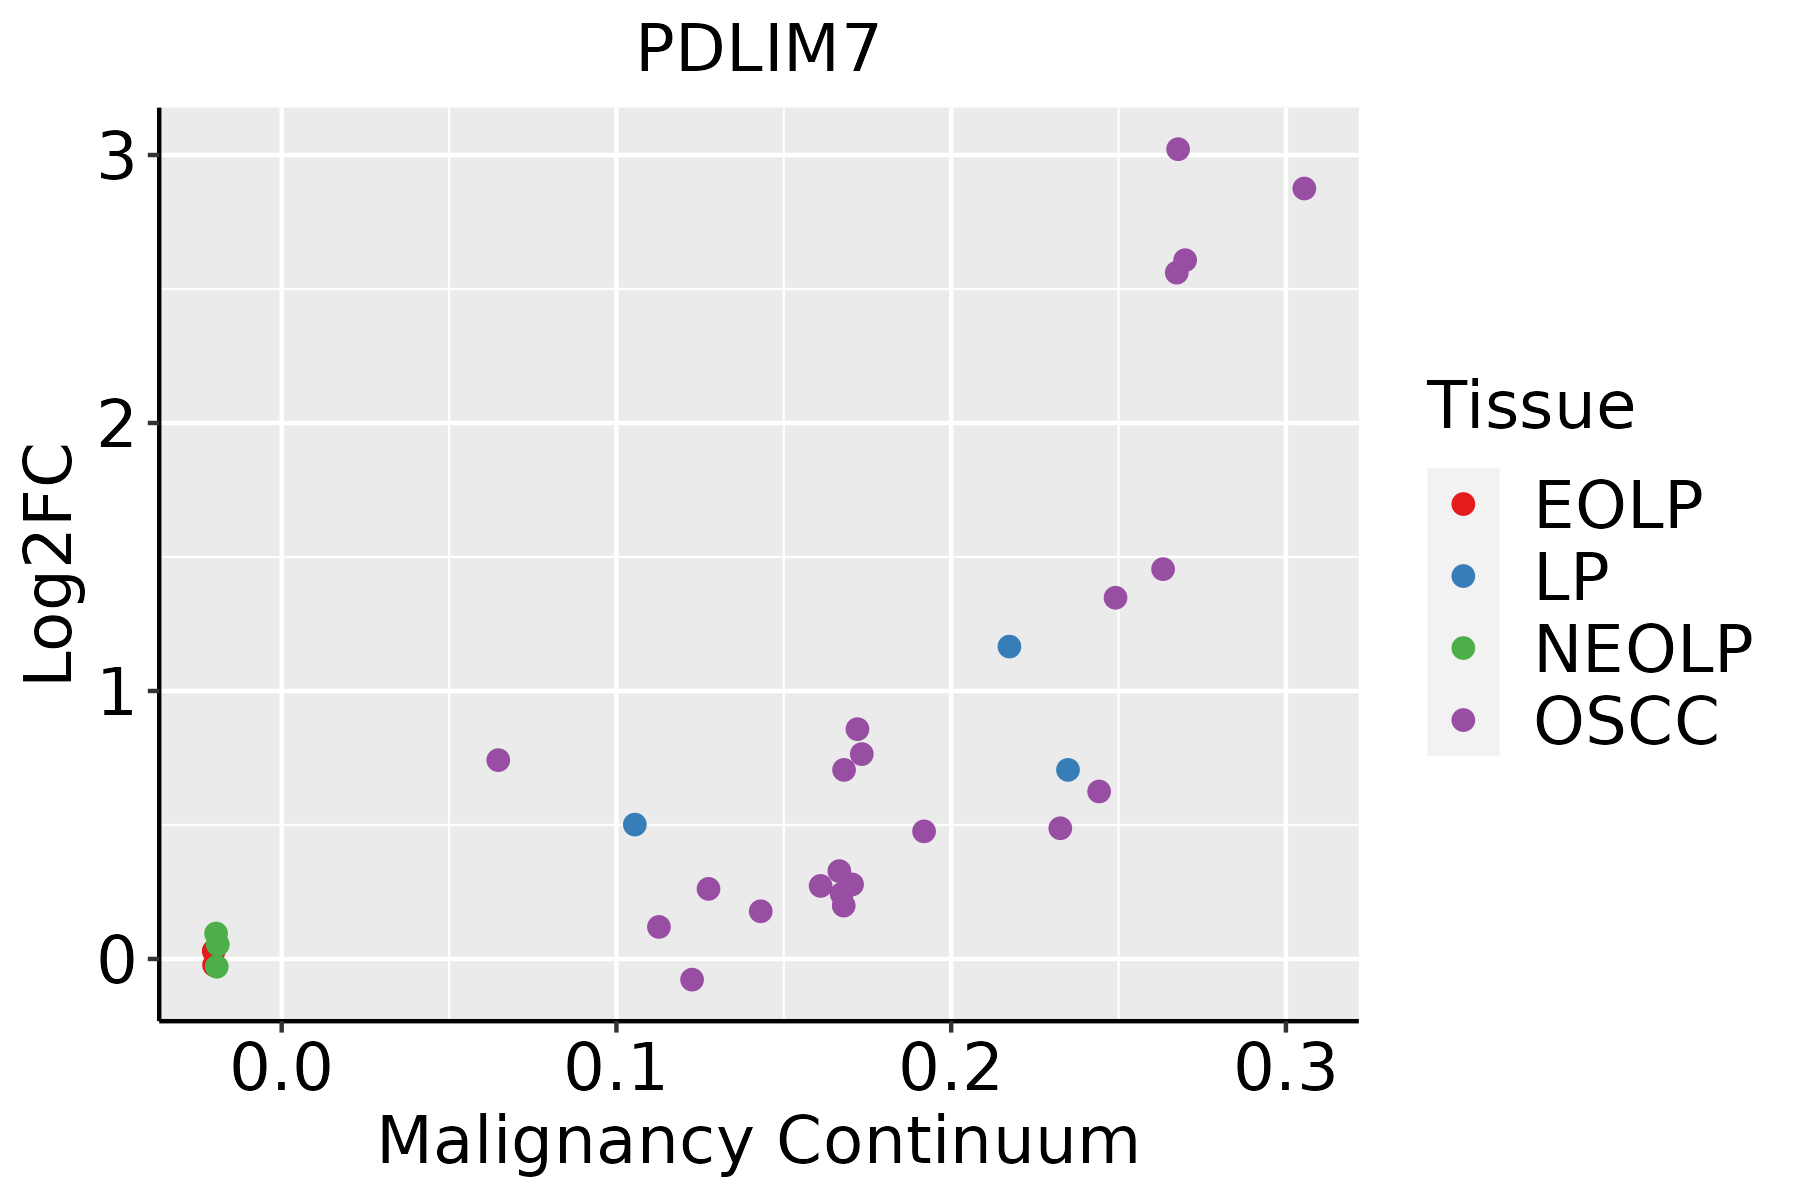 | EOLP: Erosive Oral lichen planus |
| LP: leukoplakia | ||
| NEOLP: Non-erosive oral lichen planus | ||
| OSCC: Oral squamous cell carcinoma | ||
| Skin | 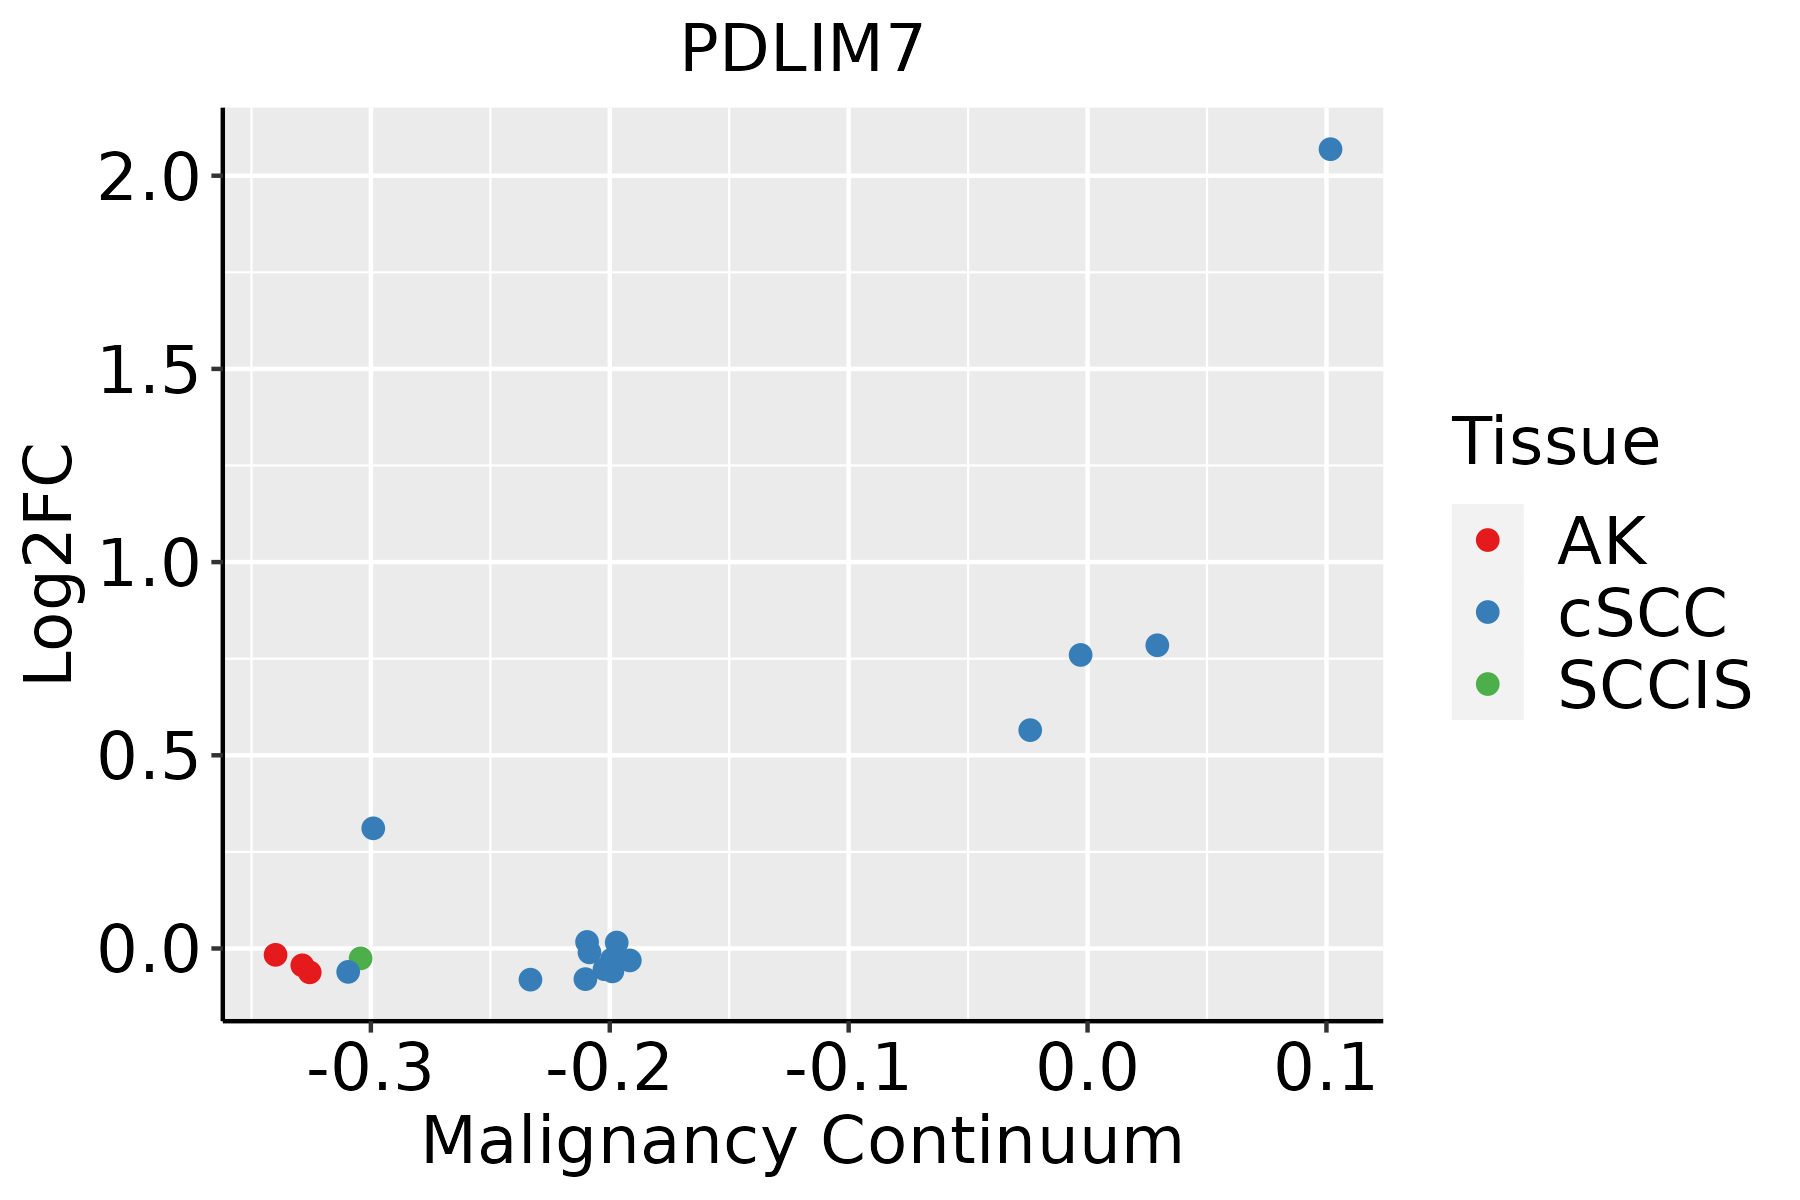 | AK: Actinic keratosis |
| cSCC: Cutaneous squamous cell carcinoma | ||
| SCCIS:squamous cell carcinoma in situ | ||
| Thyroid | 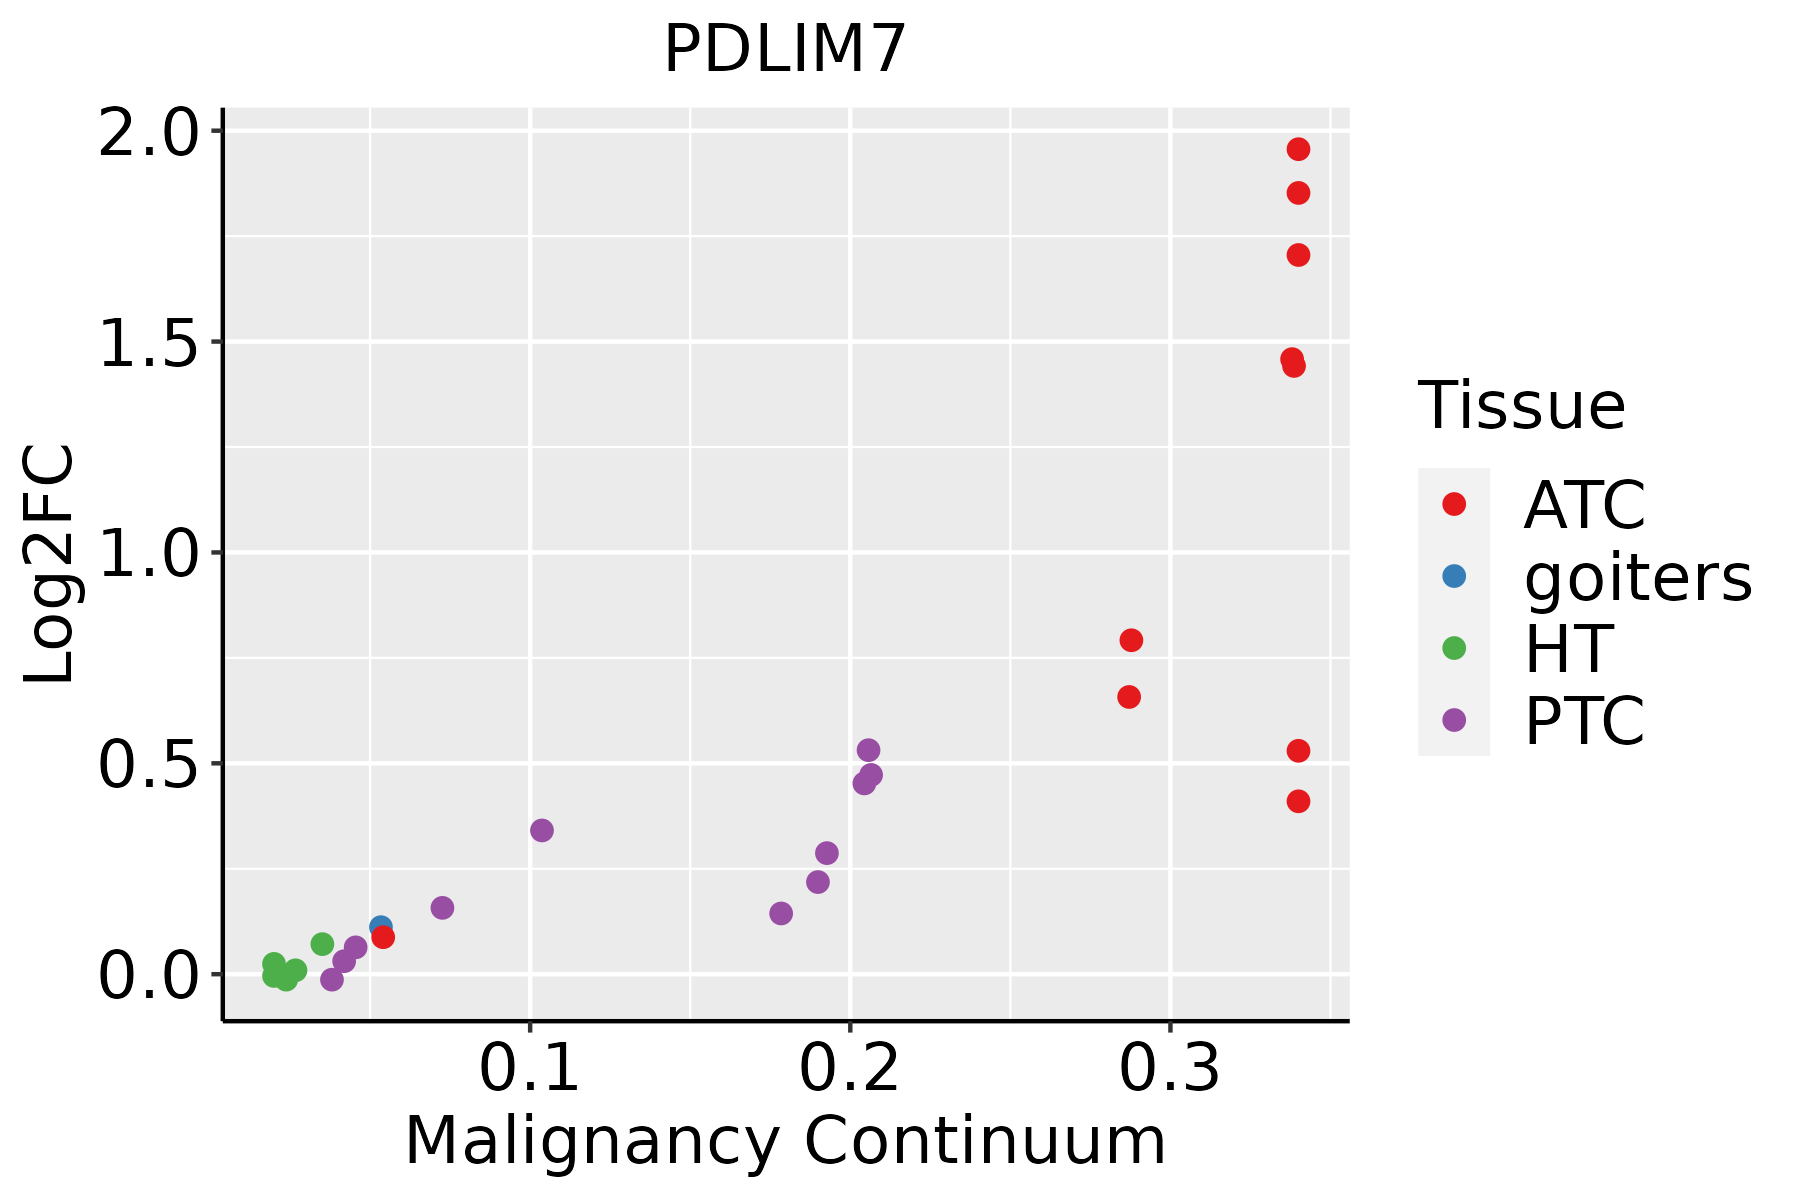 | ATC: Anaplastic thyroid cancer |
| HT: Hashimoto's thyroiditis | ||
| PTC: Papillary thyroid cancer |
| ∗log2FC in expression of this searched gene in stem-like cells from each diseased tissue sample relative to stem-like cells in normal samples in each tissue plotted against the malignancy continuum. Samples are colored based on if they are from different disease stage. |
Top |
Malignant transformation related pathway analysis |
| Find out the enriched GO biological processes and KEGG pathways involved in transition from healthy to precancer to cancer |
| Tissue | Disease Stage | Enriched GO biological Processes |
| Colorectum | AD |  |
| Colorectum | SER |  |
| Colorectum | MSS |  |
| Colorectum | MSI-H |  |
| Colorectum | FAP |  |
| ∗Top 15 enriched GO BP terms are showed in the bar plot of each disease state in each tissue. Each row represents a significant GO biological process which is colored according to the -log10(p.adjust). |
| Page: 1 2 3 4 5 6 7 8 9 |
| GO ID | Tissue | Disease Stage | Description | Gene Ratio | Bg Ratio | pvalue | p.adjust | Count |
| GO:000164918 | Esophagus | ESCC | osteoblast differentiation | 140/8552 | 229/18723 | 1.63e-06 | 1.95e-05 | 140 |
| GO:000150317 | Esophagus | ESCC | ossification | 232/8552 | 408/18723 | 3.00e-06 | 3.40e-05 | 232 |
| GO:000689818 | Esophagus | ESCC | receptor-mediated endocytosis | 142/8552 | 244/18723 | 5.22e-05 | 4.05e-04 | 142 |
| GO:00456675 | Esophagus | ESCC | regulation of osteoblast differentiation | 77/8552 | 132/18723 | 2.28e-03 | 1.00e-02 | 77 |
| GO:00456695 | Esophagus | ESCC | positive regulation of osteoblast differentiation | 43/8552 | 69/18723 | 3.93e-03 | 1.59e-02 | 43 |
| GO:000689811 | Liver | Cirrhotic | receptor-mediated endocytosis | 91/4634 | 244/18723 | 8.13e-06 | 1.22e-04 | 91 |
| GO:00016495 | Liver | Cirrhotic | osteoblast differentiation | 80/4634 | 229/18723 | 3.39e-04 | 2.91e-03 | 80 |
| GO:00015035 | Liver | Cirrhotic | ossification | 127/4634 | 408/18723 | 1.89e-03 | 1.19e-02 | 127 |
| GO:000689821 | Liver | HCC | receptor-mediated endocytosis | 134/7958 | 244/18723 | 5.73e-05 | 5.31e-04 | 134 |
| GO:000164911 | Liver | HCC | osteoblast differentiation | 115/7958 | 229/18723 | 1.08e-02 | 3.99e-02 | 115 |
| GO:000150310 | Oral cavity | OSCC | ossification | 203/7305 | 408/18723 | 5.54e-06 | 6.19e-05 | 203 |
| GO:000689810 | Oral cavity | OSCC | receptor-mediated endocytosis | 125/7305 | 244/18723 | 6.56e-05 | 5.32e-04 | 125 |
| GO:000164910 | Oral cavity | OSCC | osteoblast differentiation | 118/7305 | 229/18723 | 7.51e-05 | 5.85e-04 | 118 |
| GO:00456674 | Oral cavity | OSCC | regulation of osteoblast differentiation | 65/7305 | 132/18723 | 1.06e-02 | 3.60e-02 | 65 |
| GO:000689817 | Oral cavity | LP | receptor-mediated endocytosis | 87/4623 | 244/18723 | 7.83e-05 | 1.02e-03 | 87 |
| GO:000150315 | Oral cavity | LP | ossification | 123/4623 | 408/18723 | 6.55e-03 | 3.84e-02 | 123 |
| GO:000164916 | Oral cavity | LP | osteoblast differentiation | 73/4623 | 229/18723 | 8.09e-03 | 4.40e-02 | 73 |
| GO:000150331 | Oral cavity | NEOLP | ossification | 81/2005 | 408/18723 | 2.67e-08 | 1.15e-06 | 81 |
| GO:000689831 | Oral cavity | NEOLP | receptor-mediated endocytosis | 51/2005 | 244/18723 | 2.08e-06 | 4.87e-05 | 51 |
| GO:000164931 | Oral cavity | NEOLP | osteoblast differentiation | 47/2005 | 229/18723 | 8.59e-06 | 1.66e-04 | 47 |
| Page: 1 2 |
| Pathway ID | Tissue | Disease Stage | Description | Gene Ratio | Bg Ratio | pvalue | p.adjust | qvalue | Count |
| Page: 1 |
Top |
Cell-cell communication analysis |
| Identification of potential cell-cell interactions between two cell types and their ligand-receptor pairs for different disease states |
| Ligand | Receptor | LRpair | Pathway | Tissue | Disease Stage |
| Page: 1 |
Top |
Single-cell gene regulatory network inference analysis |
| Find out the significant the regulons (TFs) and the target genes of each regulon across cell types for different disease states |
| TF | Cell Type | Tissue | Disease Stage | Target Gene | RSS | Regulon Activity |
| ∗The dot plots of a searched regulon are shown for all cell subpopulations in each disease state of each tissue based on the regulon specific score inferred using pySCENIC and by calculating the average expression. |
| Page: 1 |
Top |
Somatic mutation of malignant transformation related genes |
| Annotation of somatic variants for genes involved in malignant transformation |
| Hugo Symbol | Variant Class | Variant Classification | dbSNP RS | HGVSc | HGVSp | HGVSp Short | SWISSPROT | BIOTYPE | SIFT | PolyPhen | Tumor Sample Barcode | Tissue | Histology | Sex | Age | Stage | Therapy Types | Drugs | Outcome |
| PDLIM7 | SNV | Missense_Mutation | c.1177N>C | p.Glu393Gln | p.E393Q | Q9NR12 | protein_coding | tolerated(0.24) | probably_damaging(0.985) | TCGA-AC-A23H-01 | Breast | breast invasive carcinoma | Female | >=65 | I/II | Unknown | Unknown | PD | |
| PDLIM7 | SNV | Missense_Mutation | c.1210G>C | p.Asp404His | p.D404H | Q9NR12 | protein_coding | deleterious(0) | probably_damaging(0.998) | TCGA-D8-A147-01 | Breast | breast invasive carcinoma | Female | <65 | I/II | Chemotherapy | doxorubicine | SD | |
| PDLIM7 | deletion | Frame_Shift_Del | novel | c.1100delN | p.Cys367LeufsTer117 | p.C367Lfs*117 | Q9NR12 | protein_coding | TCGA-D8-A27V-01 | Breast | breast invasive carcinoma | Female | <65 | I/II | Hormone Therapy | tamoxiphen | SD | ||
| PDLIM7 | SNV | Missense_Mutation | novel | c.1016C>T | p.Pro339Leu | p.P339L | Q9NR12 | protein_coding | deleterious(0) | possibly_damaging(0.801) | TCGA-2W-A8YY-01 | Cervix | cervical & endocervical cancer | Female | <65 | I/II | Chemotherapy | cisplatin | CR |
| PDLIM7 | SNV | Missense_Mutation | c.550N>A | p.Glu184Lys | p.E184K | Q9NR12 | protein_coding | tolerated(0.22) | benign(0.01) | TCGA-JW-A5VL-01 | Cervix | cervical & endocervical cancer | Female | <65 | I/II | Unknown | Unknown | SD | |
| PDLIM7 | SNV | Missense_Mutation | rs376862538 | c.529N>A | p.Glu177Lys | p.E177K | Q9NR12 | protein_coding | deleterious(0.01) | benign(0.296) | TCGA-JW-A5VL-01 | Cervix | cervical & endocervical cancer | Female | <65 | I/II | Unknown | Unknown | SD |
| PDLIM7 | SNV | Missense_Mutation | rs535394998 | c.1169N>A | p.Arg390Gln | p.R390Q | Q9NR12 | protein_coding | tolerated(0.16) | benign(0.02) | TCGA-A6-6780-01 | Colorectum | colon adenocarcinoma | Male | >=65 | I/II | Unknown | Unknown | SD |
| PDLIM7 | SNV | Missense_Mutation | c.469C>T | p.Pro157Ser | p.P157S | Q9NR12 | protein_coding | deleterious(0.03) | possibly_damaging(0.688) | TCGA-A6-A565-01 | Colorectum | colon adenocarcinoma | Female | <65 | III/IV | Unspecific | 5FU | PD | |
| PDLIM7 | SNV | Missense_Mutation | c.974G>T | p.Gly325Val | p.G325V | Q9NR12 | protein_coding | deleterious(0) | probably_damaging(0.999) | TCGA-AA-3492-01 | Colorectum | colon adenocarcinoma | Female | >=65 | I/II | Unknown | Unknown | SD | |
| PDLIM7 | SNV | Missense_Mutation | novel | c.800N>A | p.Gly267Glu | p.G267E | Q9NR12 | protein_coding | tolerated(0.56) | benign(0.11) | TCGA-AA-3522-01 | Colorectum | colon adenocarcinoma | Male | >=65 | I/II | Unknown | Unknown | SD |
| Page: 1 2 3 4 |
Top |
Related drugs of malignant transformation related genes |
| Identification of chemicals and drugs interact with genes involved in malignant transfromation |
| (DGIdb 4.0) |
| Entrez ID | Symbol | Category | Interaction Types | Drug Claim Name | Drug Name | PMIDs |
| Page: 1 |

Copyright 2023-Present -The University of Texas Health Science Center at Houston |