
|
|||||
|
 | |
| |
| |
| |
| |
| |
|
Gene: PDLIM5 |
Gene summary for PDLIM5 |
| Gene information | Species | Human | Gene symbol | PDLIM5 | Gene ID | 10611 |
| Gene name | PDZ and LIM domain 5 | |
| Gene Alias | ENH | |
| Cytomap | 4q22.3 | |
| Gene Type | protein-coding | GO ID | GO:0000902 | UniProtAcc | Q96HC4 |
Top |
Malignant transformation analysis |
| Identification of the aberrant gene expression in precancerous and cancerous lesions by comparing the gene expression of stem-like cells in diseased tissues with normal stem cells |
| Entrez ID | Symbol | Replicates | Species | Organ | Tissue | Adj P-value | Log2FC | Malignancy |
| 10611 | PDLIM5 | GSM4909282 | Human | Breast | IDC | 6.96e-06 | -3.35e-01 | -0.0288 |
| 10611 | PDLIM5 | GSM4909285 | Human | Breast | IDC | 1.36e-11 | -4.31e-01 | 0.21 |
| 10611 | PDLIM5 | GSM4909286 | Human | Breast | IDC | 7.58e-05 | -2.91e-01 | 0.1081 |
| 10611 | PDLIM5 | GSM4909293 | Human | Breast | IDC | 1.51e-10 | -4.20e-01 | 0.1581 |
| 10611 | PDLIM5 | GSM4909294 | Human | Breast | IDC | 2.23e-16 | -4.69e-01 | 0.2022 |
| 10611 | PDLIM5 | GSM4909296 | Human | Breast | IDC | 8.65e-16 | -3.89e-01 | 0.1524 |
| 10611 | PDLIM5 | GSM4909297 | Human | Breast | IDC | 2.88e-12 | -4.11e-01 | 0.1517 |
| 10611 | PDLIM5 | GSM4909298 | Human | Breast | IDC | 1.23e-04 | 9.56e-02 | 0.1551 |
| 10611 | PDLIM5 | GSM4909304 | Human | Breast | IDC | 4.33e-02 | -2.89e-01 | 0.1636 |
| 10611 | PDLIM5 | GSM4909306 | Human | Breast | IDC | 6.30e-05 | -3.61e-01 | 0.1564 |
| 10611 | PDLIM5 | GSM4909311 | Human | Breast | IDC | 4.62e-24 | -4.38e-01 | 0.1534 |
| 10611 | PDLIM5 | GSM4909312 | Human | Breast | IDC | 3.34e-09 | -3.16e-01 | 0.1552 |
| 10611 | PDLIM5 | GSM4909315 | Human | Breast | IDC | 4.30e-10 | -4.20e-01 | 0.21 |
| 10611 | PDLIM5 | GSM4909319 | Human | Breast | IDC | 4.80e-27 | -4.47e-01 | 0.1563 |
| 10611 | PDLIM5 | GSM4909320 | Human | Breast | IDC | 9.16e-05 | -4.28e-01 | 0.1575 |
| 10611 | PDLIM5 | GSM4909321 | Human | Breast | IDC | 2.85e-25 | -5.30e-01 | 0.1559 |
| 10611 | PDLIM5 | ctrl6 | Human | Breast | Precancer | 5.08e-07 | 5.07e-01 | -0.0061 |
| 10611 | PDLIM5 | NCCBC14 | Human | Breast | DCIS | 2.88e-08 | -2.69e-01 | 0.2021 |
| 10611 | PDLIM5 | NCCBC2 | Human | Breast | DCIS | 8.01e-03 | 2.02e-01 | 0.1554 |
| 10611 | PDLIM5 | NCCBC3 | Human | Breast | DCIS | 1.53e-03 | -2.84e-01 | 0.1198 |
| Page: 1 2 3 4 5 6 7 8 9 10 11 12 13 14 |
| Tissue | Expression Dynamics | Abbreviation |
| Breast | 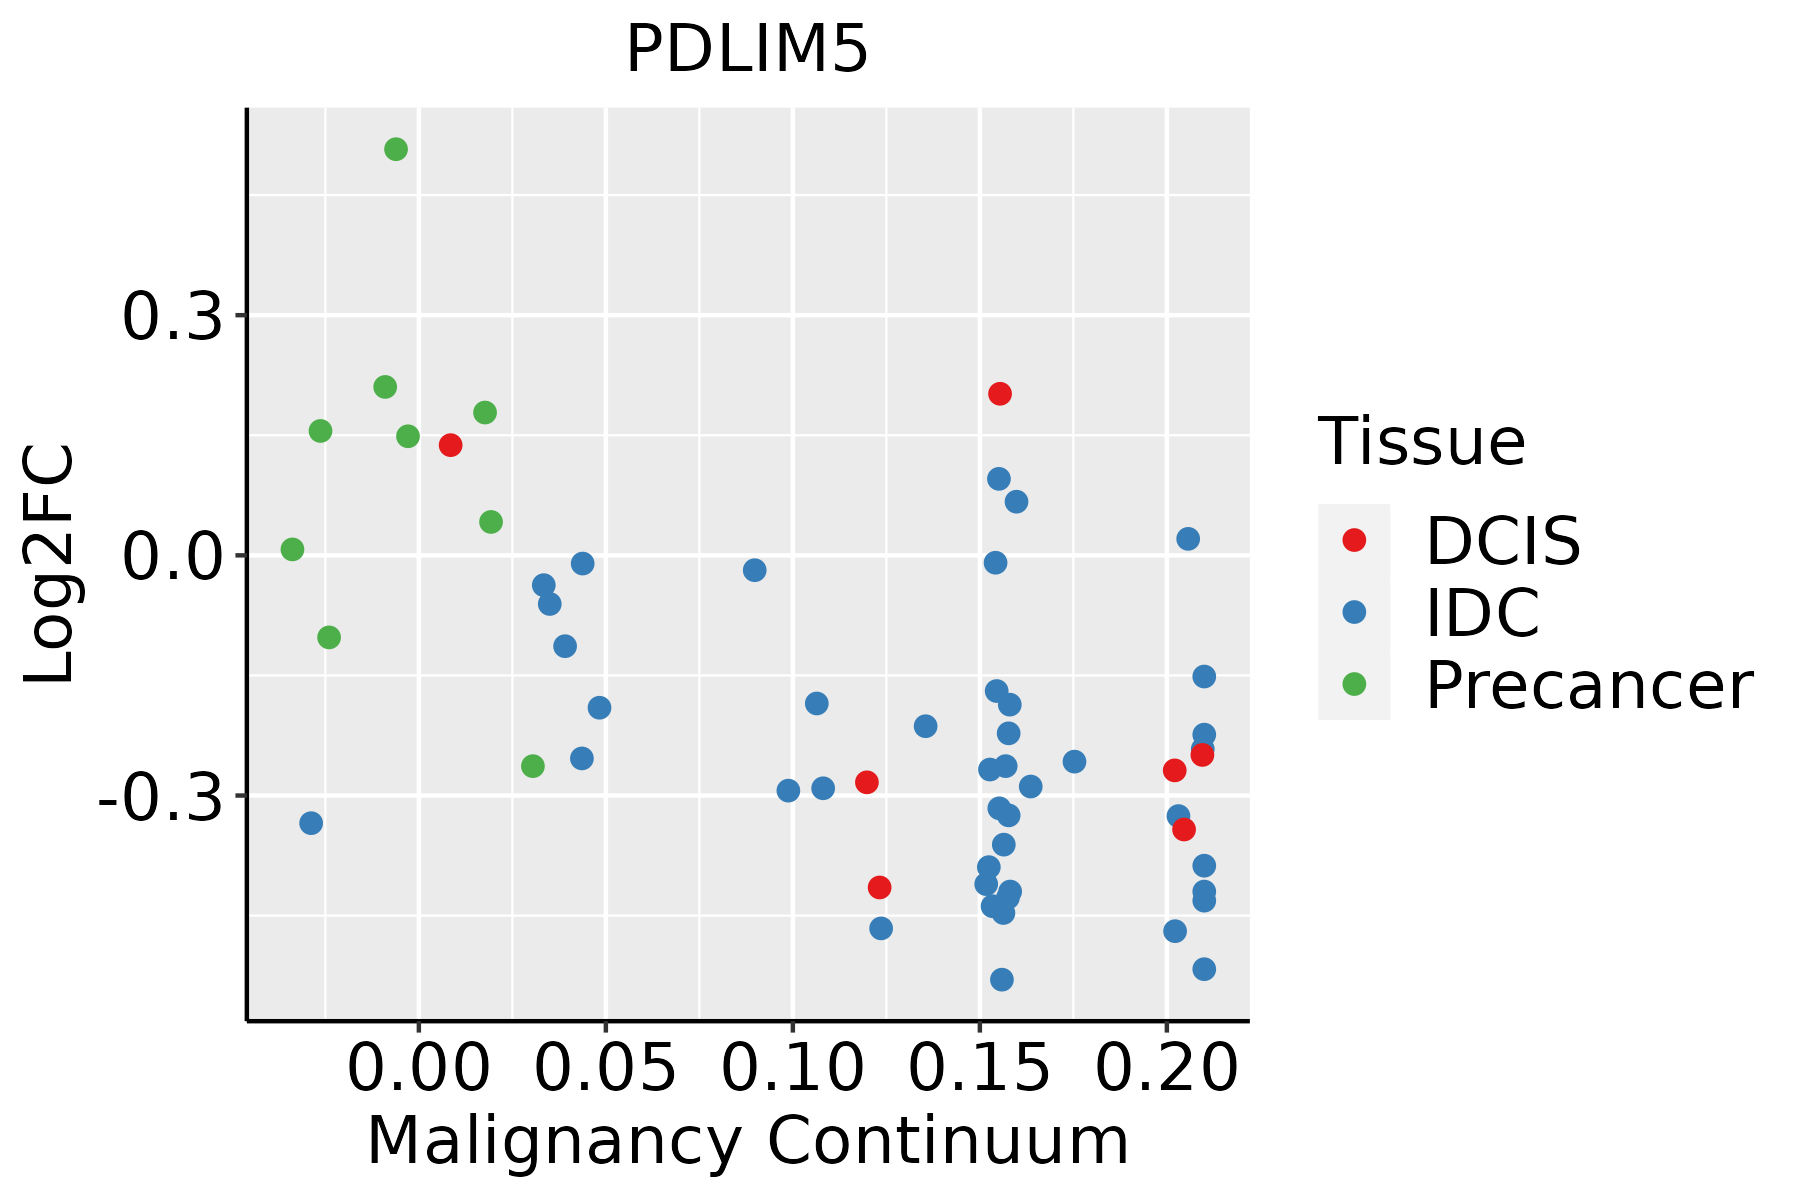 | IDC: Invasive ductal carcinoma |
| DCIS: Ductal carcinoma in situ | ||
| Precancer(BRCA1-mut): Precancerous lesion from BRCA1 mutation carriers | ||
| Cervix |  | CC: Cervix cancer |
| HSIL_HPV: HPV-infected high-grade squamous intraepithelial lesions | ||
| N_HPV: HPV-infected normal cervix | ||
| Colorectum (GSE201348) |  | FAP: Familial adenomatous polyposis |
| CRC: Colorectal cancer | ||
| Colorectum (HTA11) |  | AD: Adenomas |
| SER: Sessile serrated lesions | ||
| MSI-H: Microsatellite-high colorectal cancer | ||
| MSS: Microsatellite stable colorectal cancer | ||
| Endometrium | 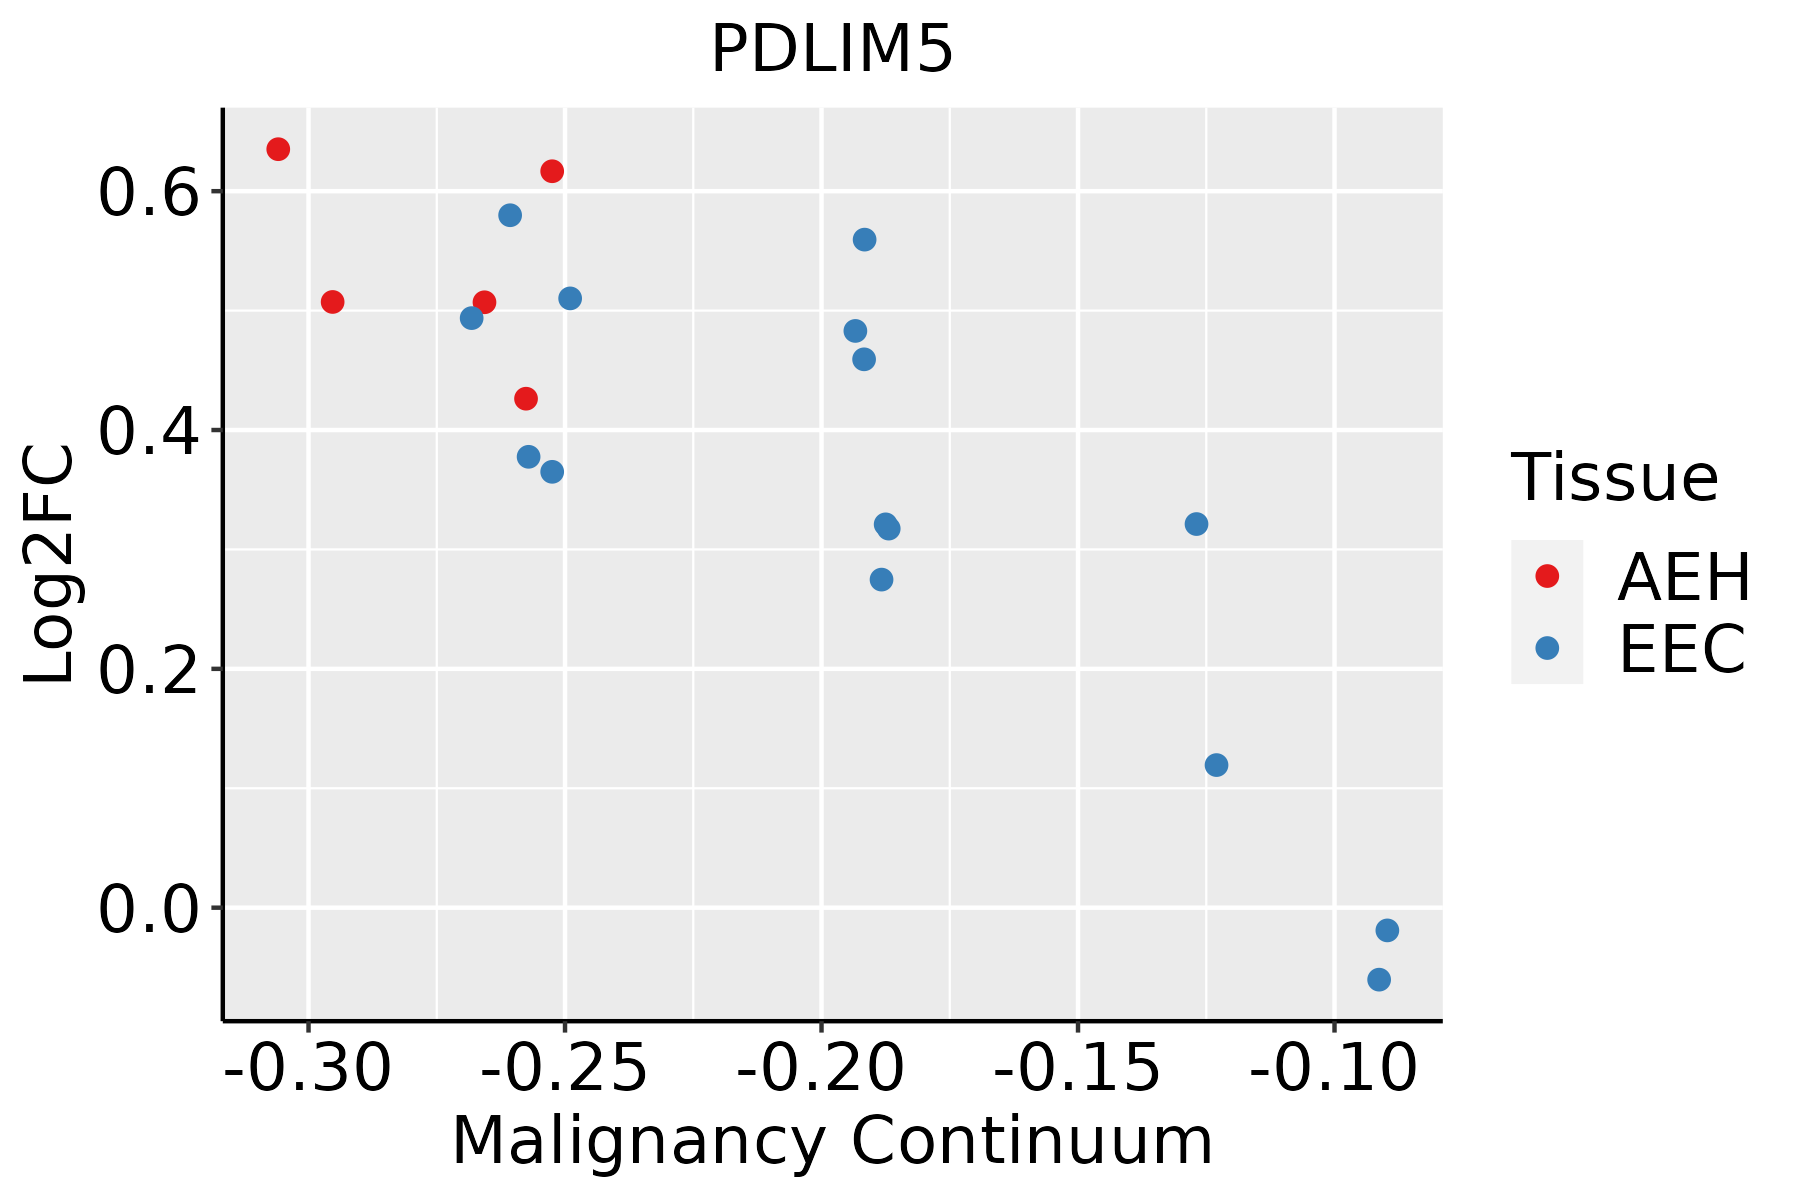 | AEH: Atypical endometrial hyperplasia |
| EEC: Endometrioid Cancer | ||
| Esophagus |  | ESCC: Esophageal squamous cell carcinoma |
| HGIN: High-grade intraepithelial neoplasias | ||
| LGIN: Low-grade intraepithelial neoplasias | ||
| Liver |  | HCC: Hepatocellular carcinoma |
| NAFLD: Non-alcoholic fatty liver disease | ||
| Lung | 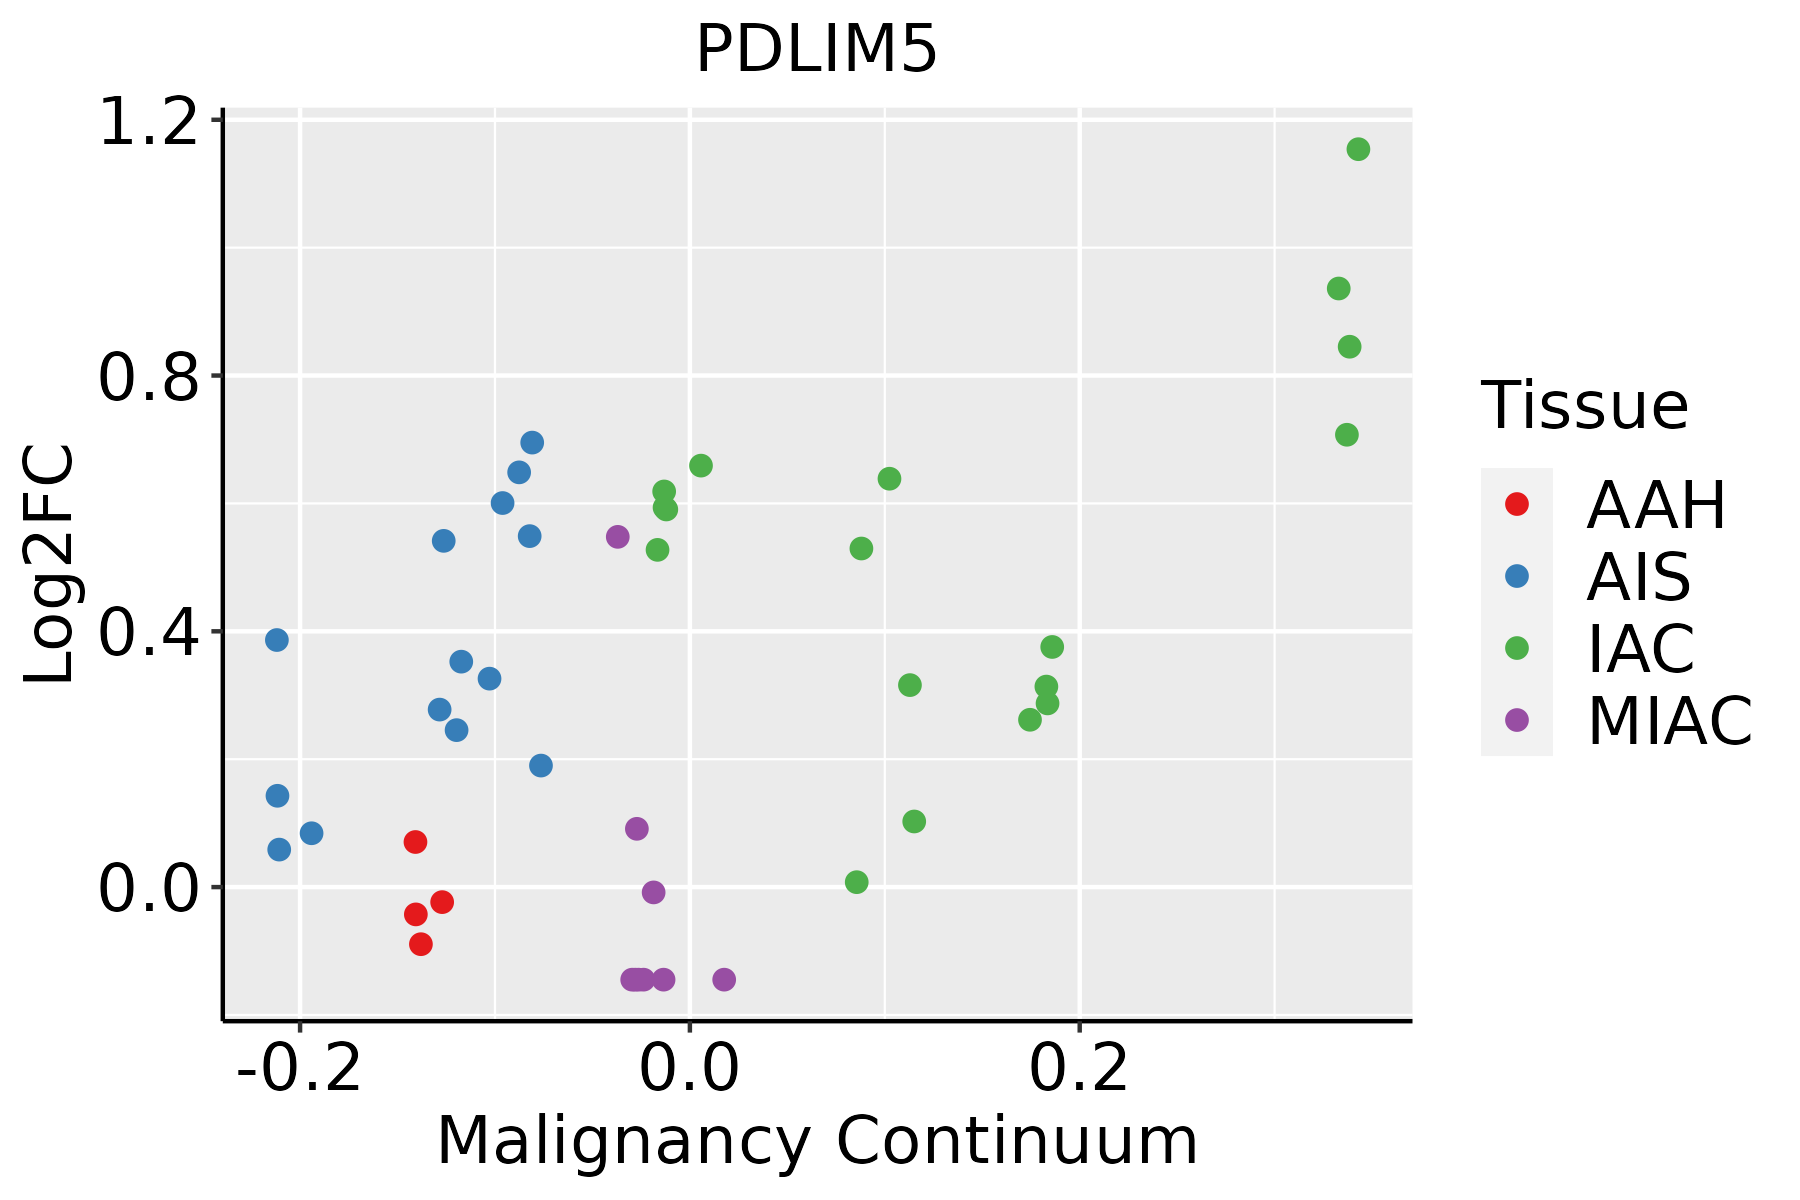 | AAH: Atypical adenomatous hyperplasia |
| AIS: Adenocarcinoma in situ | ||
| IAC: Invasive lung adenocarcinoma | ||
| MIA: Minimally invasive adenocarcinoma | ||
| Oral Cavity | 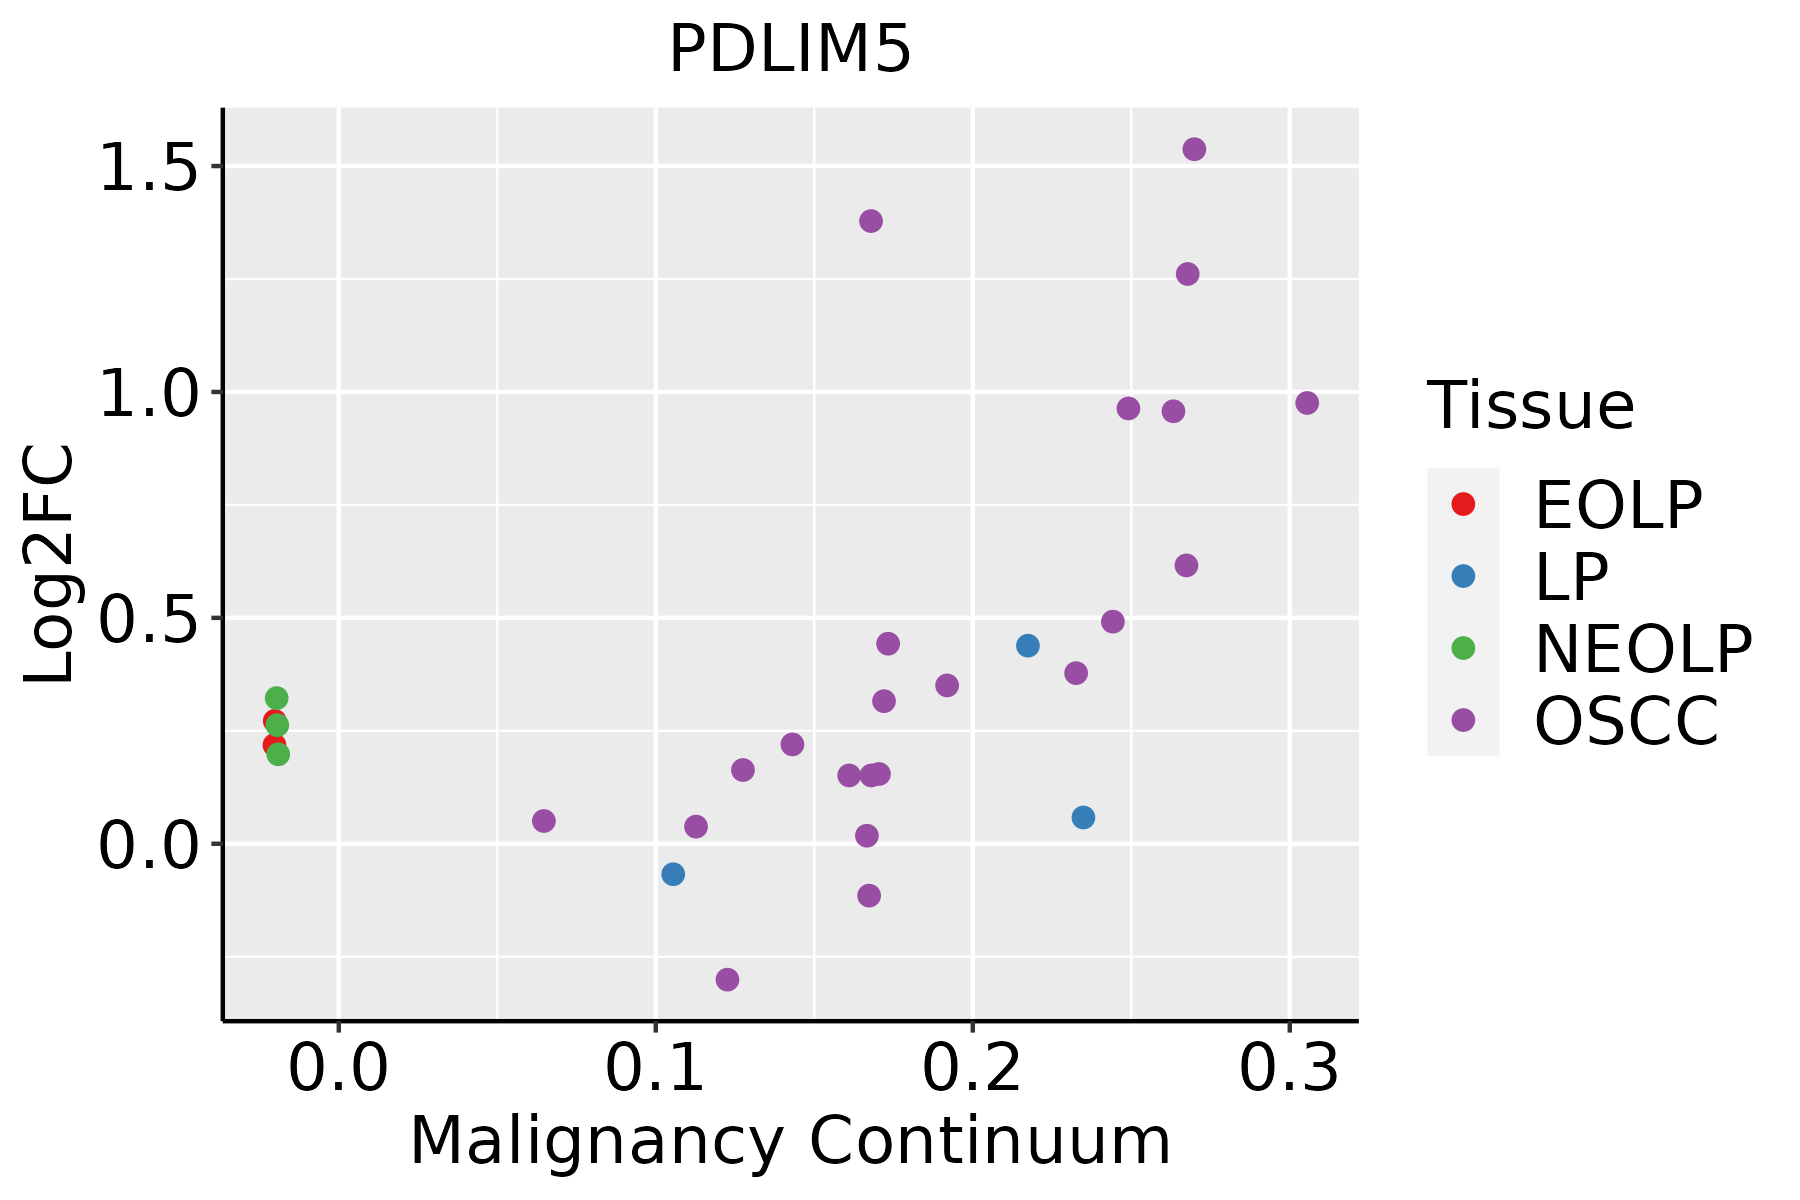 | EOLP: Erosive Oral lichen planus |
| LP: leukoplakia | ||
| NEOLP: Non-erosive oral lichen planus | ||
| OSCC: Oral squamous cell carcinoma | ||
| Prostate | 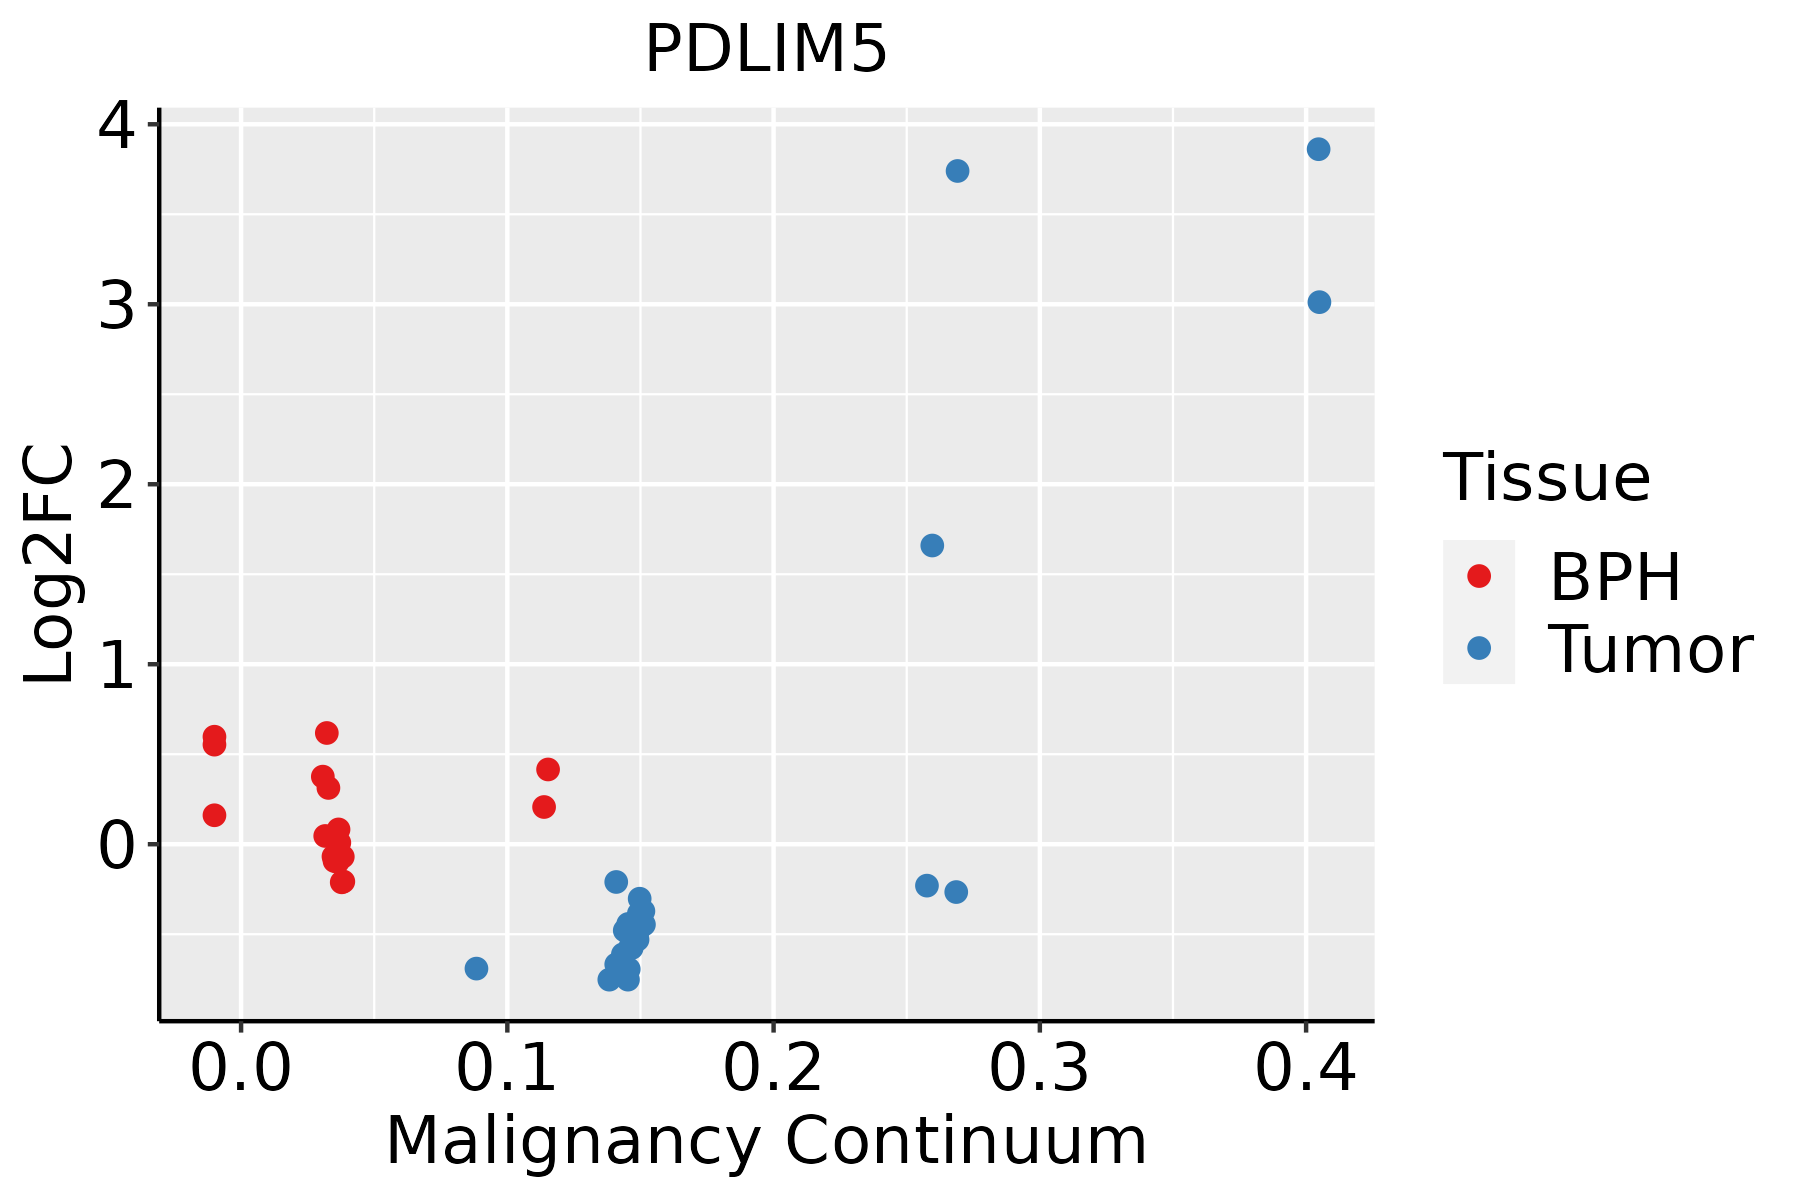 | BPH: Benign Prostatic Hyperplasia |
| Skin |  | AK: Actinic keratosis |
| cSCC: Cutaneous squamous cell carcinoma | ||
| SCCIS:squamous cell carcinoma in situ | ||
| Thyroid |  | ATC: Anaplastic thyroid cancer |
| HT: Hashimoto's thyroiditis | ||
| PTC: Papillary thyroid cancer |
| ∗log2FC in expression of this searched gene in stem-like cells from each diseased tissue sample relative to stem-like cells in normal samples in each tissue plotted against the malignancy continuum. Samples are colored based on if they are from different disease stage. |
Top |
Malignant transformation related pathway analysis |
| Find out the enriched GO biological processes and KEGG pathways involved in transition from healthy to precancer to cancer |
| Tissue | Disease Stage | Enriched GO biological Processes |
| Colorectum | AD |  |
| Colorectum | SER |  |
| Colorectum | MSS |  |
| Colorectum | MSI-H |  |
| Colorectum | FAP |  |
| ∗Top 15 enriched GO BP terms are showed in the bar plot of each disease state in each tissue. Each row represents a significant GO biological process which is colored according to the -log10(p.adjust). |
| Page: 1 2 3 4 5 6 7 8 9 |
| GO ID | Tissue | Disease Stage | Description | Gene Ratio | Bg Ratio | pvalue | p.adjust | Count |
| GO:00160497 | Breast | Precancer | cell growth | 46/1080 | 482/18723 | 5.63e-04 | 7.16e-03 | 46 |
| GO:00605374 | Breast | Precancer | muscle tissue development | 37/1080 | 403/18723 | 3.60e-03 | 2.98e-02 | 37 |
| GO:00147063 | Breast | Precancer | striated muscle tissue development | 35/1080 | 384/18723 | 5.10e-03 | 3.83e-02 | 35 |
| GO:006053711 | Breast | IDC | muscle tissue development | 50/1434 | 403/18723 | 4.91e-04 | 6.45e-03 | 50 |
| GO:001604913 | Breast | IDC | cell growth | 56/1434 | 482/18723 | 1.16e-03 | 1.26e-02 | 56 |
| GO:00147061 | Breast | IDC | striated muscle tissue development | 46/1434 | 384/18723 | 1.67e-03 | 1.63e-02 | 46 |
| GO:00426923 | Breast | IDC | muscle cell differentiation | 44/1434 | 384/18723 | 4.77e-03 | 3.66e-02 | 44 |
| GO:00030125 | Breast | IDC | muscle system process | 50/1434 | 452/18723 | 5.52e-03 | 4.05e-02 | 50 |
| GO:00511463 | Breast | IDC | striated muscle cell differentiation | 34/1434 | 283/18723 | 6.00e-03 | 4.31e-02 | 34 |
| GO:006053721 | Breast | DCIS | muscle tissue development | 50/1390 | 403/18723 | 2.39e-04 | 3.74e-03 | 50 |
| GO:00147062 | Breast | DCIS | striated muscle tissue development | 46/1390 | 384/18723 | 8.88e-04 | 1.01e-02 | 46 |
| GO:001604923 | Breast | DCIS | cell growth | 54/1390 | 482/18723 | 1.60e-03 | 1.59e-02 | 54 |
| GO:000301212 | Breast | DCIS | muscle system process | 50/1390 | 452/18723 | 3.02e-03 | 2.57e-02 | 50 |
| GO:004269211 | Breast | DCIS | muscle cell differentiation | 43/1390 | 384/18723 | 4.56e-03 | 3.49e-02 | 43 |
| GO:005114611 | Breast | DCIS | striated muscle cell differentiation | 33/1390 | 283/18723 | 6.63e-03 | 4.62e-02 | 33 |
| GO:00343298 | Cervix | CC | cell junction assembly | 88/2311 | 420/18723 | 3.42e-07 | 1.38e-05 | 88 |
| GO:00163587 | Cervix | CC | dendrite development | 58/2311 | 243/18723 | 4.52e-07 | 1.76e-05 | 58 |
| GO:00109757 | Cervix | CC | regulation of neuron projection development | 88/2311 | 445/18723 | 4.26e-06 | 1.09e-04 | 88 |
| GO:00160498 | Cervix | CC | cell growth | 92/2311 | 482/18723 | 1.16e-05 | 2.49e-04 | 92 |
| GO:00609965 | Cervix | CC | dendritic spine development | 28/2311 | 99/18723 | 1.61e-05 | 3.15e-04 | 28 |
| Page: 1 2 3 4 5 6 7 8 9 10 11 12 13 14 15 16 17 18 19 20 21 |
| Pathway ID | Tissue | Disease Stage | Description | Gene Ratio | Bg Ratio | pvalue | p.adjust | qvalue | Count |
| Page: 1 |
Top |
Cell-cell communication analysis |
| Identification of potential cell-cell interactions between two cell types and their ligand-receptor pairs for different disease states |
| Ligand | Receptor | LRpair | Pathway | Tissue | Disease Stage |
| Page: 1 |
Top |
Single-cell gene regulatory network inference analysis |
| Find out the significant the regulons (TFs) and the target genes of each regulon across cell types for different disease states |
| TF | Cell Type | Tissue | Disease Stage | Target Gene | RSS | Regulon Activity |
| PDLIM5 | M2MAC | Oral cavity | EOLP | LCN2,RFXAP,PITX1, etc. | 8.18e-02 |  |
| PDLIM5 | PLA | Oral cavity | LP | LCN2,RFXAP,PITX1, etc. | 4.72e-01 |  |
| PDLIM5 | M2MAC | Oral cavity | NEOLP | LCN2,RFXAP,PITX1, etc. | 1.12e-01 |  |
| PDLIM5 | cDC | Oral cavity | OSCC | LCN2,RFXAP,PITX1, etc. | 5.10e-01 |  |
| ∗The dot plots of a searched regulon are shown for all cell subpopulations in each disease state of each tissue based on the regulon specific score inferred using pySCENIC and by calculating the average expression. |
| Page: 1 |
Top |
Somatic mutation of malignant transformation related genes |
| Annotation of somatic variants for genes involved in malignant transformation |
| Hugo Symbol | Variant Class | Variant Classification | dbSNP RS | HGVSc | HGVSp | HGVSp Short | SWISSPROT | BIOTYPE | SIFT | PolyPhen | Tumor Sample Barcode | Tissue | Histology | Sex | Age | Stage | Therapy Types | Drugs | Outcome |
| PDLIM5 | SNV | Missense_Mutation | c.160G>C | p.Asp54His | p.D54H | Q96HC4 | protein_coding | deleterious(0) | probably_damaging(0.964) | TCGA-PE-A5DE-01 | Breast | breast invasive carcinoma | Female | <65 | I/II | Chemotherapy | taxotere | CR | |
| PDLIM5 | SNV | Missense_Mutation | c.151N>G | p.Leu51Val | p.L51V | Q96HC4 | protein_coding | tolerated(0.57) | benign(0.017) | TCGA-C5-A1BK-01 | Cervix | cervical & endocervical cancer | Female | <65 | I/II | Unknown | Unknown | SD | |
| PDLIM5 | SNV | Missense_Mutation | novel | c.1148C>T | p.Ser383Phe | p.S383F | Q96HC4 | protein_coding | deleterious(0.01) | benign(0.311) | TCGA-EA-A3HU-01 | Cervix | cervical & endocervical cancer | Female | <65 | I/II | Unknown | Unknown | SD |
| PDLIM5 | SNV | Missense_Mutation | novel | c.82N>A | p.Leu28Met | p.L28M | Q96HC4 | protein_coding | deleterious(0) | probably_damaging(0.999) | TCGA-VS-A9U7-01 | Cervix | cervical & endocervical cancer | Female | <65 | I/II | Chemotherapy | cisplatin | CR |
| PDLIM5 | SNV | Missense_Mutation | novel | c.1387G>A | p.Ala463Thr | p.A463T | Q96HC4 | protein_coding | deleterious(0) | probably_damaging(1) | TCGA-5M-AAT6-01 | Colorectum | colon adenocarcinoma | Female | <65 | III/IV | Unknown | Unknown | PD |
| PDLIM5 | SNV | Missense_Mutation | rs201891054 | c.427N>T | p.Arg143Cys | p.R143C | Q96HC4 | protein_coding | deleterious(0.03) | possibly_damaging(0.764) | TCGA-A6-6654-01 | Colorectum | colon adenocarcinoma | Female | >=65 | III/IV | Chemotherapy | oxaliplatin | SD |
| PDLIM5 | SNV | Missense_Mutation | novel | c.218N>A | p.Cys73Tyr | p.C73Y | Q96HC4 | protein_coding | deleterious(0) | probably_damaging(0.972) | TCGA-A6-A565-01 | Colorectum | colon adenocarcinoma | Female | <65 | III/IV | Unspecific | 5FU | PD |
| PDLIM5 | SNV | Missense_Mutation | novel | c.1076N>C | p.Leu359Pro | p.L359P | Q96HC4 | protein_coding | tolerated(0.29) | benign(0.001) | TCGA-AA-3845-01 | Colorectum | colon adenocarcinoma | Female | >=65 | I/II | Unknown | Unknown | PD |
| PDLIM5 | SNV | Missense_Mutation | novel | c.1334N>A | p.Arg445Gln | p.R445Q | Q96HC4 | protein_coding | deleterious(0) | probably_damaging(0.997) | TCGA-AZ-4315-01 | Colorectum | colon adenocarcinoma | Male | <65 | I/II | Unknown | Unknown | SD |
| PDLIM5 | SNV | Missense_Mutation | c.1090N>G | p.Ser364Ala | p.S364A | Q96HC4 | protein_coding | tolerated(0.16) | benign(0.003) | TCGA-CM-5861-01 | Colorectum | colon adenocarcinoma | Female | <65 | I/II | Unknown | Unknown | PD |
| Page: 1 2 3 4 5 |
Top |
Related drugs of malignant transformation related genes |
| Identification of chemicals and drugs interact with genes involved in malignant transfromation |
| (DGIdb 4.0) |
| Entrez ID | Symbol | Category | Interaction Types | Drug Claim Name | Drug Name | PMIDs |
| Page: 1 |

Copyright 2023-Present -The University of Texas Health Science Center at Houston |