
|
|||||
|
 | |
| |
| |
| |
| |
| |
|
Gene: PDLIM4 |
Gene summary for PDLIM4 |
| Gene information | Species | Human | Gene symbol | PDLIM4 | Gene ID | 8572 |
| Gene name | PDZ and LIM domain 4 | |
| Gene Alias | RIL | |
| Cytomap | 5q31.1 | |
| Gene Type | protein-coding | GO ID | GO:0006996 | UniProtAcc | A0A0S2Z4N4 |
Top |
Malignant transformation analysis |
| Identification of the aberrant gene expression in precancerous and cancerous lesions by comparing the gene expression of stem-like cells in diseased tissues with normal stem cells |
| Entrez ID | Symbol | Replicates | Species | Organ | Tissue | Adj P-value | Log2FC | Malignancy |
| 8572 | PDLIM4 | GSM4909290 | Human | Breast | IDC | 4.89e-12 | -3.85e-01 | 0.2096 |
| 8572 | PDLIM4 | GSM4909291 | Human | Breast | IDC | 2.17e-03 | -3.36e-01 | 0.1753 |
| 8572 | PDLIM4 | GSM4909294 | Human | Breast | IDC | 1.21e-18 | -3.55e-01 | 0.2022 |
| 8572 | PDLIM4 | GSM4909296 | Human | Breast | IDC | 1.10e-12 | -3.24e-01 | 0.1524 |
| 8572 | PDLIM4 | GSM4909297 | Human | Breast | IDC | 2.17e-12 | -3.12e-01 | 0.1517 |
| 8572 | PDLIM4 | GSM4909298 | Human | Breast | IDC | 6.07e-03 | -2.47e-01 | 0.1551 |
| 8572 | PDLIM4 | GSM4909301 | Human | Breast | IDC | 2.97e-16 | -3.58e-01 | 0.1577 |
| 8572 | PDLIM4 | GSM4909302 | Human | Breast | IDC | 6.38e-07 | -3.18e-01 | 0.1545 |
| 8572 | PDLIM4 | GSM4909304 | Human | Breast | IDC | 2.64e-16 | -3.76e-01 | 0.1636 |
| 8572 | PDLIM4 | GSM4909307 | Human | Breast | IDC | 5.47e-03 | -2.40e-01 | 0.1569 |
| 8572 | PDLIM4 | GSM4909308 | Human | Breast | IDC | 7.18e-03 | -2.94e-01 | 0.158 |
| 8572 | PDLIM4 | GSM4909311 | Human | Breast | IDC | 3.95e-18 | -2.93e-01 | 0.1534 |
| 8572 | PDLIM4 | GSM4909312 | Human | Breast | IDC | 4.26e-10 | -3.12e-01 | 0.1552 |
| 8572 | PDLIM4 | GSM4909315 | Human | Breast | IDC | 9.92e-21 | -3.85e-01 | 0.21 |
| 8572 | PDLIM4 | GSM4909316 | Human | Breast | IDC | 3.34e-04 | -3.85e-01 | 0.21 |
| 8572 | PDLIM4 | GSM4909319 | Human | Breast | IDC | 1.45e-21 | -3.81e-01 | 0.1563 |
| 8572 | PDLIM4 | GSM4909320 | Human | Breast | IDC | 4.42e-05 | -3.85e-01 | 0.1575 |
| 8572 | PDLIM4 | GSM4909321 | Human | Breast | IDC | 7.78e-22 | -3.85e-01 | 0.1559 |
| 8572 | PDLIM4 | ctrl6 | Human | Breast | Precancer | 2.35e-04 | 4.02e-01 | -0.0061 |
| 8572 | PDLIM4 | brca3 | Human | Breast | Precancer | 1.91e-16 | 4.83e-01 | -0.0263 |
| Page: 1 2 3 4 5 6 7 8 9 10 |
| Tissue | Expression Dynamics | Abbreviation |
| Breast | 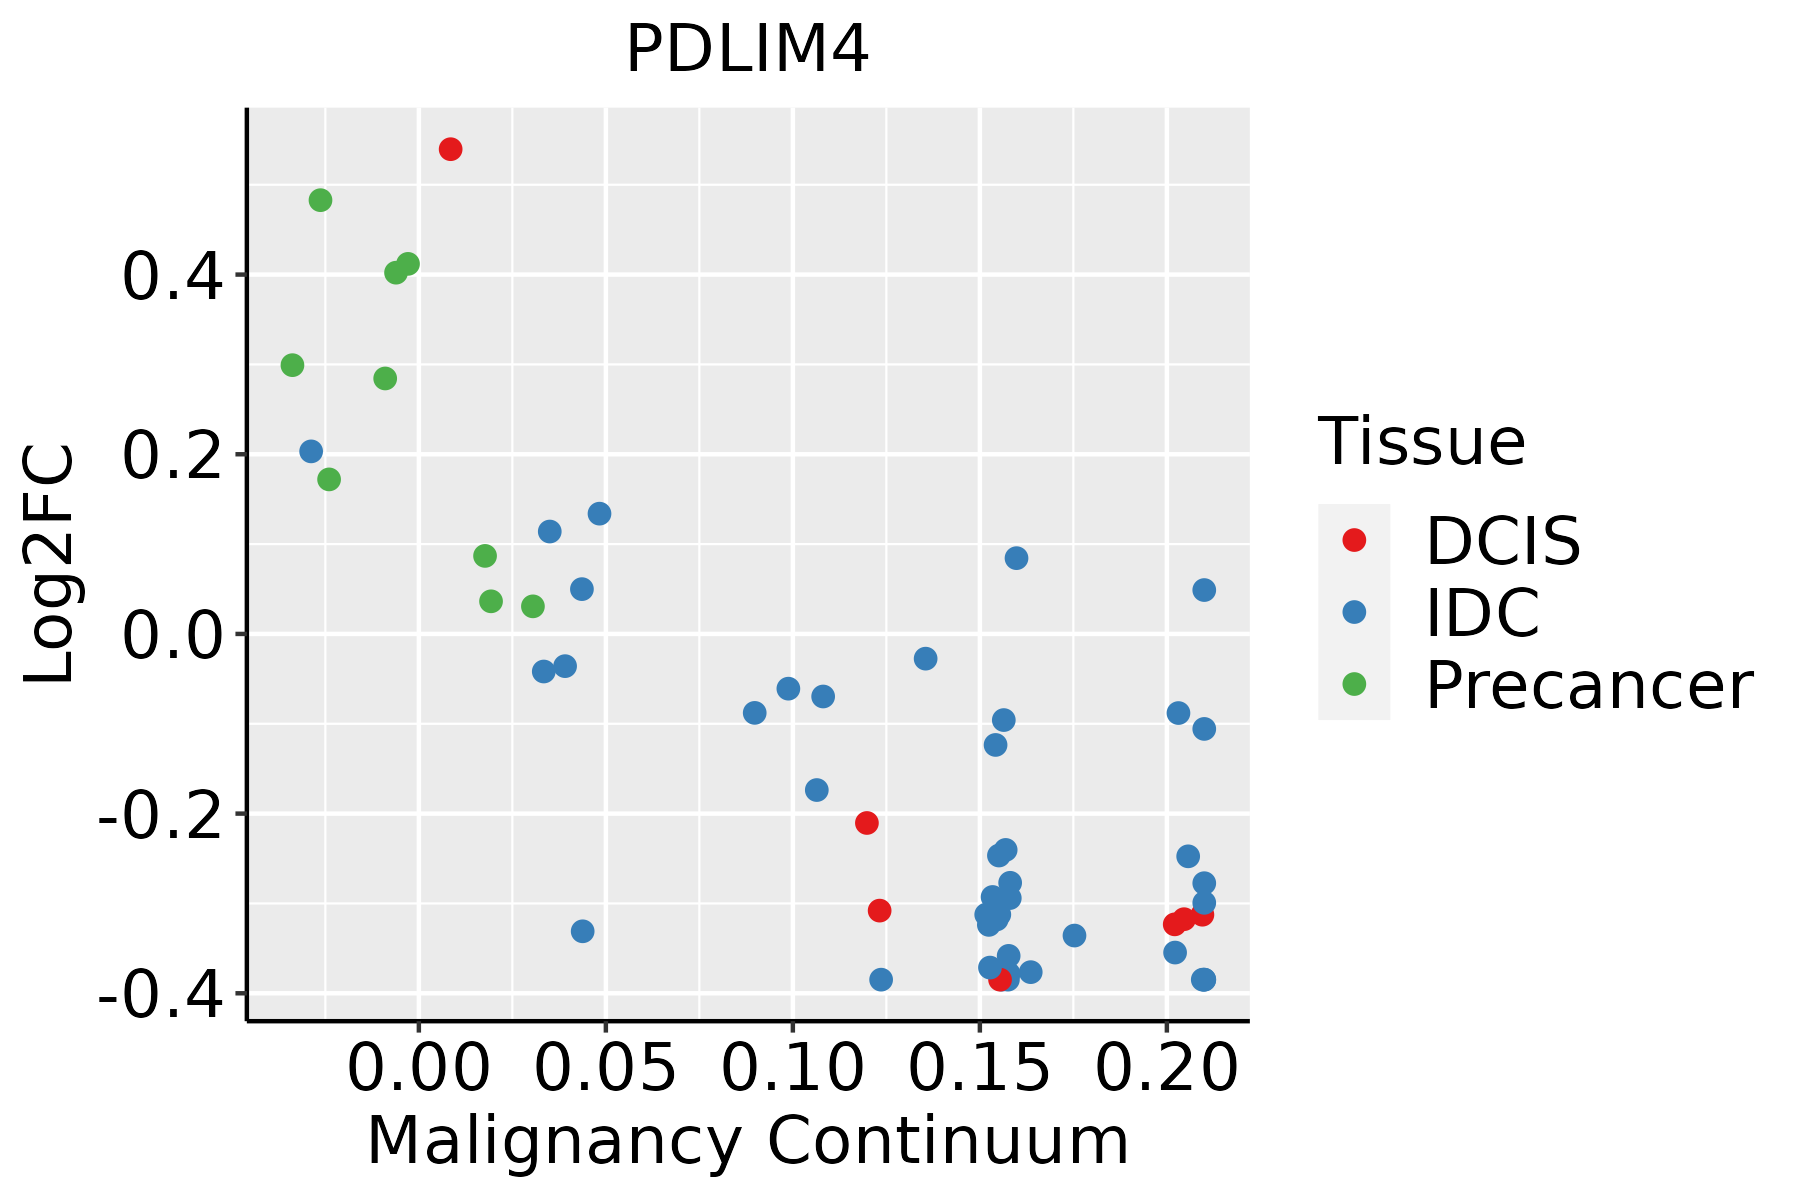 | IDC: Invasive ductal carcinoma |
| DCIS: Ductal carcinoma in situ | ||
| Precancer(BRCA1-mut): Precancerous lesion from BRCA1 mutation carriers | ||
| Endometrium | 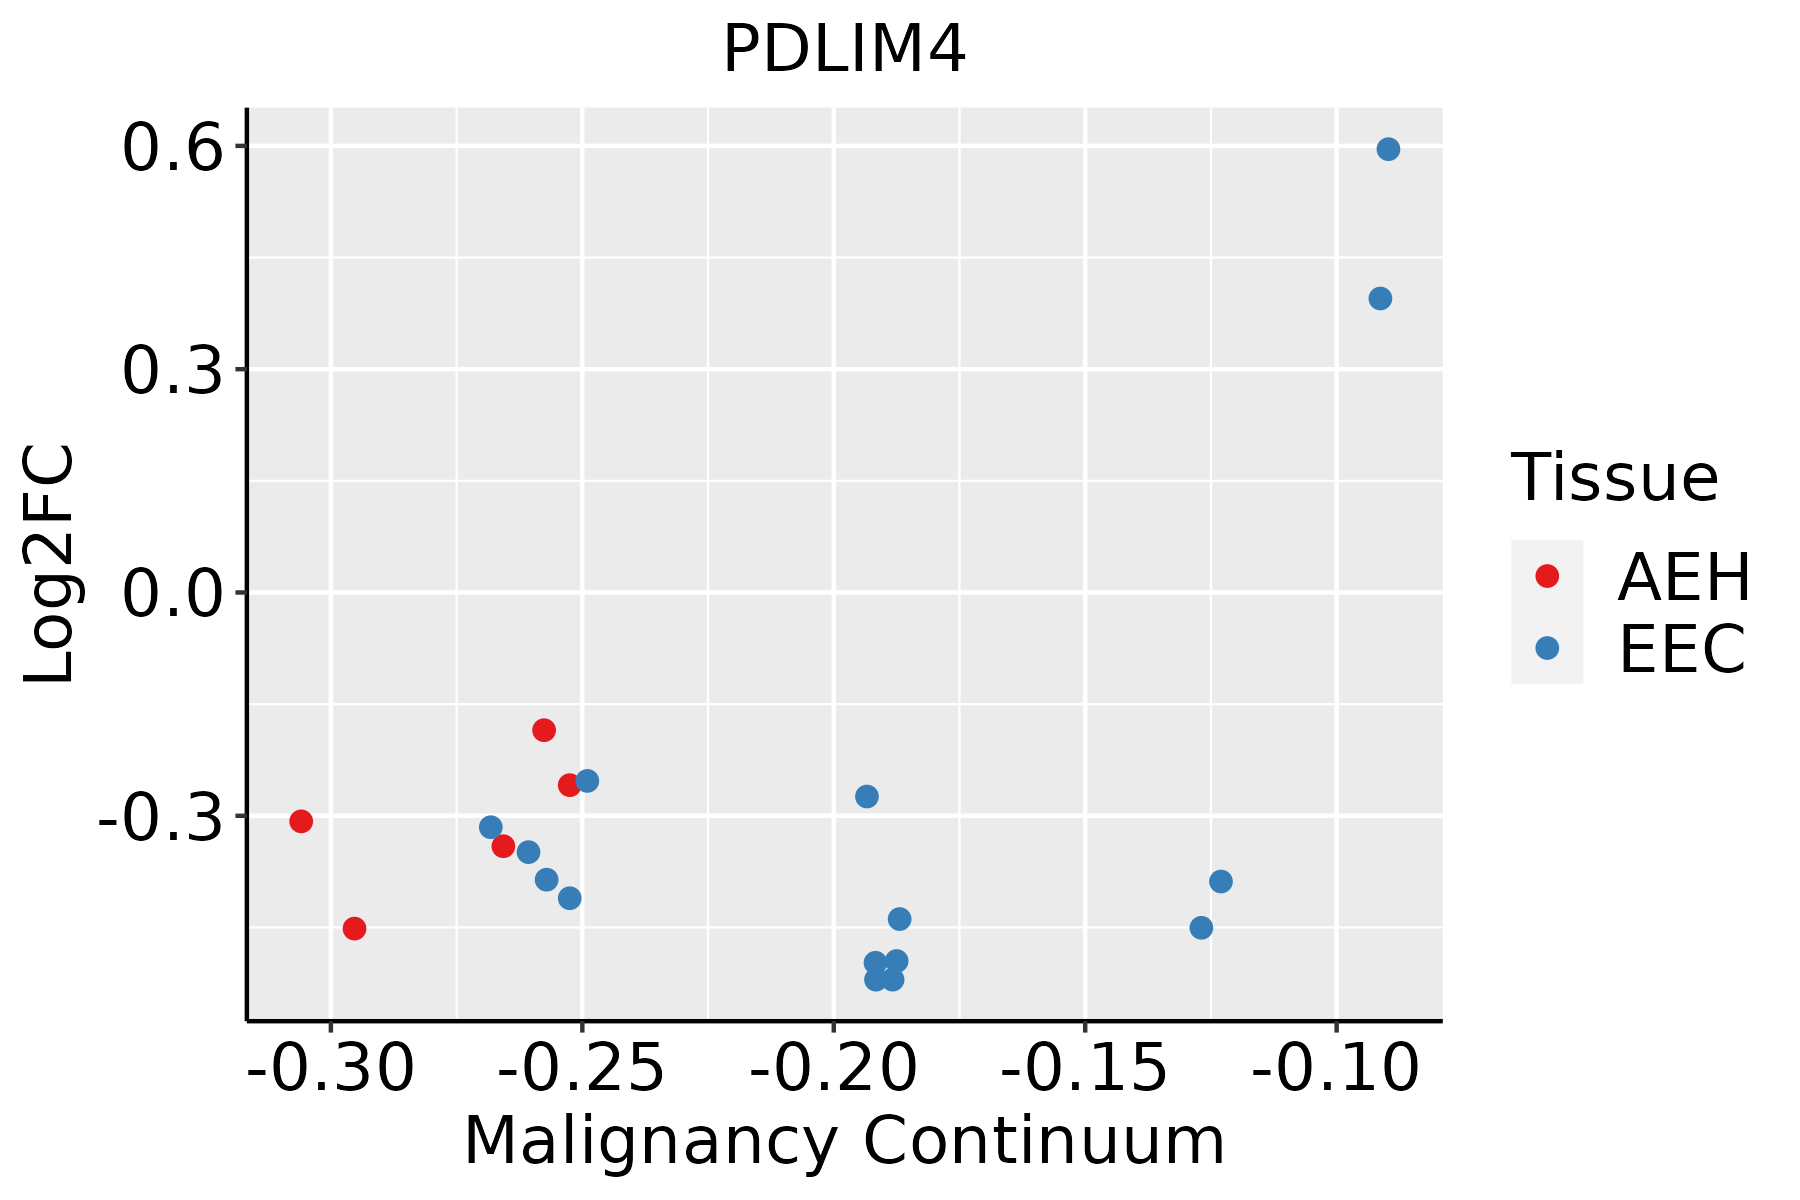 | AEH: Atypical endometrial hyperplasia |
| EEC: Endometrioid Cancer | ||
| Esophagus | 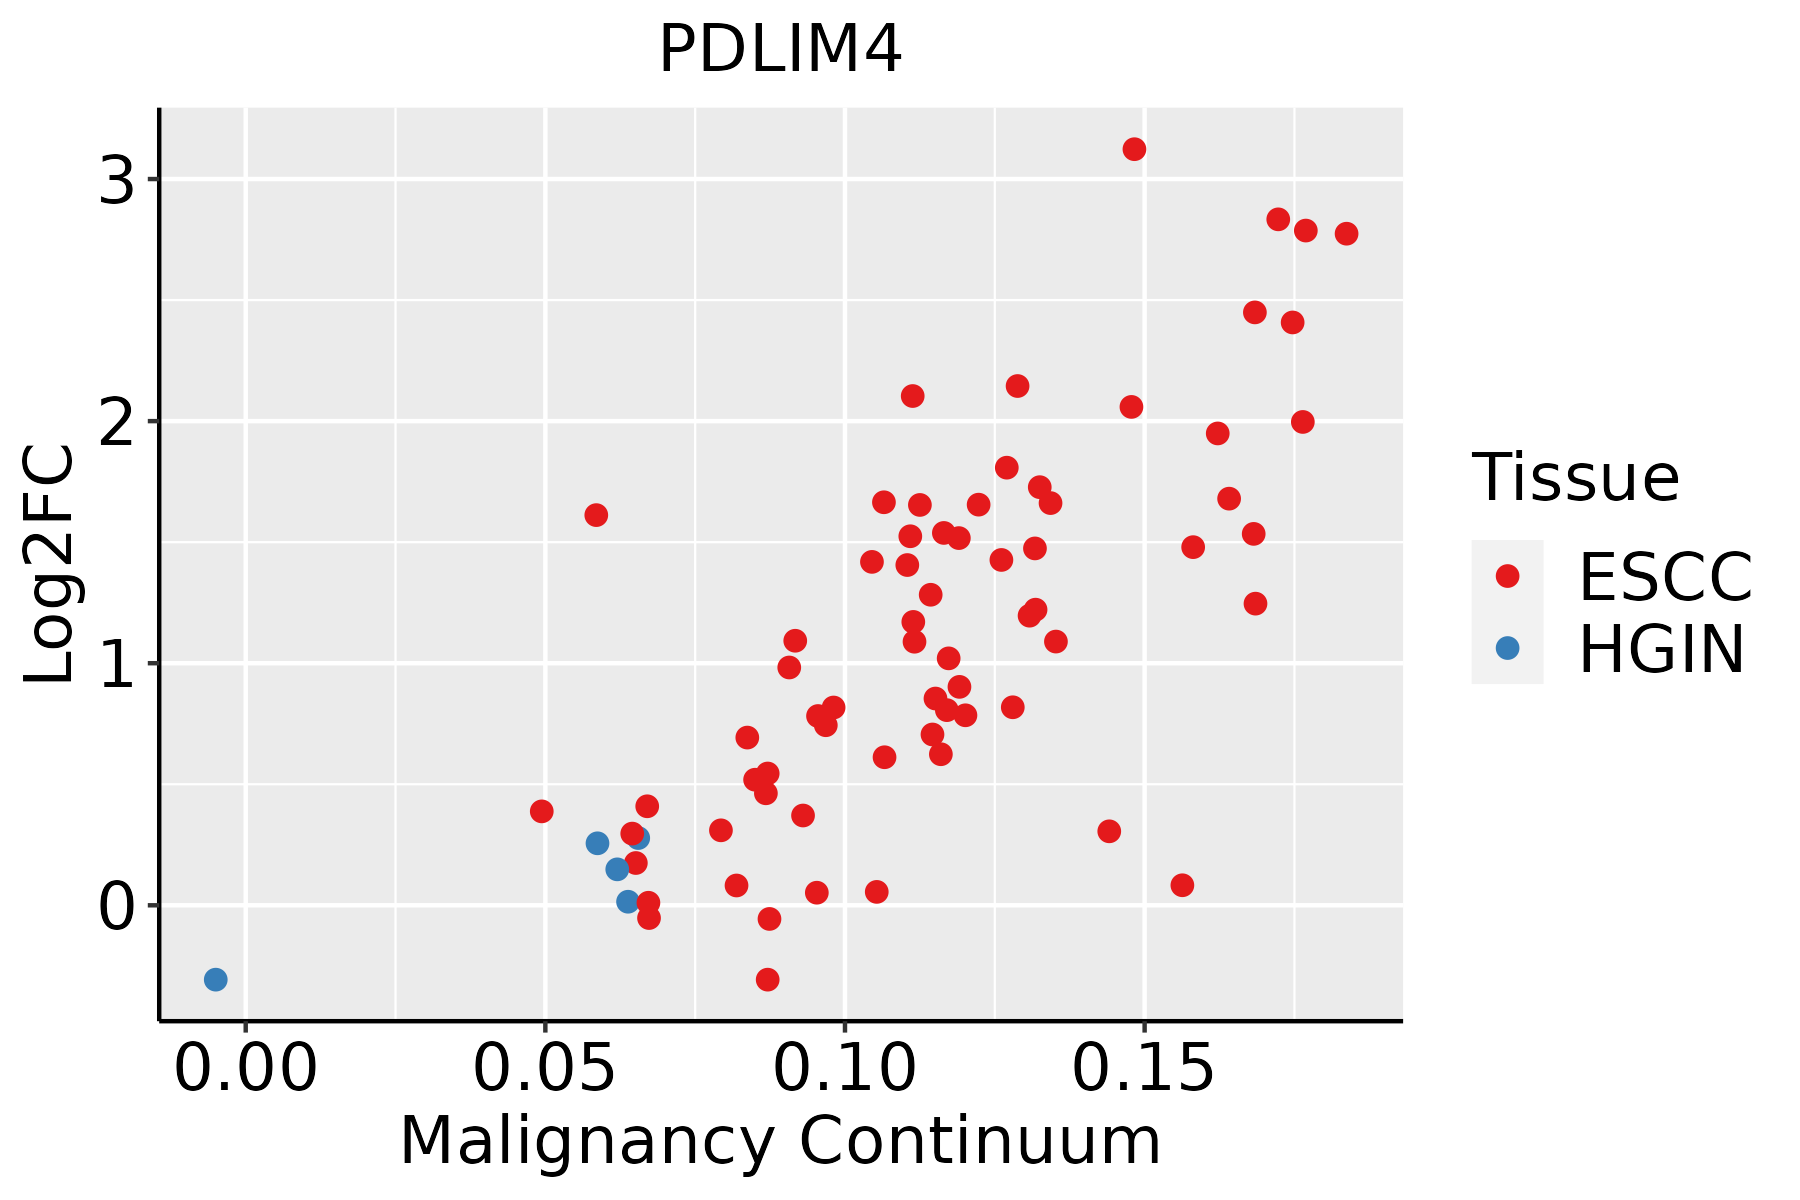 | ESCC: Esophageal squamous cell carcinoma |
| HGIN: High-grade intraepithelial neoplasias | ||
| LGIN: Low-grade intraepithelial neoplasias | ||
| Liver |  | HCC: Hepatocellular carcinoma |
| NAFLD: Non-alcoholic fatty liver disease | ||
| Oral Cavity | 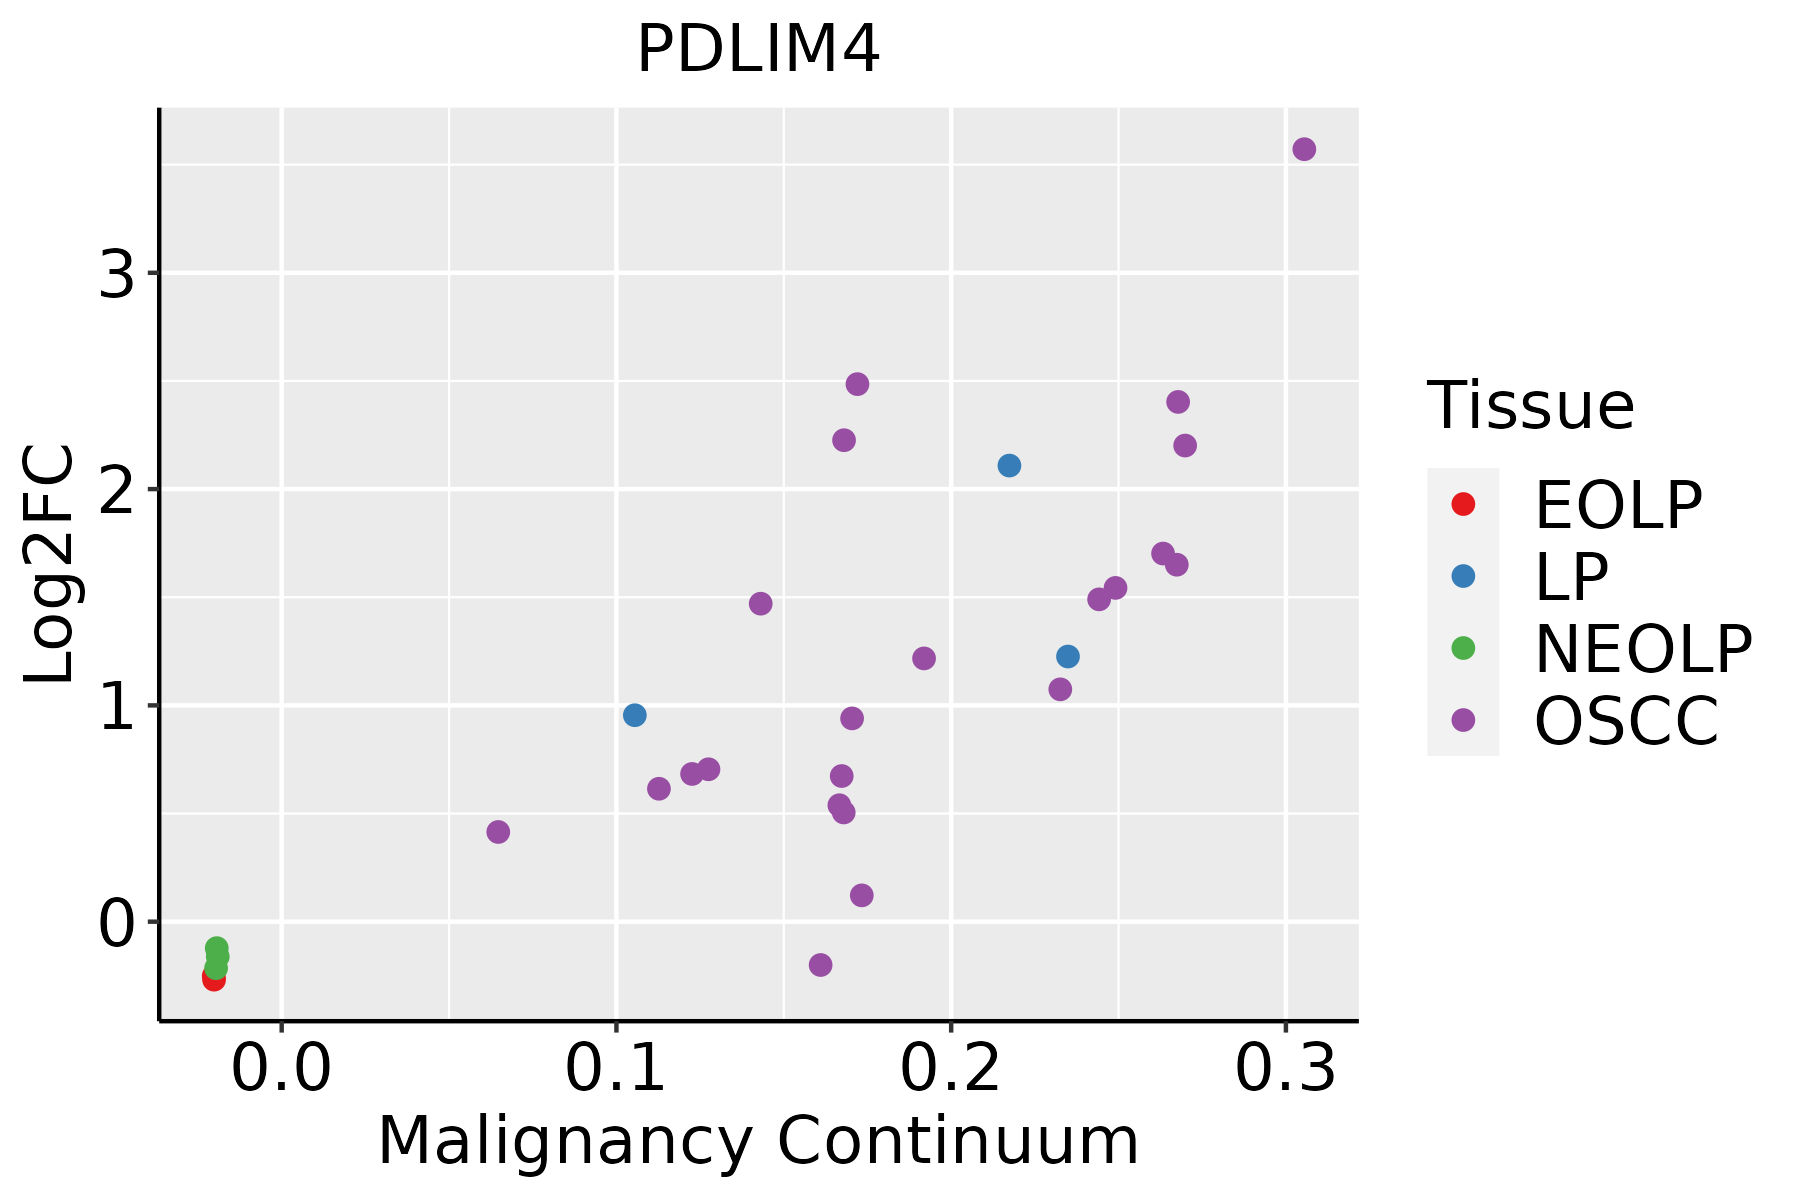 | EOLP: Erosive Oral lichen planus |
| LP: leukoplakia | ||
| NEOLP: Non-erosive oral lichen planus | ||
| OSCC: Oral squamous cell carcinoma | ||
| Prostate | 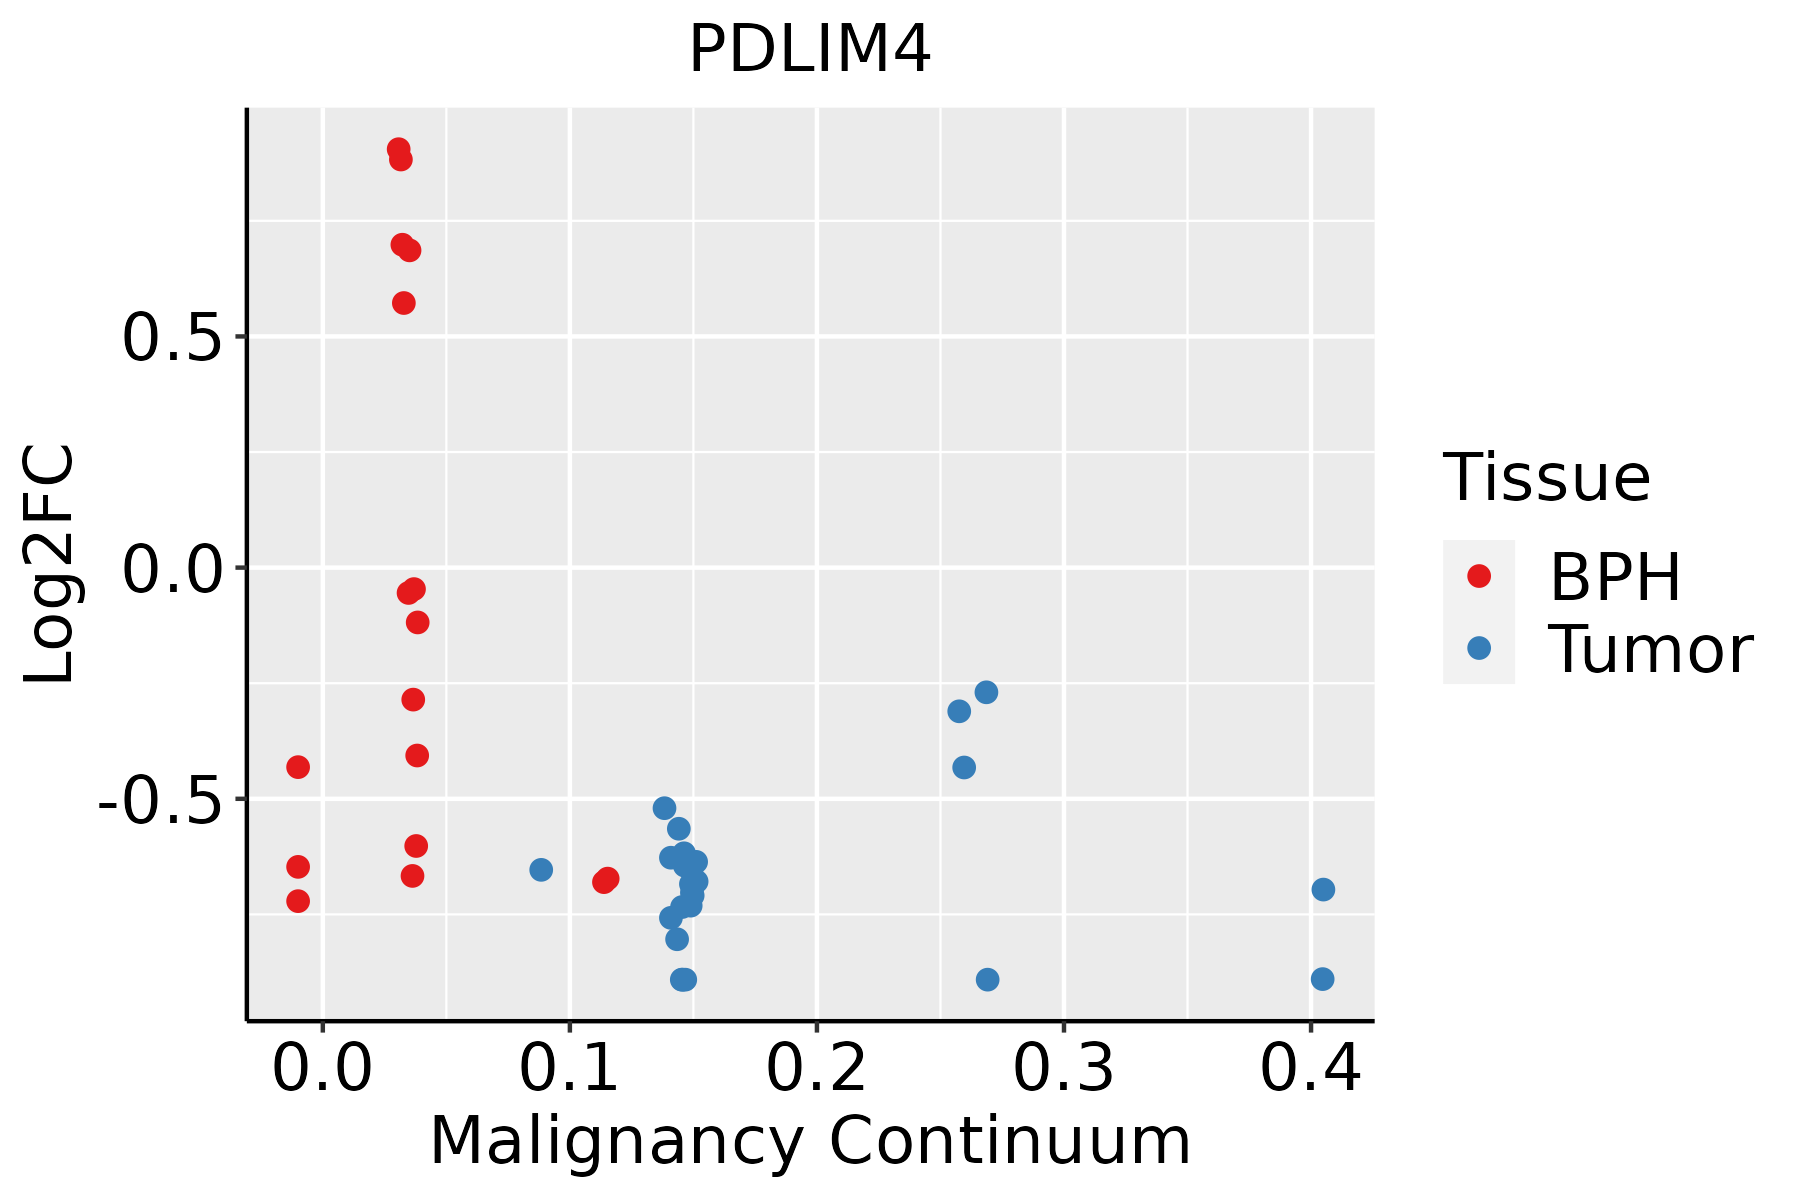 | BPH: Benign Prostatic Hyperplasia |
| Skin | 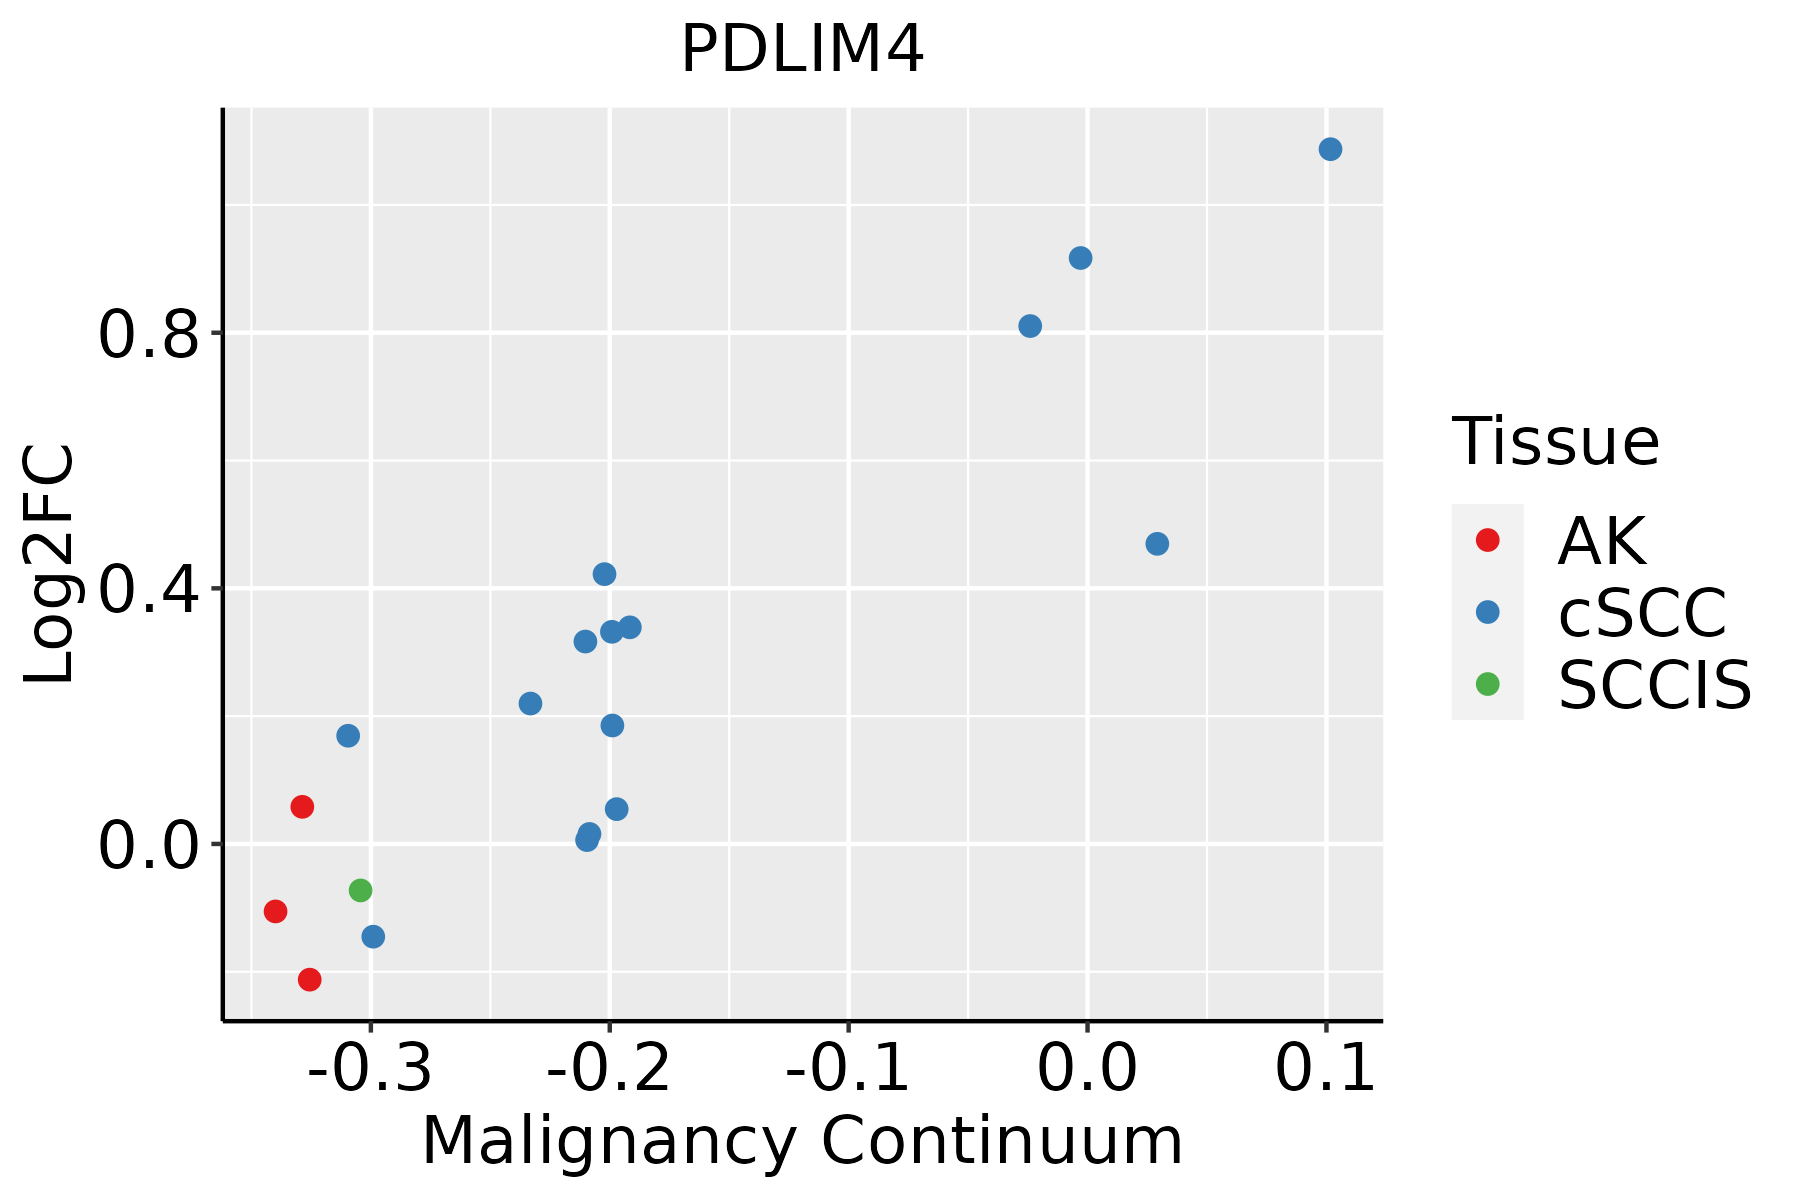 | AK: Actinic keratosis |
| cSCC: Cutaneous squamous cell carcinoma | ||
| SCCIS:squamous cell carcinoma in situ | ||
| Thyroid | 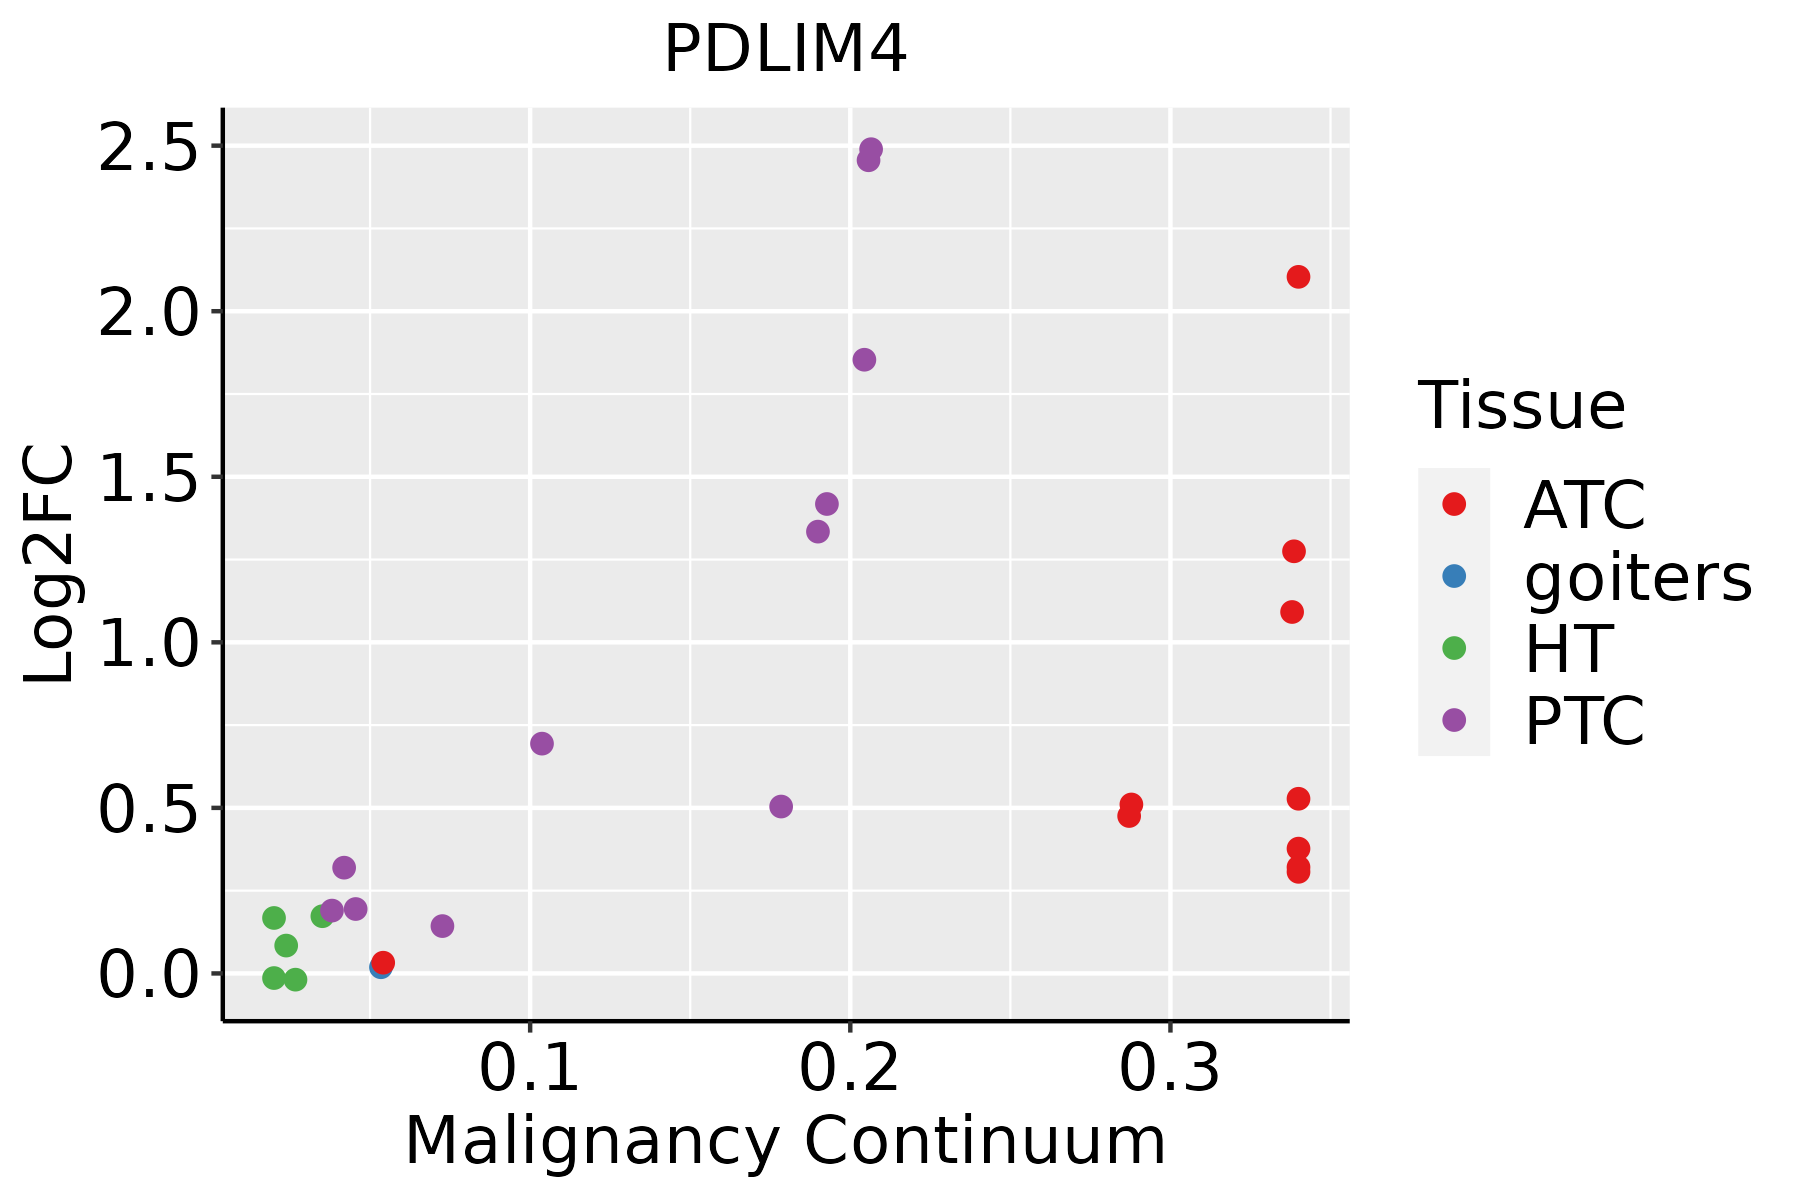 | ATC: Anaplastic thyroid cancer |
| HT: Hashimoto's thyroiditis | ||
| PTC: Papillary thyroid cancer |
| ∗log2FC in expression of this searched gene in stem-like cells from each diseased tissue sample relative to stem-like cells in normal samples in each tissue plotted against the malignancy continuum. Samples are colored based on if they are from different disease stage. |
Top |
Malignant transformation related pathway analysis |
| Find out the enriched GO biological processes and KEGG pathways involved in transition from healthy to precancer to cancer |
| Tissue | Disease Stage | Enriched GO biological Processes |
| Colorectum | AD |  |
| Colorectum | SER |  |
| Colorectum | MSS |  |
| Colorectum | MSI-H |  |
| Colorectum | FAP |  |
| ∗Top 15 enriched GO BP terms are showed in the bar plot of each disease state in each tissue. Each row represents a significant GO biological process which is colored according to the -log10(p.adjust). |
| Page: 1 2 3 4 5 6 7 8 9 |
| GO ID | Tissue | Disease Stage | Description | Gene Ratio | Bg Ratio | pvalue | p.adjust | Count |
| GO:00315329 | Endometrium | AEH | actin cytoskeleton reorganization | 32/2100 | 107/18723 | 1.24e-07 | 5.80e-06 | 32 |
| GO:003153214 | Endometrium | EEC | actin cytoskeleton reorganization | 33/2168 | 107/18723 | 7.46e-08 | 3.89e-06 | 33 |
| GO:003153218 | Esophagus | ESCC | actin cytoskeleton reorganization | 72/8552 | 107/18723 | 5.03e-06 | 5.31e-05 | 72 |
| GO:003153212 | Liver | HCC | actin cytoskeleton reorganization | 59/7958 | 107/18723 | 5.57e-03 | 2.32e-02 | 59 |
| GO:003153216 | Oral cavity | OSCC | actin cytoskeleton reorganization | 65/7305 | 107/18723 | 4.25e-06 | 4.93e-05 | 65 |
| GO:003153217 | Oral cavity | LP | actin cytoskeleton reorganization | 38/4623 | 107/18723 | 7.93e-03 | 4.36e-02 | 38 |
| GO:003153223 | Oral cavity | EOLP | actin cytoskeleton reorganization | 34/2218 | 107/18723 | 3.66e-08 | 1.41e-06 | 34 |
| GO:003153210 | Prostate | BPH | actin cytoskeleton reorganization | 40/3107 | 107/18723 | 1.82e-07 | 4.04e-06 | 40 |
| GO:003153215 | Prostate | Tumor | actin cytoskeleton reorganization | 38/3246 | 107/18723 | 4.76e-06 | 7.44e-05 | 38 |
| GO:003153224 | Skin | cSCC | actin cytoskeleton reorganization | 42/4864 | 107/18723 | 1.76e-03 | 1.07e-02 | 42 |
| GO:003153220 | Thyroid | PTC | actin cytoskeleton reorganization | 60/5968 | 107/18723 | 1.91e-07 | 3.51e-06 | 60 |
| GO:0031532111 | Thyroid | ATC | actin cytoskeleton reorganization | 62/6293 | 107/18723 | 2.01e-07 | 3.17e-06 | 62 |
| Page: 1 |
| Pathway ID | Tissue | Disease Stage | Description | Gene Ratio | Bg Ratio | pvalue | p.adjust | qvalue | Count |
| Page: 1 |
Top |
Cell-cell communication analysis |
| Identification of potential cell-cell interactions between two cell types and their ligand-receptor pairs for different disease states |
| Ligand | Receptor | LRpair | Pathway | Tissue | Disease Stage |
| Page: 1 |
Top |
Single-cell gene regulatory network inference analysis |
| Find out the significant the regulons (TFs) and the target genes of each regulon across cell types for different disease states |
| TF | Cell Type | Tissue | Disease Stage | Target Gene | RSS | Regulon Activity |
| ∗The dot plots of a searched regulon are shown for all cell subpopulations in each disease state of each tissue based on the regulon specific score inferred using pySCENIC and by calculating the average expression. |
| Page: 1 |
Top |
Somatic mutation of malignant transformation related genes |
| Annotation of somatic variants for genes involved in malignant transformation |
| Hugo Symbol | Variant Class | Variant Classification | dbSNP RS | HGVSc | HGVSp | HGVSp Short | SWISSPROT | BIOTYPE | SIFT | PolyPhen | Tumor Sample Barcode | Tissue | Histology | Sex | Age | Stage | Therapy Types | Drugs | Outcome |
| PDLIM4 | SNV | Missense_Mutation | c.932N>T | p.Lys311Met | p.K311M | P50479 | protein_coding | deleterious(0.03) | probably_damaging(0.942) | TCGA-A2-A04P-01 | Breast | breast invasive carcinoma | Female | <65 | III/IV | Chemotherapy | taxol | PD | |
| PDLIM4 | SNV | Missense_Mutation | c.829N>A | p.Glu277Lys | p.E277K | P50479 | protein_coding | deleterious(0.02) | possibly_damaging(0.793) | TCGA-AA-A010-01 | Colorectum | colon adenocarcinoma | Female | <65 | I/II | Chemotherapy | folinic | CR | |
| PDLIM4 | insertion | Frame_Shift_Ins | novel | c.498_499insC | p.Ser169GlnfsTer3 | p.S169Qfs*3 | P50479 | protein_coding | TCGA-AA-A010-01 | Colorectum | colon adenocarcinoma | Female | <65 | I/II | Chemotherapy | folinic | CR | ||
| PDLIM4 | SNV | Missense_Mutation | c.713N>T | p.Thr238Met | p.T238M | P50479 | protein_coding | deleterious(0) | benign(0.174) | TCGA-A5-A2K5-01 | Endometrium | uterine corpus endometrioid carcinoma | Female | >=65 | I/II | Unknown | Unknown | SD | |
| PDLIM4 | SNV | Missense_Mutation | rs202040278 | c.853G>A | p.Gly285Ser | p.G285S | P50479 | protein_coding | tolerated(0.05) | probably_damaging(0.945) | TCGA-AJ-A3EK-01 | Endometrium | uterine corpus endometrioid carcinoma | Female | <65 | I/II | Chemotherapy | carboplatin | CR |
| PDLIM4 | SNV | Missense_Mutation | rs778997358 | c.601G>A | p.Val201Met | p.V201M | P50479 | protein_coding | tolerated(0.09) | benign(0.014) | TCGA-AJ-A3OL-01 | Endometrium | uterine corpus endometrioid carcinoma | Female | <65 | III/IV | Chemotherapy | carboplatin | PD |
| PDLIM4 | SNV | Missense_Mutation | novel | c.626N>A | p.Gly209Asp | p.G209D | P50479 | protein_coding | deleterious(0) | probably_damaging(0.999) | TCGA-AP-A1DK-01 | Endometrium | uterine corpus endometrioid carcinoma | Female | <65 | I/II | Unknown | Unknown | SD |
| PDLIM4 | SNV | Missense_Mutation | novel | c.97N>T | p.His33Tyr | p.H33Y | P50479 | protein_coding | deleterious(0.01) | benign(0.129) | TCGA-DI-A1BU-01 | Endometrium | uterine corpus endometrioid carcinoma | Female | <65 | I/II | Chemotherapy | paclitaxel | SD |
| PDLIM4 | SNV | Missense_Mutation | novel | c.931N>G | p.Lys311Glu | p.K311E | P50479 | protein_coding | deleterious(0.01) | benign(0.366) | TCGA-DI-A1BU-01 | Endometrium | uterine corpus endometrioid carcinoma | Female | <65 | I/II | Chemotherapy | paclitaxel | SD |
| PDLIM4 | SNV | Missense_Mutation | novel | c.381N>C | p.Glu127Asp | p.E127D | P50479 | protein_coding | tolerated(0.77) | benign(0) | TCGA-EY-A3L3-01 | Endometrium | uterine corpus endometrioid carcinoma | Female | >=65 | I/II | Chemotherapy | taxol | CR |
| Page: 1 2 |
Top |
Related drugs of malignant transformation related genes |
| Identification of chemicals and drugs interact with genes involved in malignant transfromation |
| (DGIdb 4.0) |
| Entrez ID | Symbol | Category | Interaction Types | Drug Claim Name | Drug Name | PMIDs |
| Page: 1 |

Copyright 2023-Present -The University of Texas Health Science Center at Houston |