
|
|||||
|
 | |
| |
| |
| |
| |
| |
|
Gene: PDLIM3 |
Gene summary for PDLIM3 |
| Gene information | Species | Human | Gene symbol | PDLIM3 | Gene ID | 27295 |
| Gene name | PDZ and LIM domain 3 | |
| Gene Alias | ALP | |
| Cytomap | 4q35.1 | |
| Gene Type | protein-coding | GO ID | GO:0006996 | UniProtAcc | Q53GG5 |
Top |
Malignant transformation analysis |
| Identification of the aberrant gene expression in precancerous and cancerous lesions by comparing the gene expression of stem-like cells in diseased tissues with normal stem cells |
| Entrez ID | Symbol | Replicates | Species | Organ | Tissue | Adj P-value | Log2FC | Malignancy |
| 27295 | PDLIM3 | GSM4909281 | Human | Breast | IDC | 4.68e-03 | 1.90e-01 | 0.21 |
| 27295 | PDLIM3 | GSM4909286 | Human | Breast | IDC | 1.58e-05 | 1.74e-01 | 0.1081 |
| 27295 | PDLIM3 | GSM4909287 | Human | Breast | IDC | 2.99e-04 | -1.91e-01 | 0.2057 |
| 27295 | PDLIM3 | GSM4909297 | Human | Breast | IDC | 1.33e-08 | -1.94e-01 | 0.1517 |
| 27295 | PDLIM3 | GSM4909298 | Human | Breast | IDC | 3.31e-02 | -1.76e-01 | 0.1551 |
| 27295 | PDLIM3 | GSM4909300 | Human | Breast | IDC | 8.49e-05 | 5.01e-01 | 0.0334 |
| 27295 | PDLIM3 | GSM4909304 | Human | Breast | IDC | 8.23e-09 | -2.10e-01 | 0.1636 |
| 27295 | PDLIM3 | GSM4909311 | Human | Breast | IDC | 1.02e-06 | -1.90e-01 | 0.1534 |
| 27295 | PDLIM3 | GSM4909312 | Human | Breast | IDC | 3.88e-06 | -2.05e-01 | 0.1552 |
| 27295 | PDLIM3 | GSM4909319 | Human | Breast | IDC | 3.80e-09 | -2.05e-01 | 0.1563 |
| 27295 | PDLIM3 | GSM4909321 | Human | Breast | IDC | 8.67e-06 | -1.96e-01 | 0.1559 |
| 27295 | PDLIM3 | brca10 | Human | Breast | Precancer | 4.89e-02 | -1.73e-01 | -0.0029 |
| 27295 | PDLIM3 | NCCBC5 | Human | Breast | DCIS | 3.16e-05 | -1.97e-01 | 0.2046 |
| 27295 | PDLIM3 | P1 | Human | Breast | IDC | 2.92e-04 | -1.88e-01 | 0.1527 |
| 27295 | PDLIM3 | DCIS2 | Human | Breast | DCIS | 5.28e-55 | 6.68e-01 | 0.0085 |
| 27295 | PDLIM3 | LZE7T | Human | Esophagus | ESCC | 1.17e-02 | 1.79e-01 | 0.0667 |
| 27295 | PDLIM3 | P2T-E | Human | Esophagus | ESCC | 3.89e-09 | 2.39e-01 | 0.1177 |
| 27295 | PDLIM3 | P5T-E | Human | Esophagus | ESCC | 1.05e-30 | 1.02e+00 | 0.1327 |
| 27295 | PDLIM3 | P9T-E | Human | Esophagus | ESCC | 2.00e-16 | 1.50e+00 | 0.1131 |
| 27295 | PDLIM3 | P11T-E | Human | Esophagus | ESCC | 1.08e-05 | 7.95e-01 | 0.1426 |
| Page: 1 2 3 4 |
| Tissue | Expression Dynamics | Abbreviation |
| Breast | 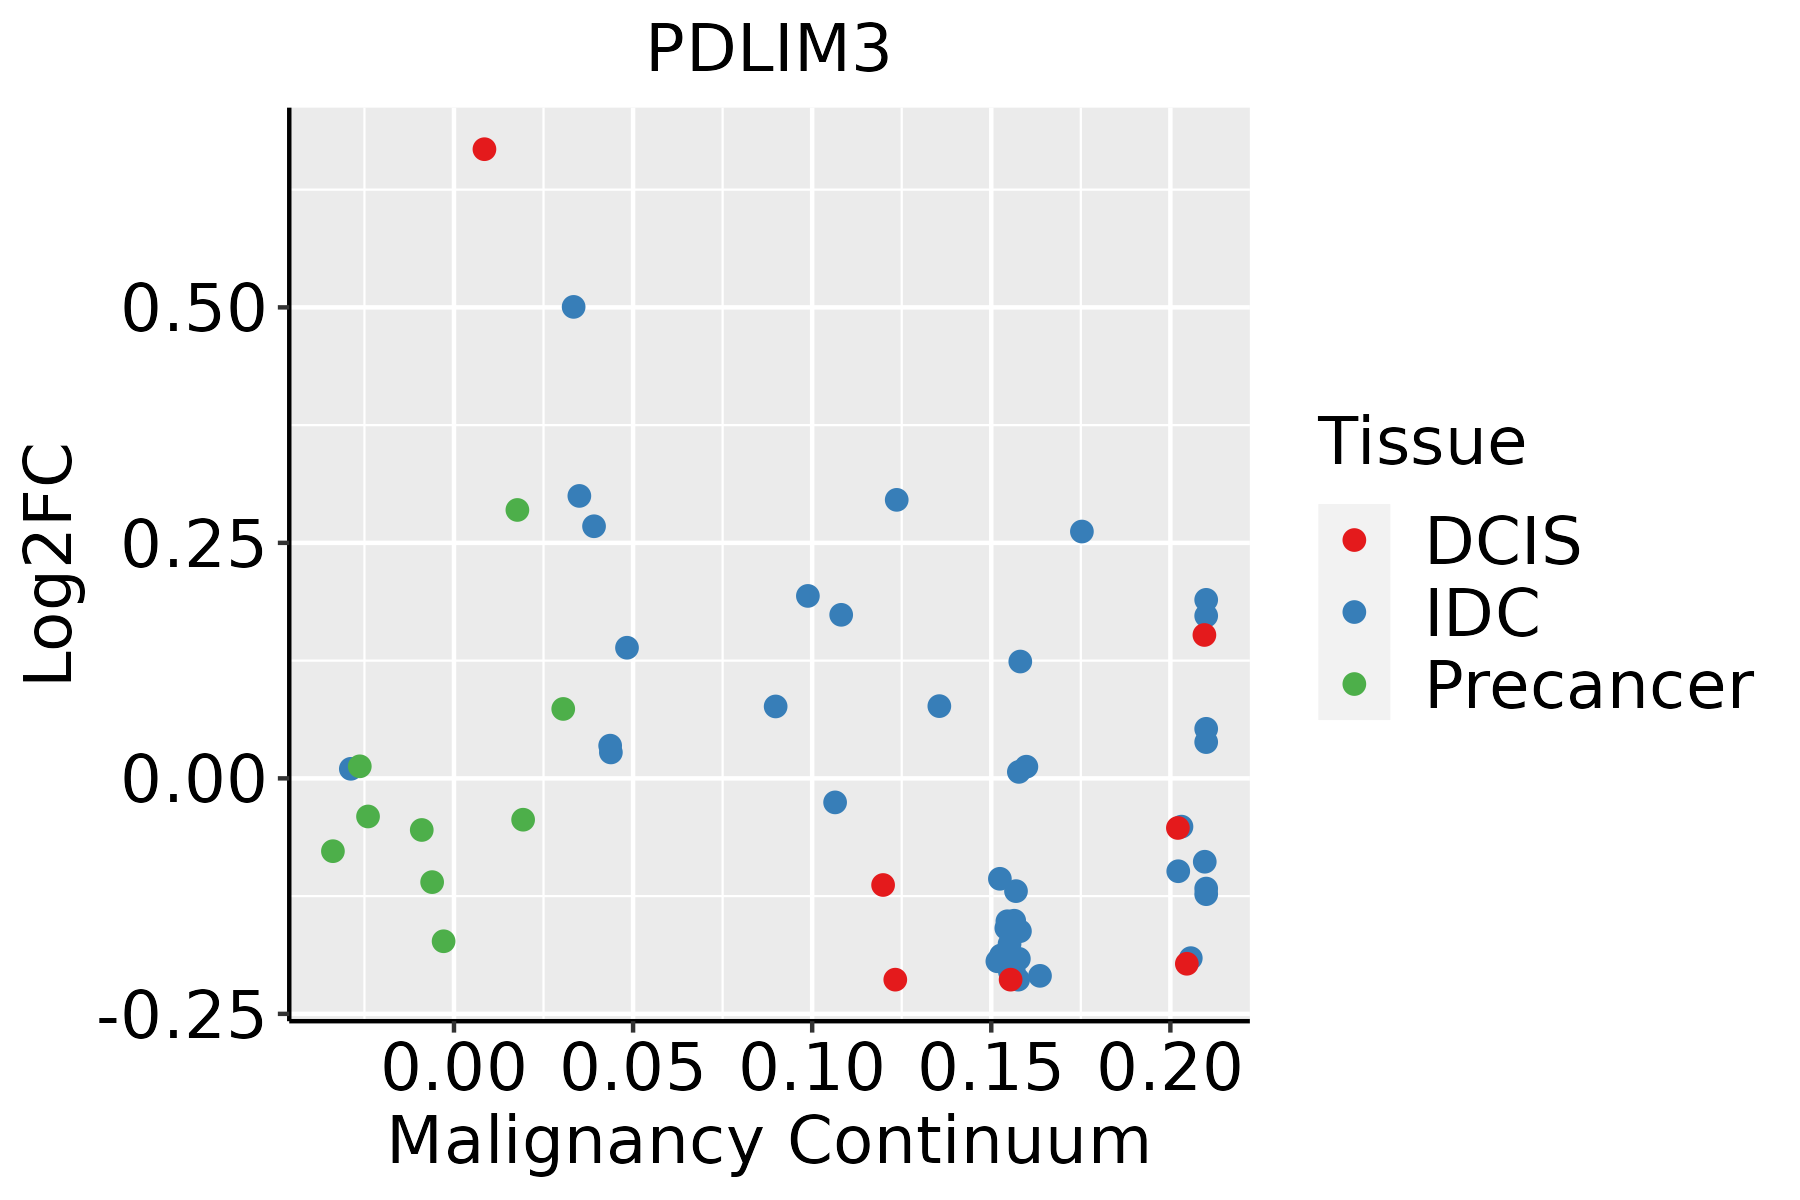 | IDC: Invasive ductal carcinoma |
| DCIS: Ductal carcinoma in situ | ||
| Precancer(BRCA1-mut): Precancerous lesion from BRCA1 mutation carriers | ||
| Esophagus | 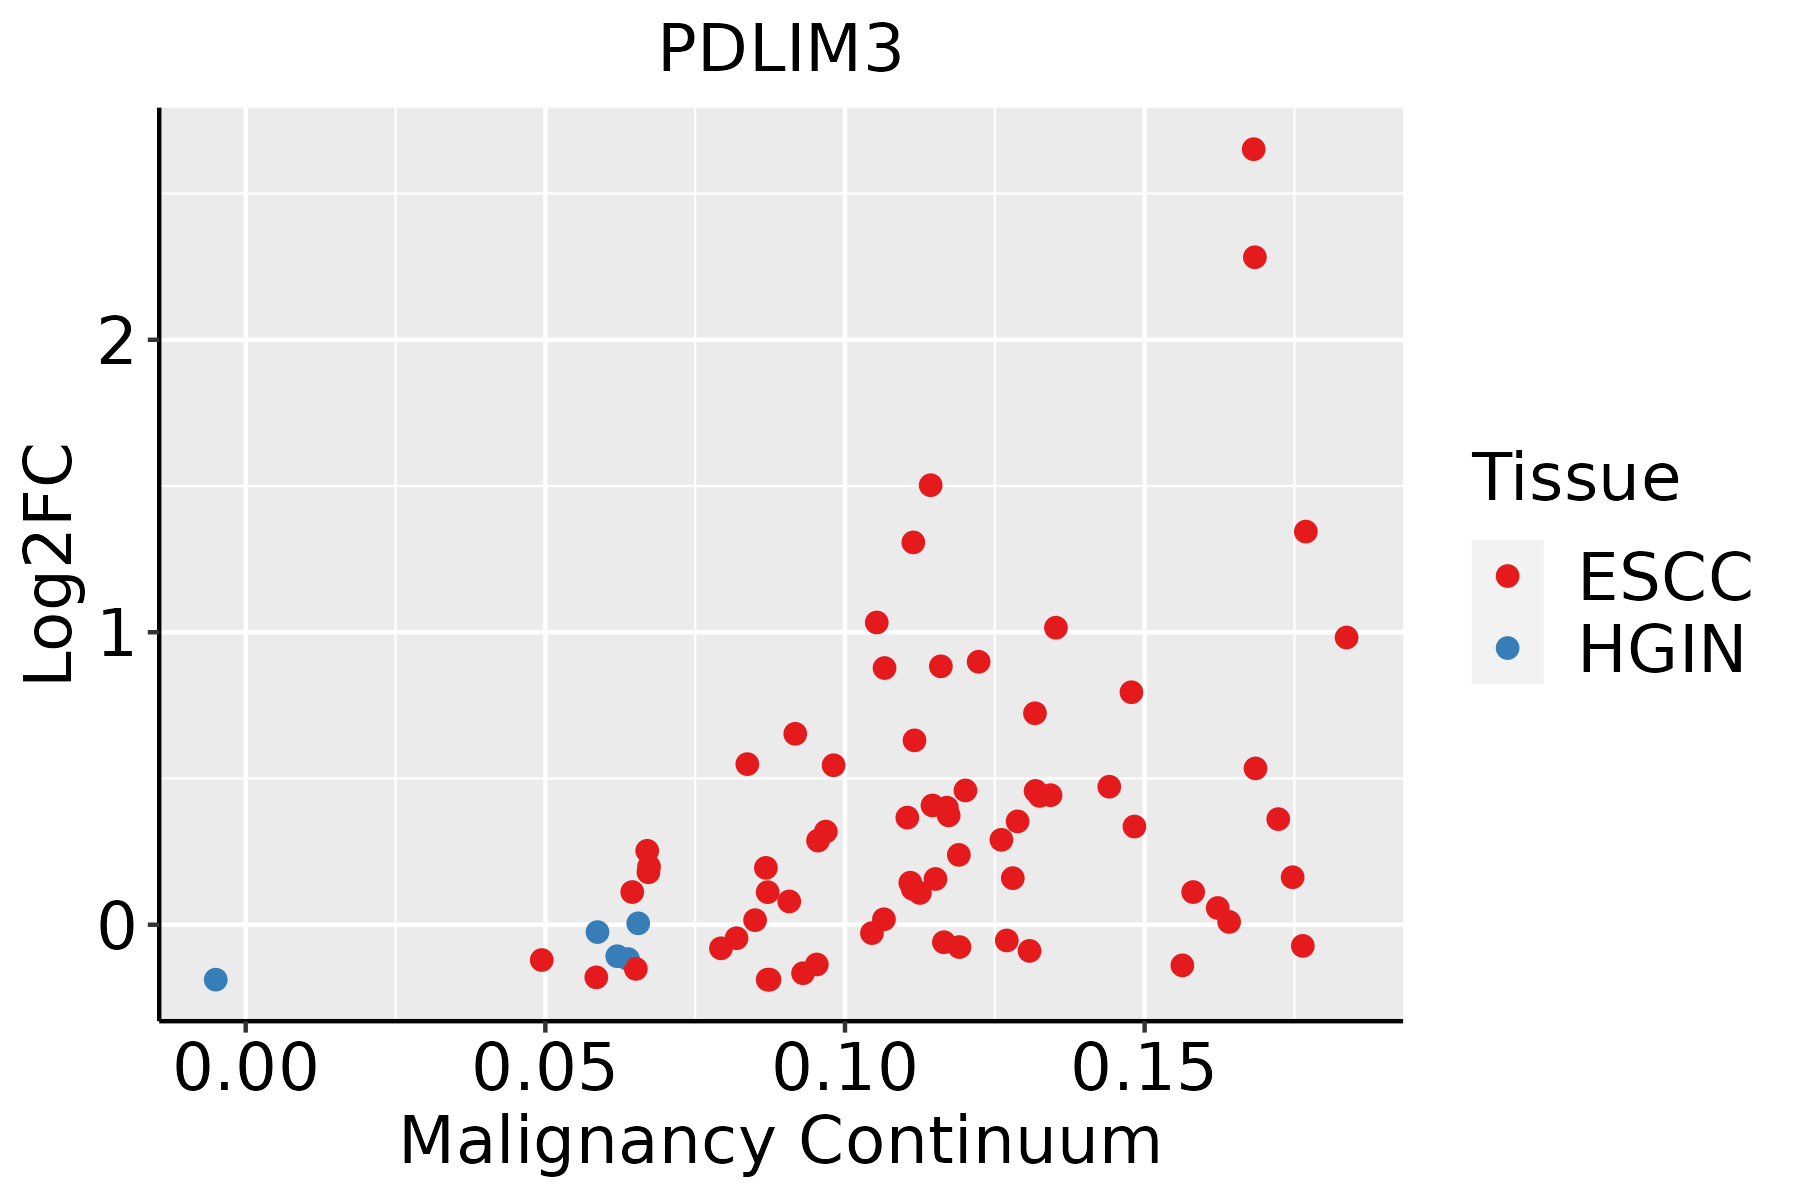 | ESCC: Esophageal squamous cell carcinoma |
| HGIN: High-grade intraepithelial neoplasias | ||
| LGIN: Low-grade intraepithelial neoplasias | ||
| Liver | 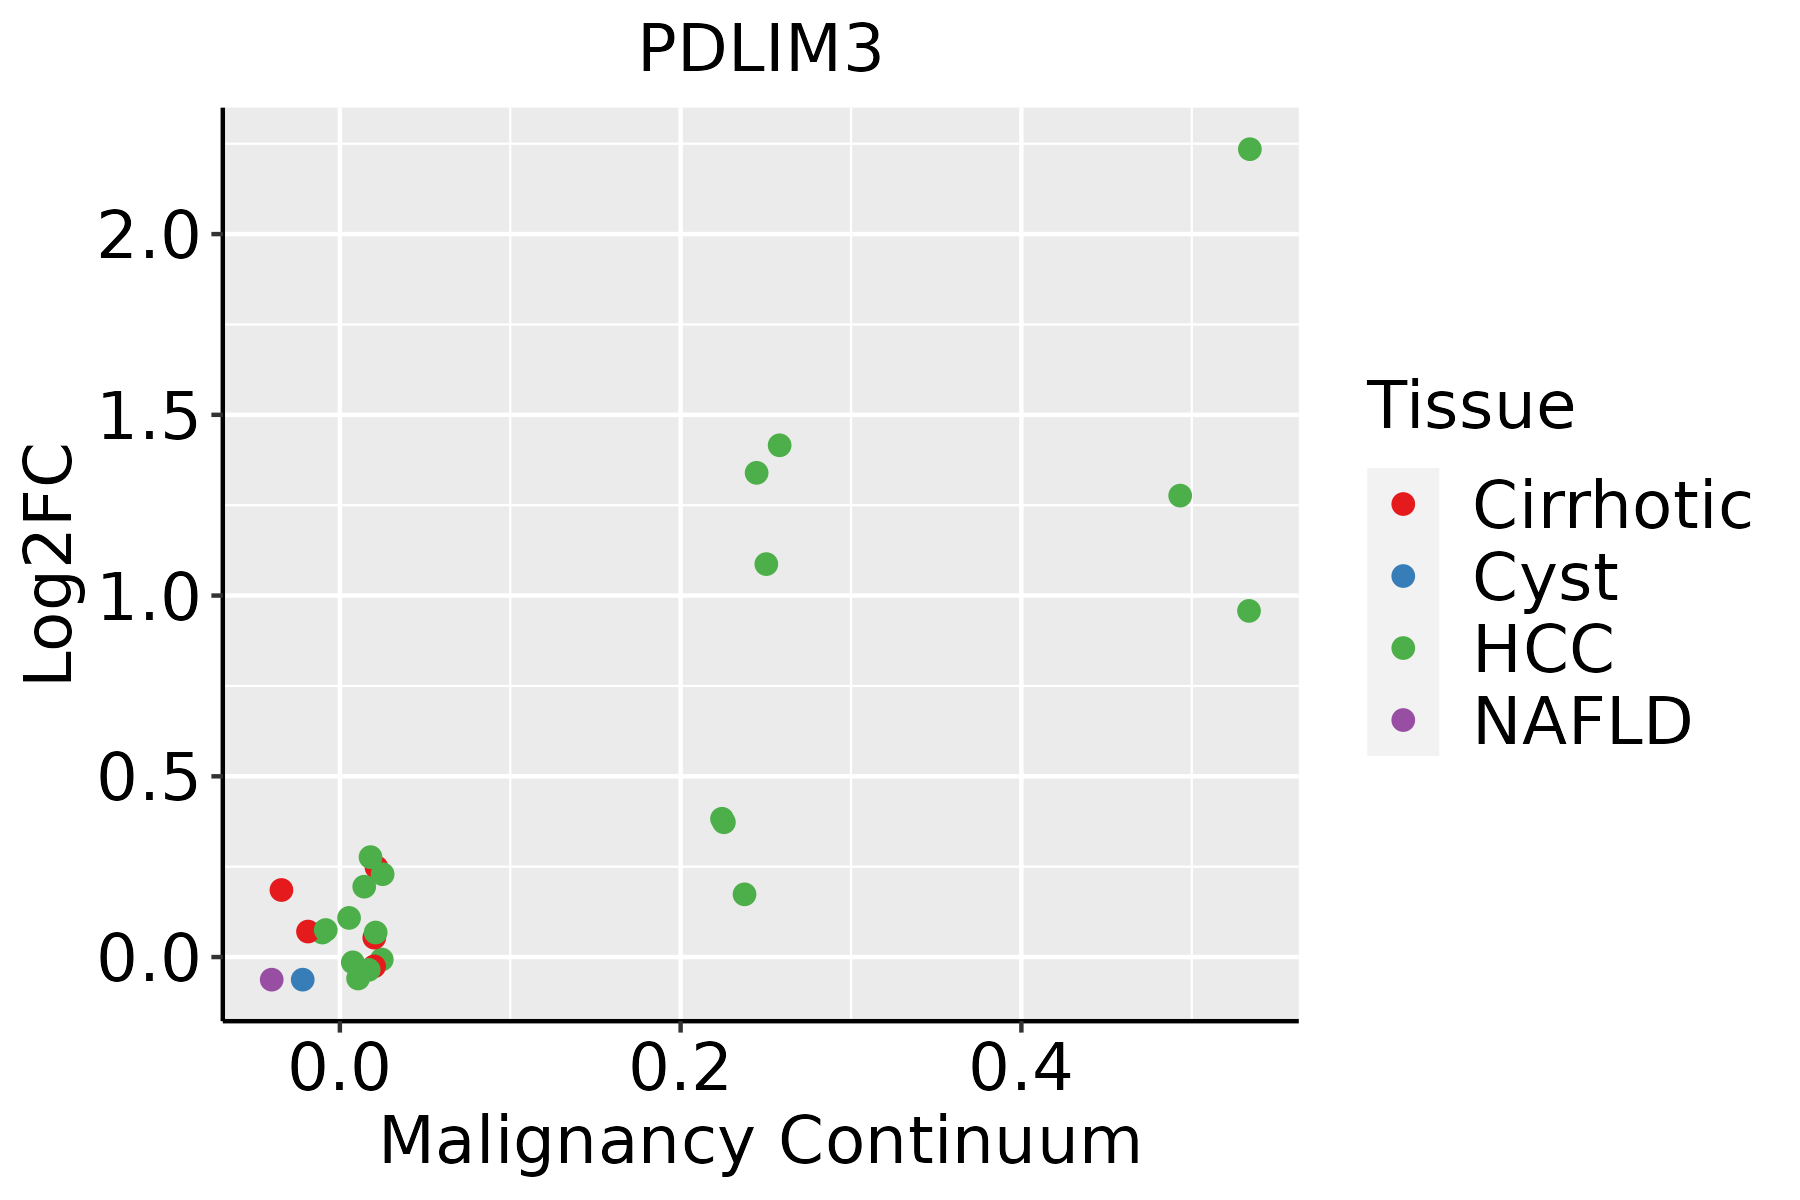 | HCC: Hepatocellular carcinoma |
| NAFLD: Non-alcoholic fatty liver disease | ||
| Lung |  | AAH: Atypical adenomatous hyperplasia |
| AIS: Adenocarcinoma in situ | ||
| IAC: Invasive lung adenocarcinoma | ||
| MIA: Minimally invasive adenocarcinoma | ||
| Oral Cavity |  | EOLP: Erosive Oral lichen planus |
| LP: leukoplakia | ||
| NEOLP: Non-erosive oral lichen planus | ||
| OSCC: Oral squamous cell carcinoma | ||
| Thyroid |  | ATC: Anaplastic thyroid cancer |
| HT: Hashimoto's thyroiditis | ||
| PTC: Papillary thyroid cancer |
| ∗log2FC in expression of this searched gene in stem-like cells from each diseased tissue sample relative to stem-like cells in normal samples in each tissue plotted against the malignancy continuum. Samples are colored based on if they are from different disease stage. |
Top |
Malignant transformation related pathway analysis |
| Find out the enriched GO biological processes and KEGG pathways involved in transition from healthy to precancer to cancer |
| Tissue | Disease Stage | Enriched GO biological Processes |
| Colorectum | AD |  |
| Colorectum | SER |  |
| Colorectum | MSS |  |
| Colorectum | MSI-H |  |
| Colorectum | FAP |  |
| ∗Top 15 enriched GO BP terms are showed in the bar plot of each disease state in each tissue. Each row represents a significant GO biological process which is colored according to the -log10(p.adjust). |
| Page: 1 2 3 4 5 6 7 8 9 |
| GO ID | Tissue | Disease Stage | Description | Gene Ratio | Bg Ratio | pvalue | p.adjust | Count |
| Page: 1 |
| Pathway ID | Tissue | Disease Stage | Description | Gene Ratio | Bg Ratio | pvalue | p.adjust | qvalue | Count |
| Page: 1 |
Top |
Cell-cell communication analysis |
| Identification of potential cell-cell interactions between two cell types and their ligand-receptor pairs for different disease states |
| Ligand | Receptor | LRpair | Pathway | Tissue | Disease Stage |
| Page: 1 |
Top |
Single-cell gene regulatory network inference analysis |
| Find out the significant the regulons (TFs) and the target genes of each regulon across cell types for different disease states |
| TF | Cell Type | Tissue | Disease Stage | Target Gene | RSS | Regulon Activity |
| ∗The dot plots of a searched regulon are shown for all cell subpopulations in each disease state of each tissue based on the regulon specific score inferred using pySCENIC and by calculating the average expression. |
| Page: 1 |
Top |
Somatic mutation of malignant transformation related genes |
| Annotation of somatic variants for genes involved in malignant transformation |
| Hugo Symbol | Variant Class | Variant Classification | dbSNP RS | HGVSc | HGVSp | HGVSp Short | SWISSPROT | BIOTYPE | SIFT | PolyPhen | Tumor Sample Barcode | Tissue | Histology | Sex | Age | Stage | Therapy Types | Drugs | Outcome |
| PDLIM3 | SNV | Missense_Mutation | rs764191858 | c.1030N>T | p.His344Tyr | p.H344Y | Q53GG5 | protein_coding | deleterious(0) | probably_damaging(1) | TCGA-BH-A0HF-01 | Breast | breast invasive carcinoma | Female | >=65 | I/II | Hormone Therapy | arimidex | SD |
| PDLIM3 | SNV | Missense_Mutation | rs539118406 | c.800N>A | p.Arg267His | p.R267H | Q53GG5 | protein_coding | deleterious(0) | probably_damaging(0.985) | TCGA-D8-A73X-01 | Breast | breast invasive carcinoma | Female | <65 | I/II | Hormone Therapy | tamoxiphen | SD |
| PDLIM3 | SNV | Missense_Mutation | novel | c.812N>A | p.Thr271Lys | p.T271K | Q53GG5 | protein_coding | deleterious(0.04) | benign(0.393) | TCGA-AA-A00N-01 | Colorectum | colon adenocarcinoma | Male | >=65 | I/II | Unknown | Unknown | PD |
| PDLIM3 | SNV | Missense_Mutation | rs747243505 | c.677N>T | p.Ser226Leu | p.S226L | Q53GG5 | protein_coding | tolerated(0.25) | benign(0.015) | TCGA-AZ-4315-01 | Colorectum | colon adenocarcinoma | Male | <65 | I/II | Unknown | Unknown | SD |
| PDLIM3 | SNV | Missense_Mutation | c.378N>A | p.Phe126Leu | p.F126L | Q53GG5 | protein_coding | tolerated(0.05) | benign(0.442) | TCGA-D5-6928-01 | Colorectum | colon adenocarcinoma | Male | >=65 | I/II | Unknown | Unknown | SD | |
| PDLIM3 | SNV | Missense_Mutation | c.460A>G | p.Ser154Gly | p.S154G | Q53GG5 | protein_coding | tolerated(0.12) | probably_damaging(0.952) | TCGA-DM-A1HB-01 | Colorectum | colon adenocarcinoma | Male | >=65 | III/IV | Unknown | Unknown | SD | |
| PDLIM3 | SNV | Missense_Mutation | rs866105307 | c.392G>A | p.Arg131Gln | p.R131Q | Q53GG5 | protein_coding | tolerated(0.6) | benign(0.007) | TCGA-A5-A0G1-01 | Endometrium | uterine corpus endometrioid carcinoma | Female | >=65 | I/II | Unknown | Unknown | SD |
| PDLIM3 | SNV | Missense_Mutation | novel | c.283G>A | p.Asp95Asn | p.D95N | Q53GG5 | protein_coding | deleterious(0.01) | benign(0.119) | TCGA-A5-A0G1-01 | Endometrium | uterine corpus endometrioid carcinoma | Female | >=65 | I/II | Unknown | Unknown | SD |
| PDLIM3 | SNV | Missense_Mutation | rs775988516 | c.722N>A | p.Arg241Gln | p.R241Q | Q53GG5 | protein_coding | tolerated(1) | benign(0) | TCGA-A5-A1OF-01 | Endometrium | uterine corpus endometrioid carcinoma | Female | <65 | I/II | Unknown | Unknown | SD |
| PDLIM3 | SNV | Missense_Mutation | rs751951109 | c.365N>A | p.Arg122Gln | p.R122Q | Q53GG5 | protein_coding | tolerated(0.11) | possibly_damaging(0.666) | TCGA-AP-A0LM-01 | Endometrium | uterine corpus endometrioid carcinoma | Female | <65 | III/IV | Chemotherapy | cisplatin | SD |
| Page: 1 2 3 4 |
Top |
Related drugs of malignant transformation related genes |
| Identification of chemicals and drugs interact with genes involved in malignant transfromation |
| (DGIdb 4.0) |
| Entrez ID | Symbol | Category | Interaction Types | Drug Claim Name | Drug Name | PMIDs |
| Page: 1 |

Copyright 2023-Present -The University of Texas Health Science Center at Houston |