
|
|||||
|
 | |
| |
| |
| |
| |
| |
|
Gene: PDLIM1 |
Gene summary for PDLIM1 |
| Gene information | Species | Human | Gene symbol | PDLIM1 | Gene ID | 9124 |
| Gene name | PDZ and LIM domain 1 | |
| Gene Alias | CLIM1 | |
| Cytomap | 10q23.33 | |
| Gene Type | protein-coding | GO ID | GO:0001666 | UniProtAcc | O00151 |
Top |
Malignant transformation analysis |
| Identification of the aberrant gene expression in precancerous and cancerous lesions by comparing the gene expression of stem-like cells in diseased tissues with normal stem cells |
| Entrez ID | Symbol | Replicates | Species | Organ | Tissue | Adj P-value | Log2FC | Malignancy |
| 9124 | PDLIM1 | GSM4909285 | Human | Breast | IDC | 8.34e-03 | 1.88e-01 | 0.21 |
| 9124 | PDLIM1 | GSM4909296 | Human | Breast | IDC | 6.60e-05 | 2.36e-01 | 0.1524 |
| 9124 | PDLIM1 | GSM4909297 | Human | Breast | IDC | 2.35e-08 | -2.64e-01 | 0.1517 |
| 9124 | PDLIM1 | GSM4909306 | Human | Breast | IDC | 1.91e-03 | -2.34e-01 | 0.1564 |
| 9124 | PDLIM1 | GSM4909311 | Human | Breast | IDC | 2.91e-18 | -1.21e-01 | 0.1534 |
| 9124 | PDLIM1 | GSM4909312 | Human | Breast | IDC | 6.83e-17 | 4.54e-01 | 0.1552 |
| 9124 | PDLIM1 | GSM4909313 | Human | Breast | IDC | 1.07e-05 | 3.80e-01 | 0.0391 |
| 9124 | PDLIM1 | GSM4909318 | Human | Breast | IDC | 2.08e-02 | -3.81e-01 | 0.2031 |
| 9124 | PDLIM1 | GSM4909319 | Human | Breast | IDC | 1.77e-24 | -2.82e-01 | 0.1563 |
| 9124 | PDLIM1 | GSM4909320 | Human | Breast | IDC | 7.03e-07 | -3.81e-01 | 0.1575 |
| 9124 | PDLIM1 | GSM4909321 | Human | Breast | IDC | 1.04e-07 | -2.32e-01 | 0.1559 |
| 9124 | PDLIM1 | brca2 | Human | Breast | Precancer | 1.06e-08 | 3.70e-01 | -0.024 |
| 9124 | PDLIM1 | brca3 | Human | Breast | Precancer | 2.78e-20 | 5.42e-01 | -0.0263 |
| 9124 | PDLIM1 | brca10 | Human | Breast | Precancer | 1.52e-03 | 3.66e-01 | -0.0029 |
| 9124 | PDLIM1 | M1 | Human | Breast | IDC | 9.87e-04 | -3.08e-01 | 0.1577 |
| 9124 | PDLIM1 | M2 | Human | Breast | IDC | 2.26e-04 | 4.67e-01 | 0.21 |
| 9124 | PDLIM1 | NCCBC11 | Human | Breast | DCIS | 3.20e-05 | 4.33e-01 | 0.1232 |
| 9124 | PDLIM1 | NCCBC14 | Human | Breast | DCIS | 9.46e-07 | 2.62e-01 | 0.2021 |
| 9124 | PDLIM1 | NCCBC2 | Human | Breast | DCIS | 4.45e-02 | -3.81e-01 | 0.1554 |
| 9124 | PDLIM1 | NCCBC5 | Human | Breast | DCIS | 7.76e-08 | -1.93e-01 | 0.2046 |
| Page: 1 2 3 4 5 6 7 8 9 10 11 12 13 14 15 |
| Tissue | Expression Dynamics | Abbreviation |
| Breast | 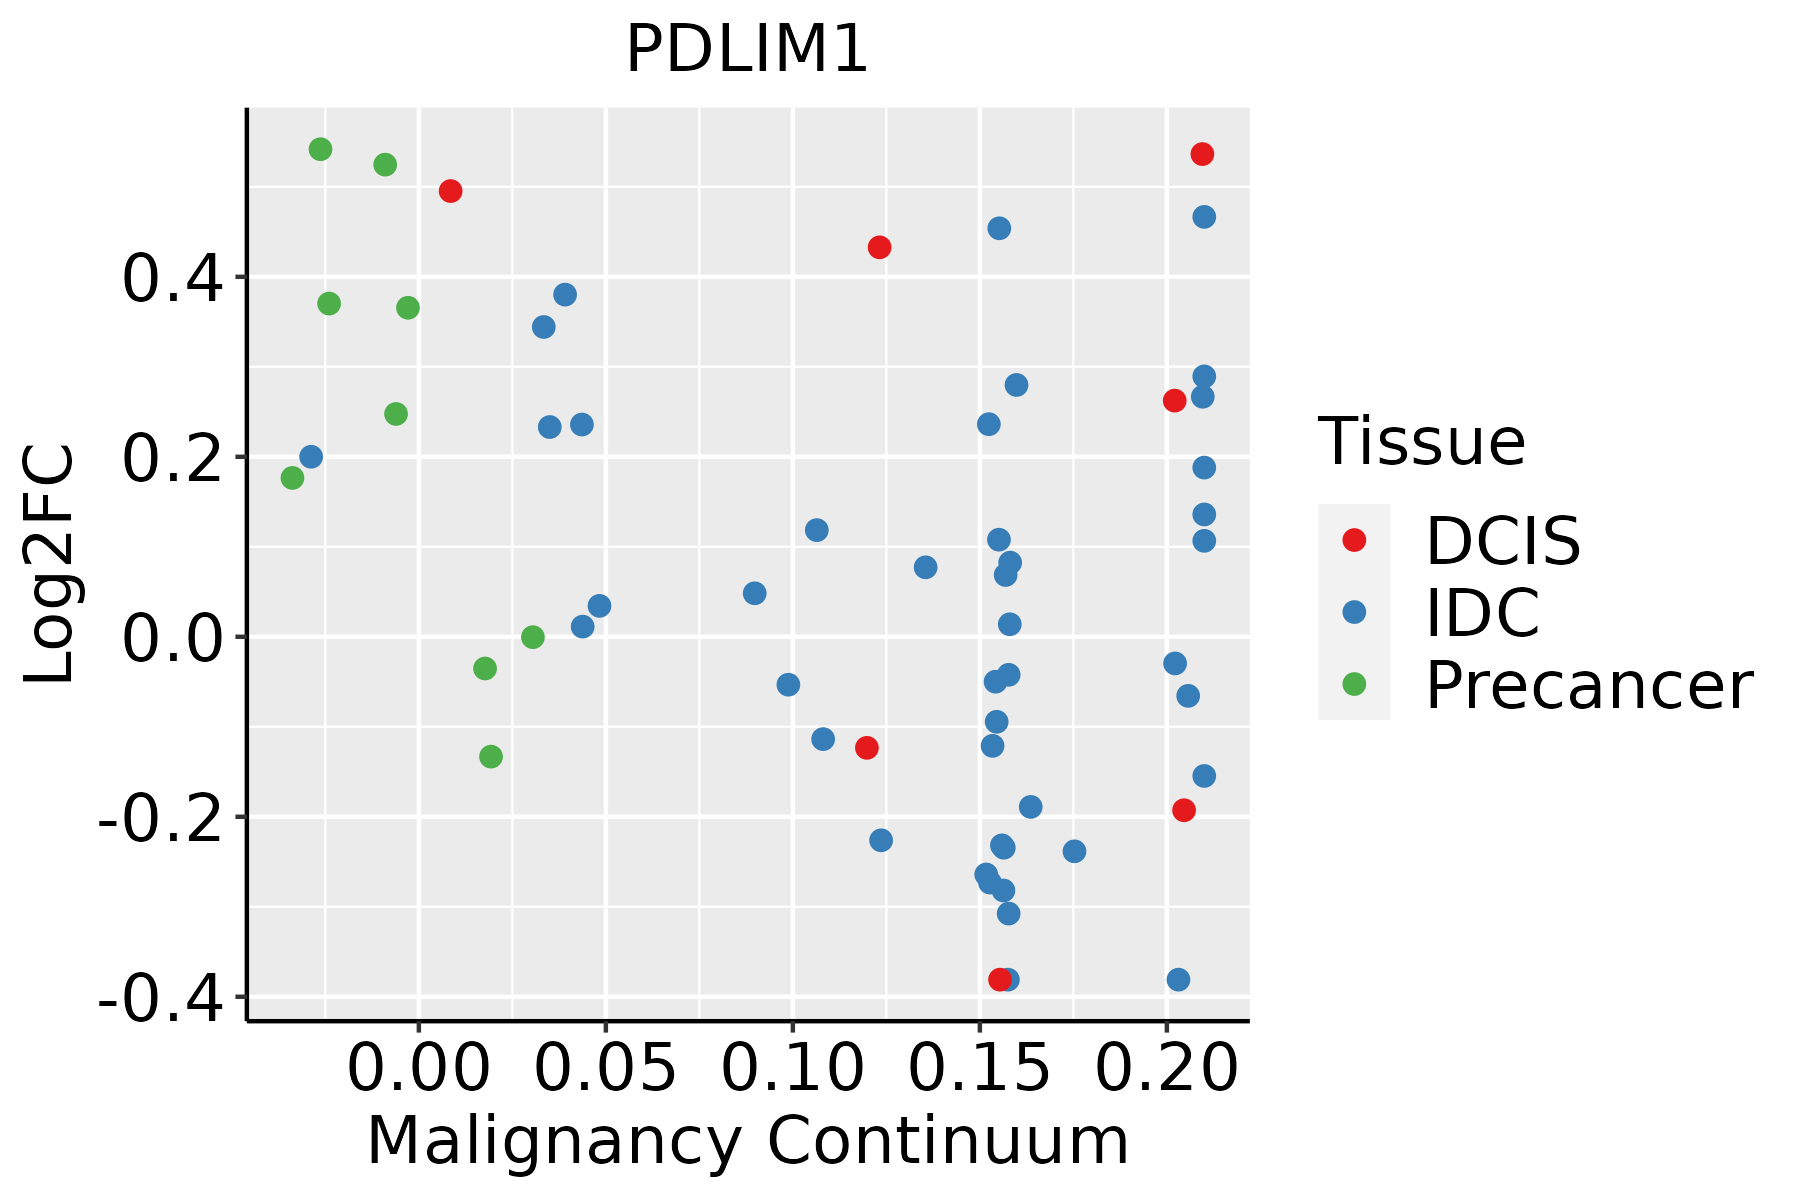 | IDC: Invasive ductal carcinoma |
| DCIS: Ductal carcinoma in situ | ||
| Precancer(BRCA1-mut): Precancerous lesion from BRCA1 mutation carriers | ||
| Cervix | 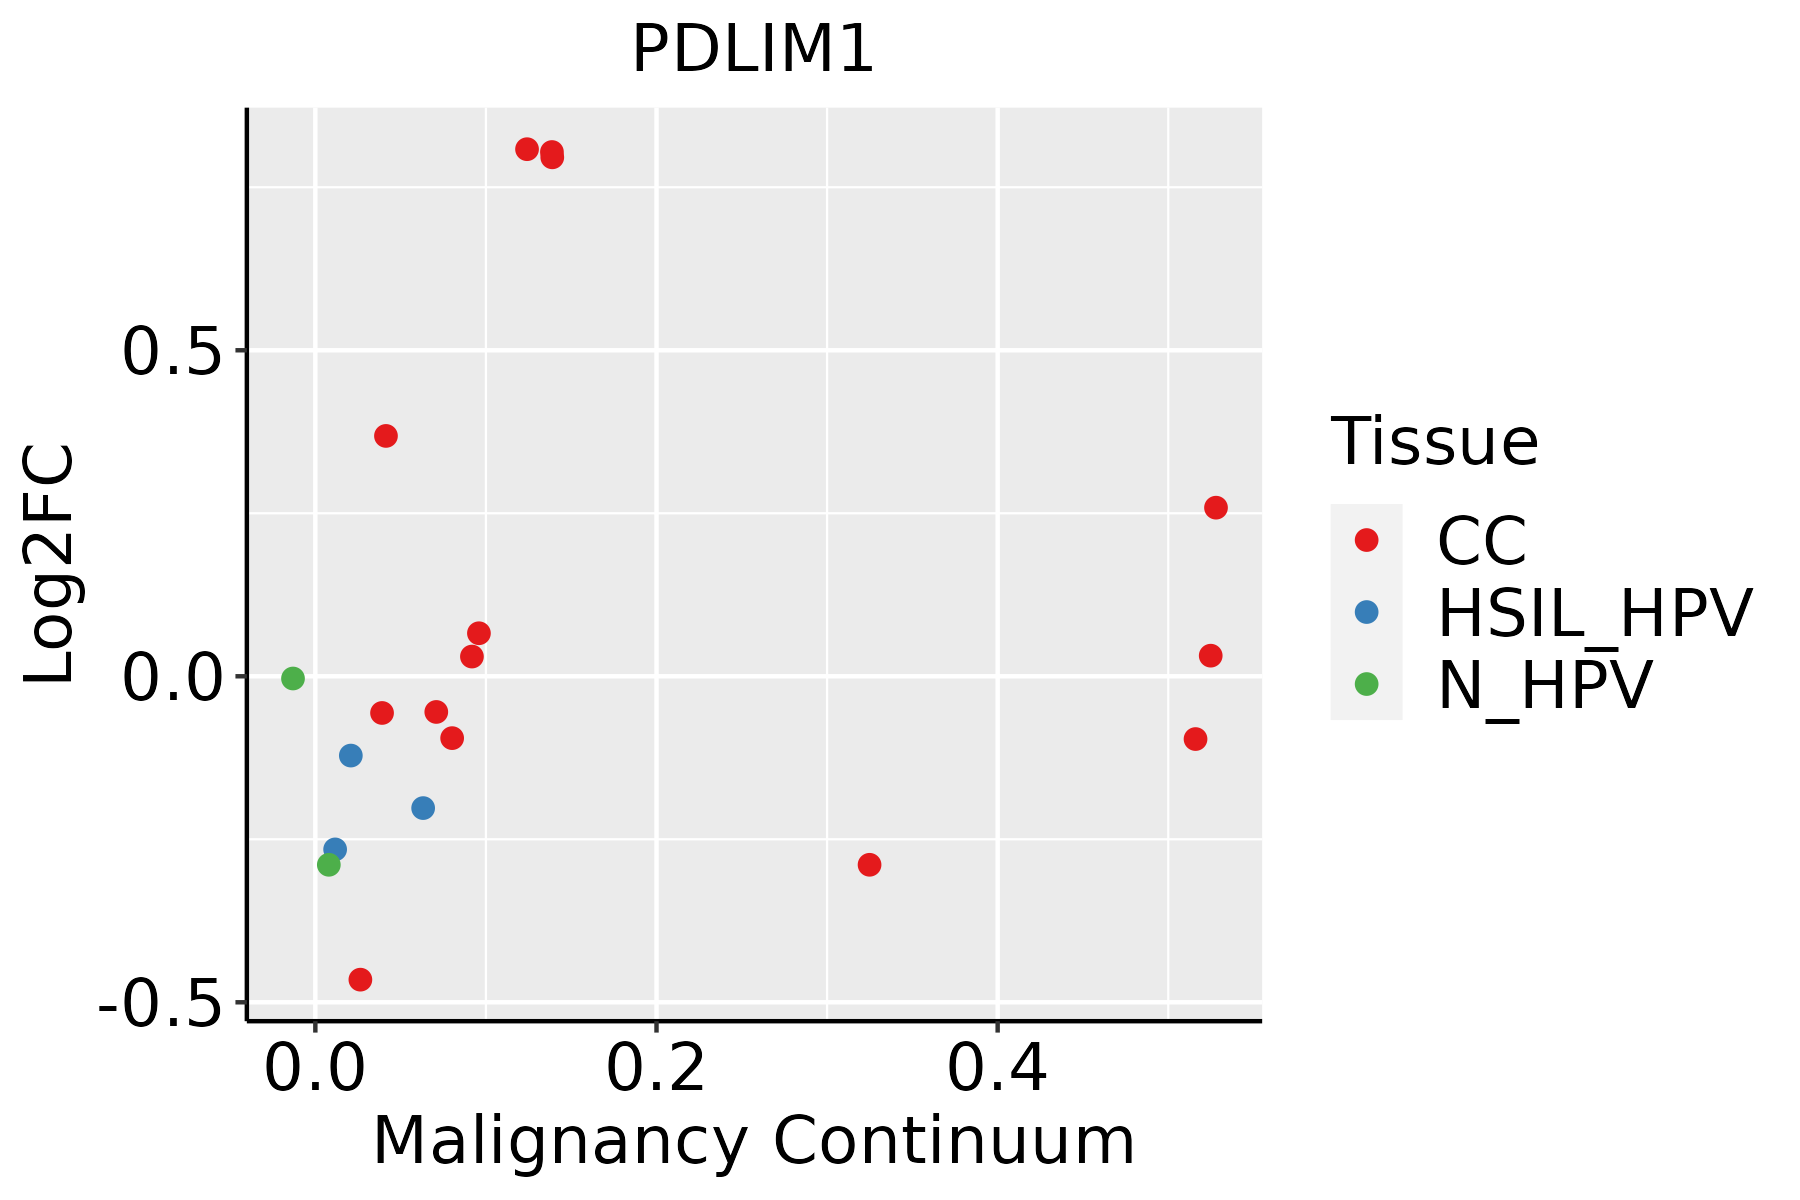 | CC: Cervix cancer |
| HSIL_HPV: HPV-infected high-grade squamous intraepithelial lesions | ||
| N_HPV: HPV-infected normal cervix | ||
| Colorectum (GSE201348) |  | FAP: Familial adenomatous polyposis |
| CRC: Colorectal cancer | ||
| Colorectum (HTA11) | 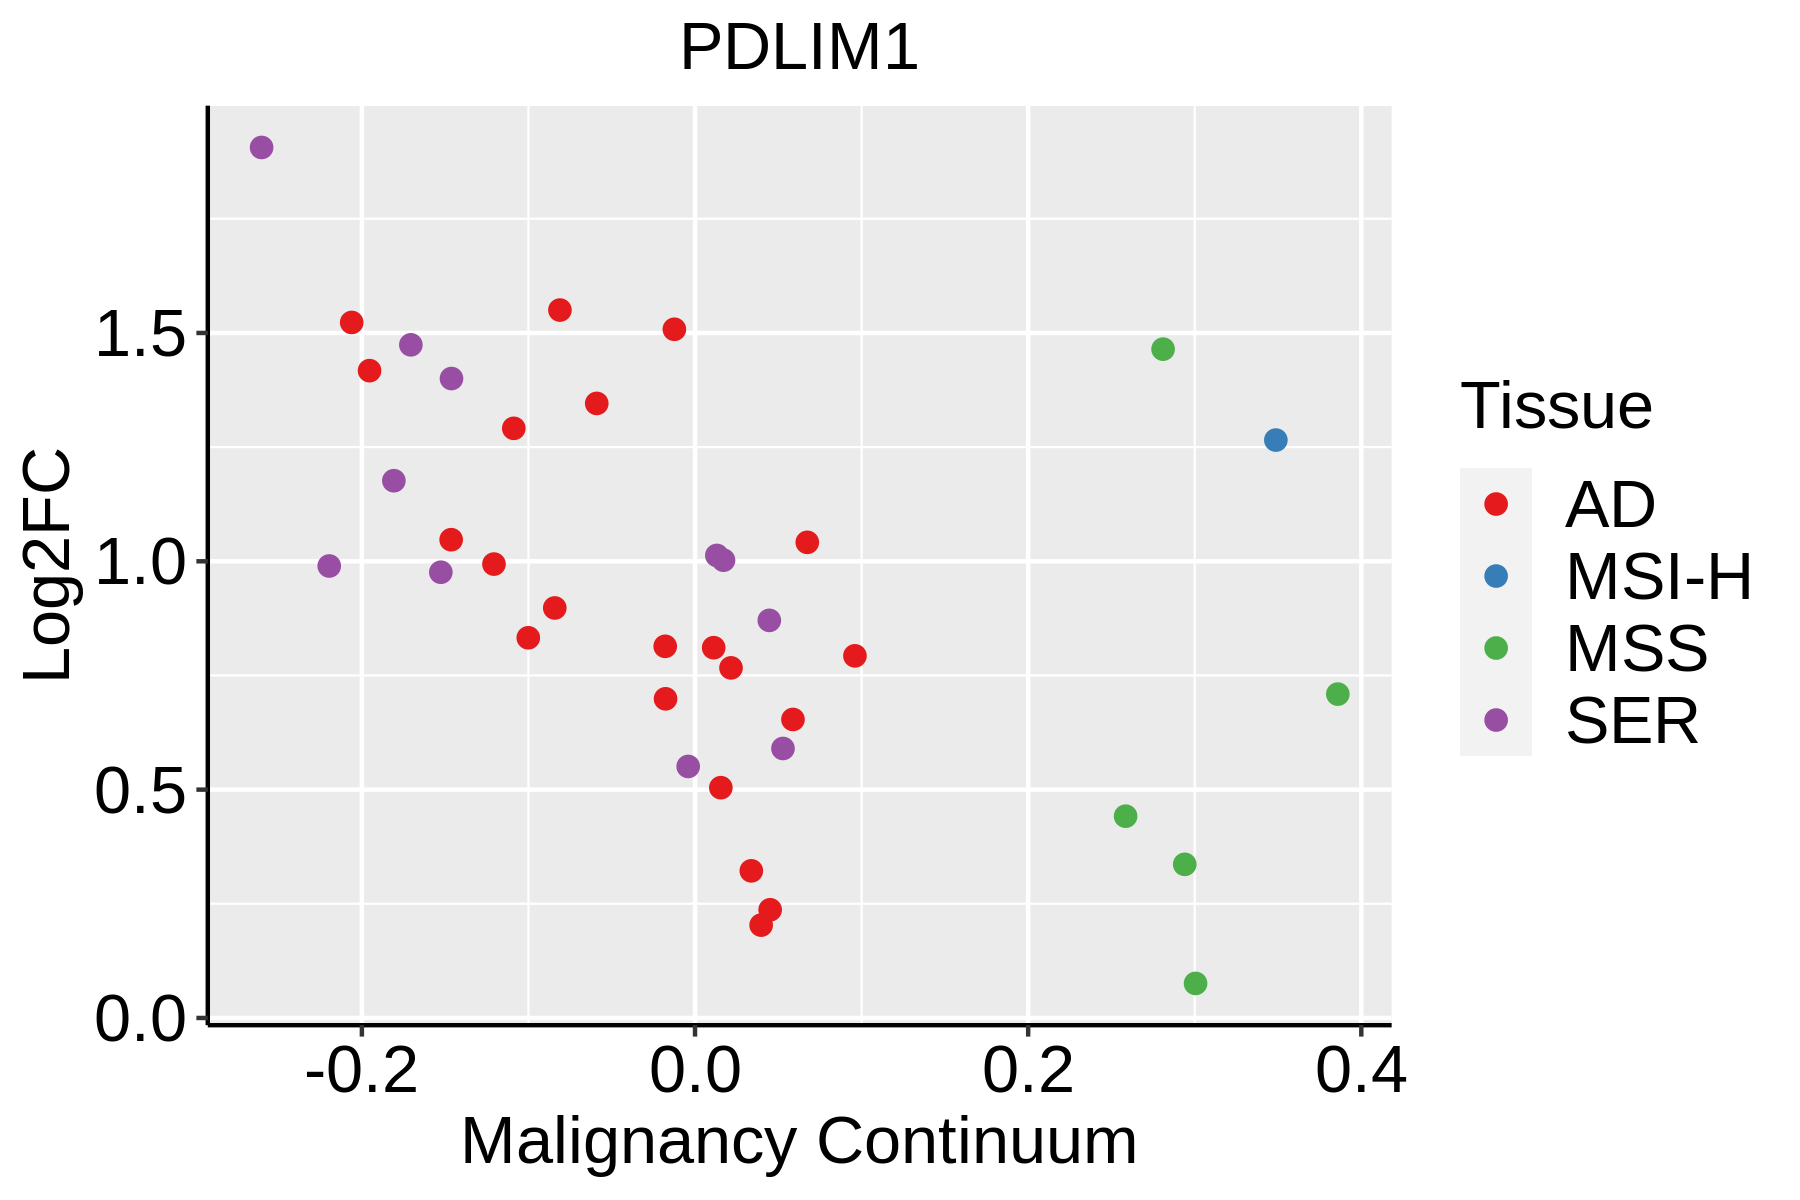 | AD: Adenomas |
| SER: Sessile serrated lesions | ||
| MSI-H: Microsatellite-high colorectal cancer | ||
| MSS: Microsatellite stable colorectal cancer | ||
| Endometrium | 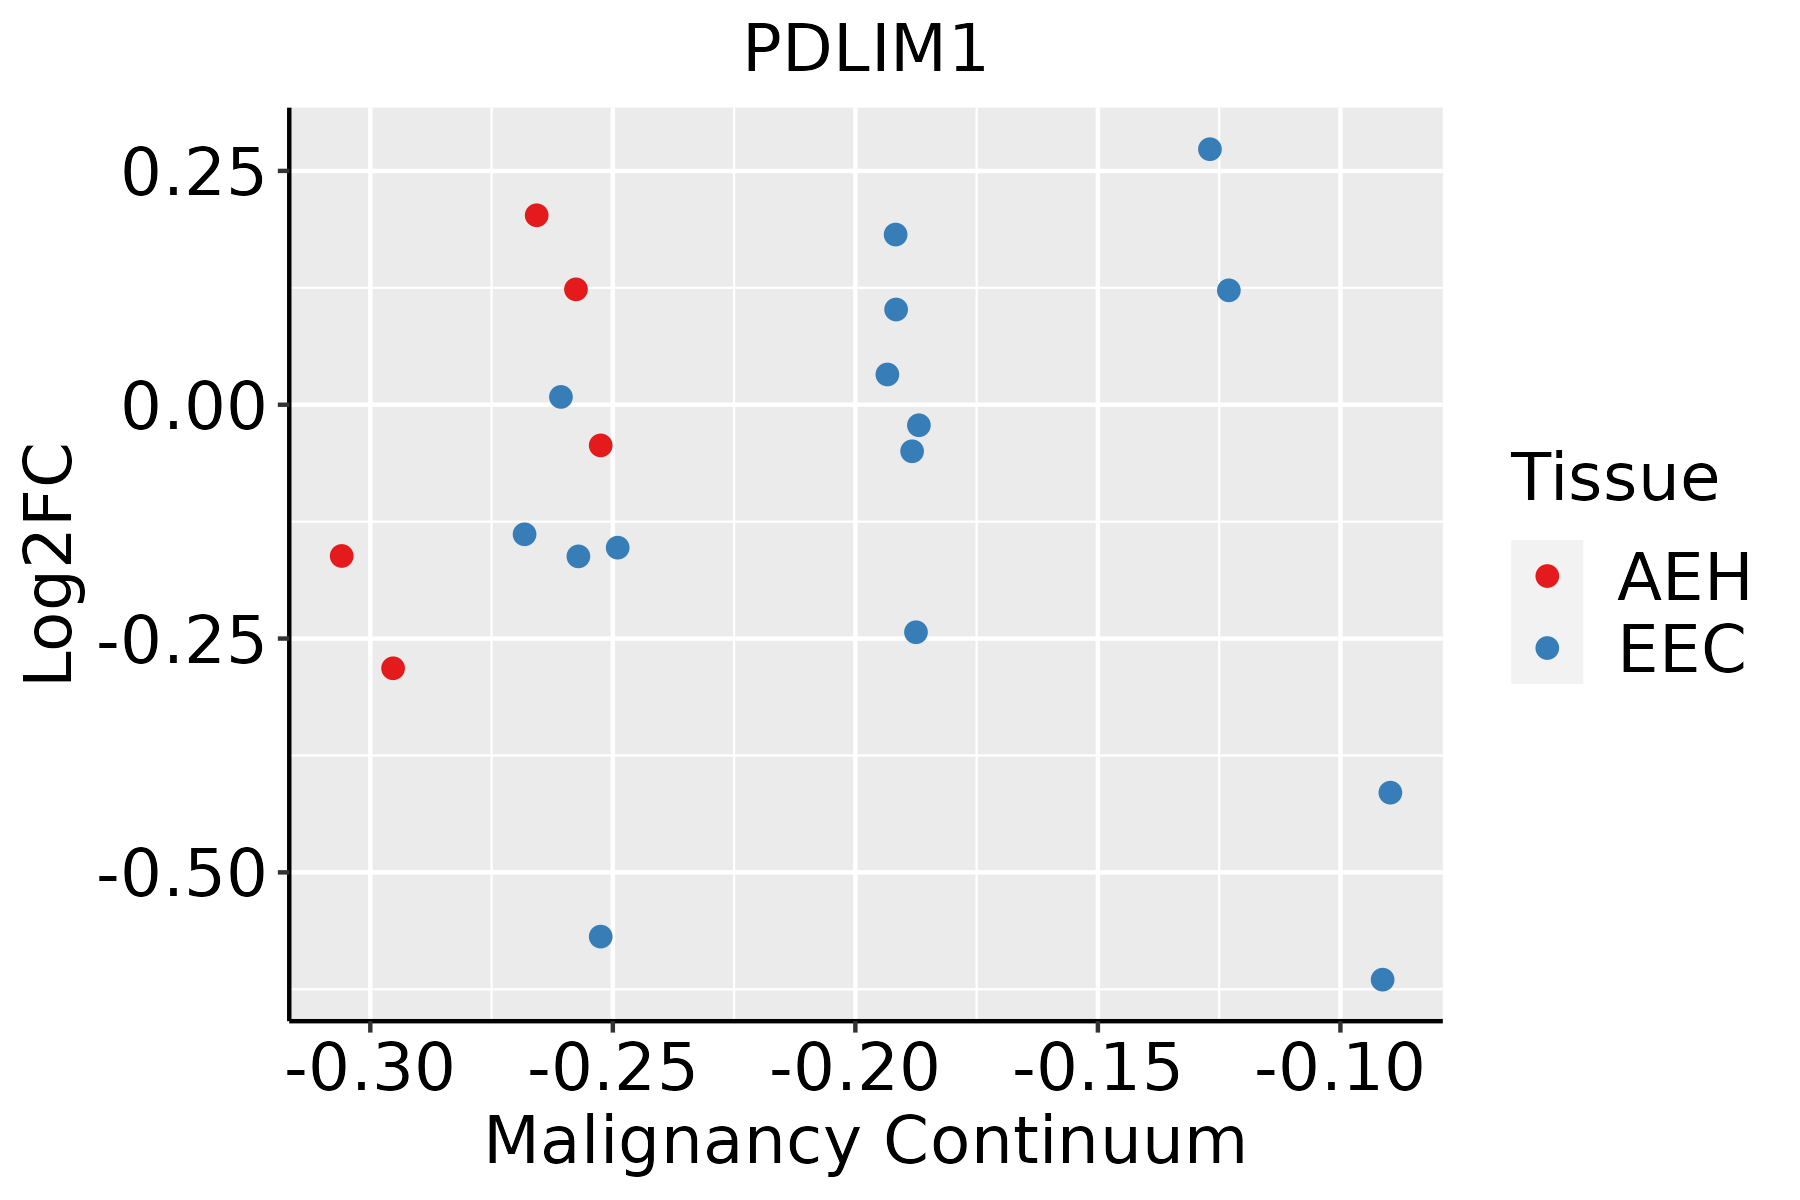 | AEH: Atypical endometrial hyperplasia |
| EEC: Endometrioid Cancer | ||
| Esophagus | 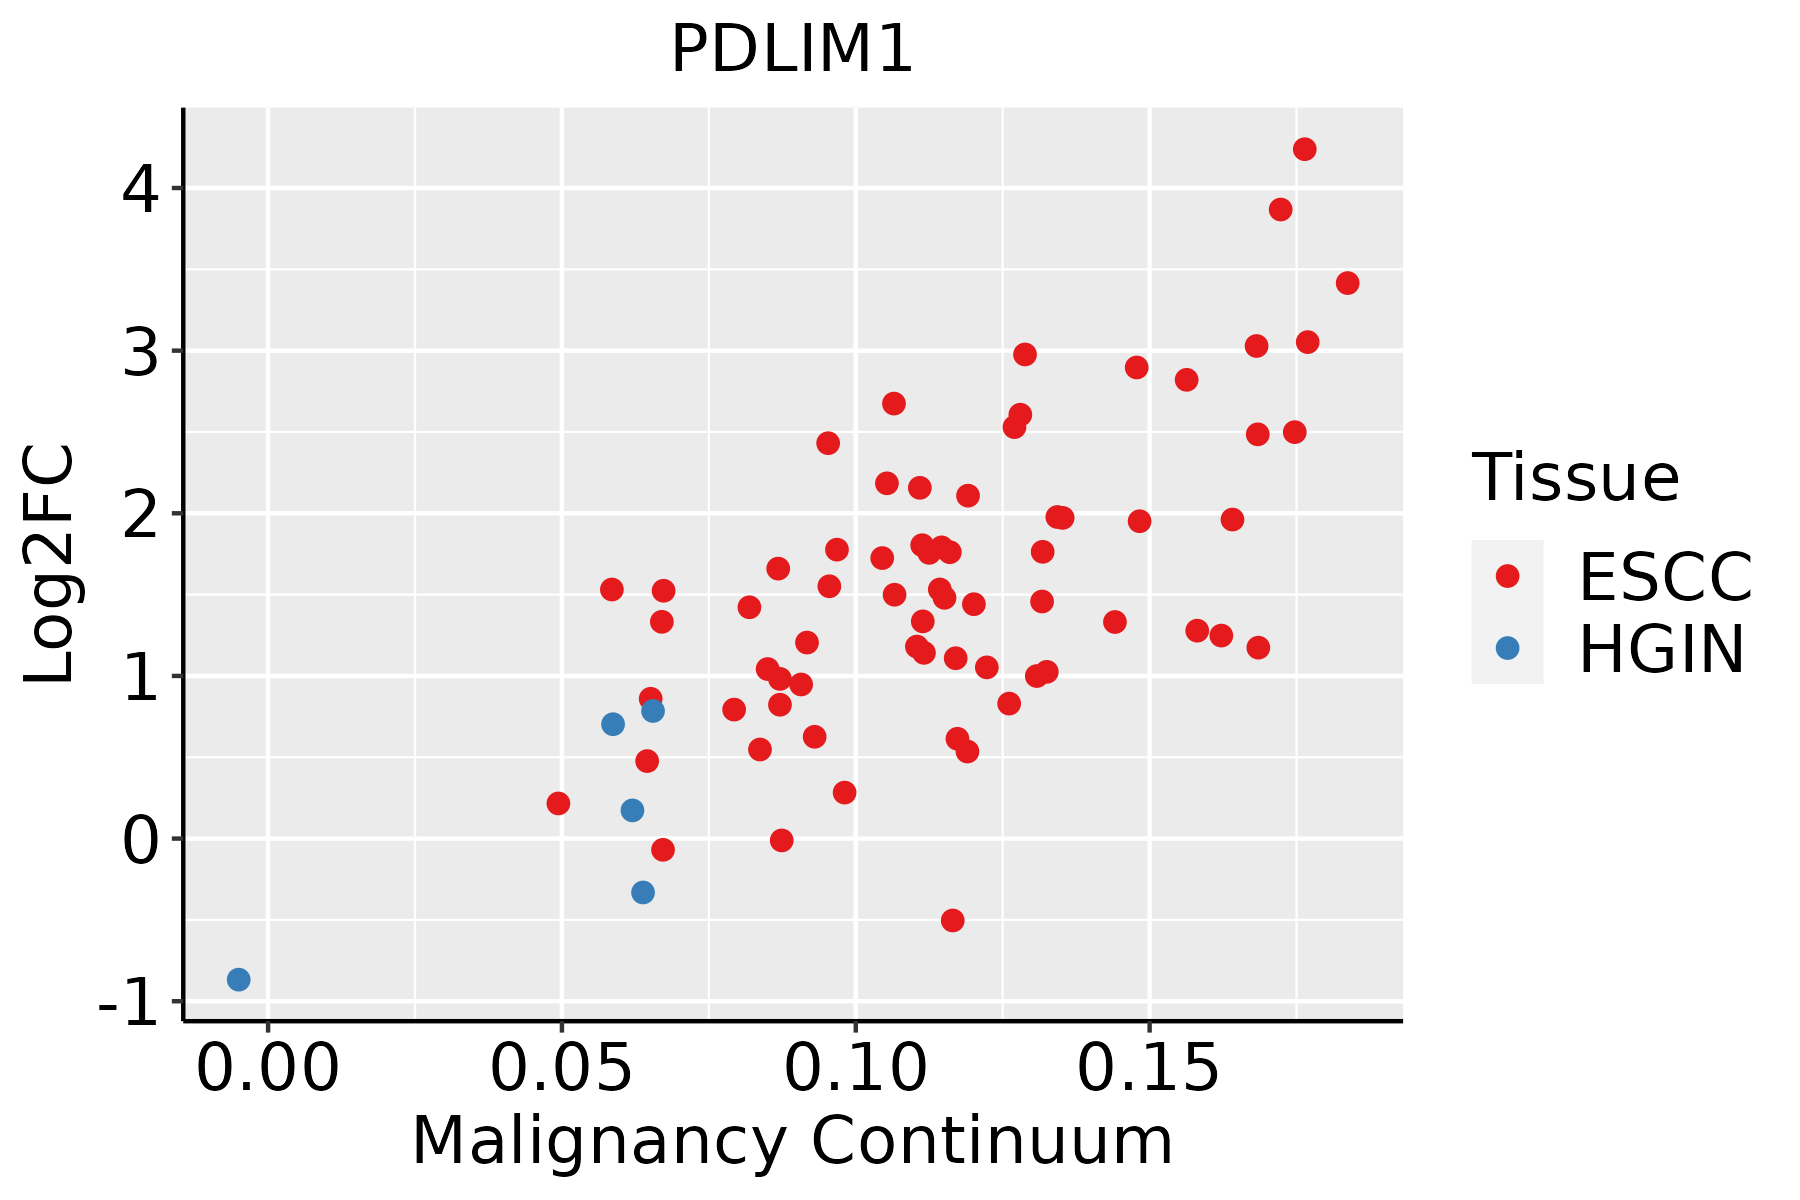 | ESCC: Esophageal squamous cell carcinoma |
| HGIN: High-grade intraepithelial neoplasias | ||
| LGIN: Low-grade intraepithelial neoplasias | ||
| GC |  | CAG: Chronic atrophic gastritis |
| CAG with IM: Chronic atrophic gastritis with intestinal metaplasia | ||
| CSG: Chronic superficial gastritis | ||
| GC: Gastric cancer | ||
| SIM: Severe intestinal metaplasia | ||
| WIM: Wild intestinal metaplasia | ||
| Liver | 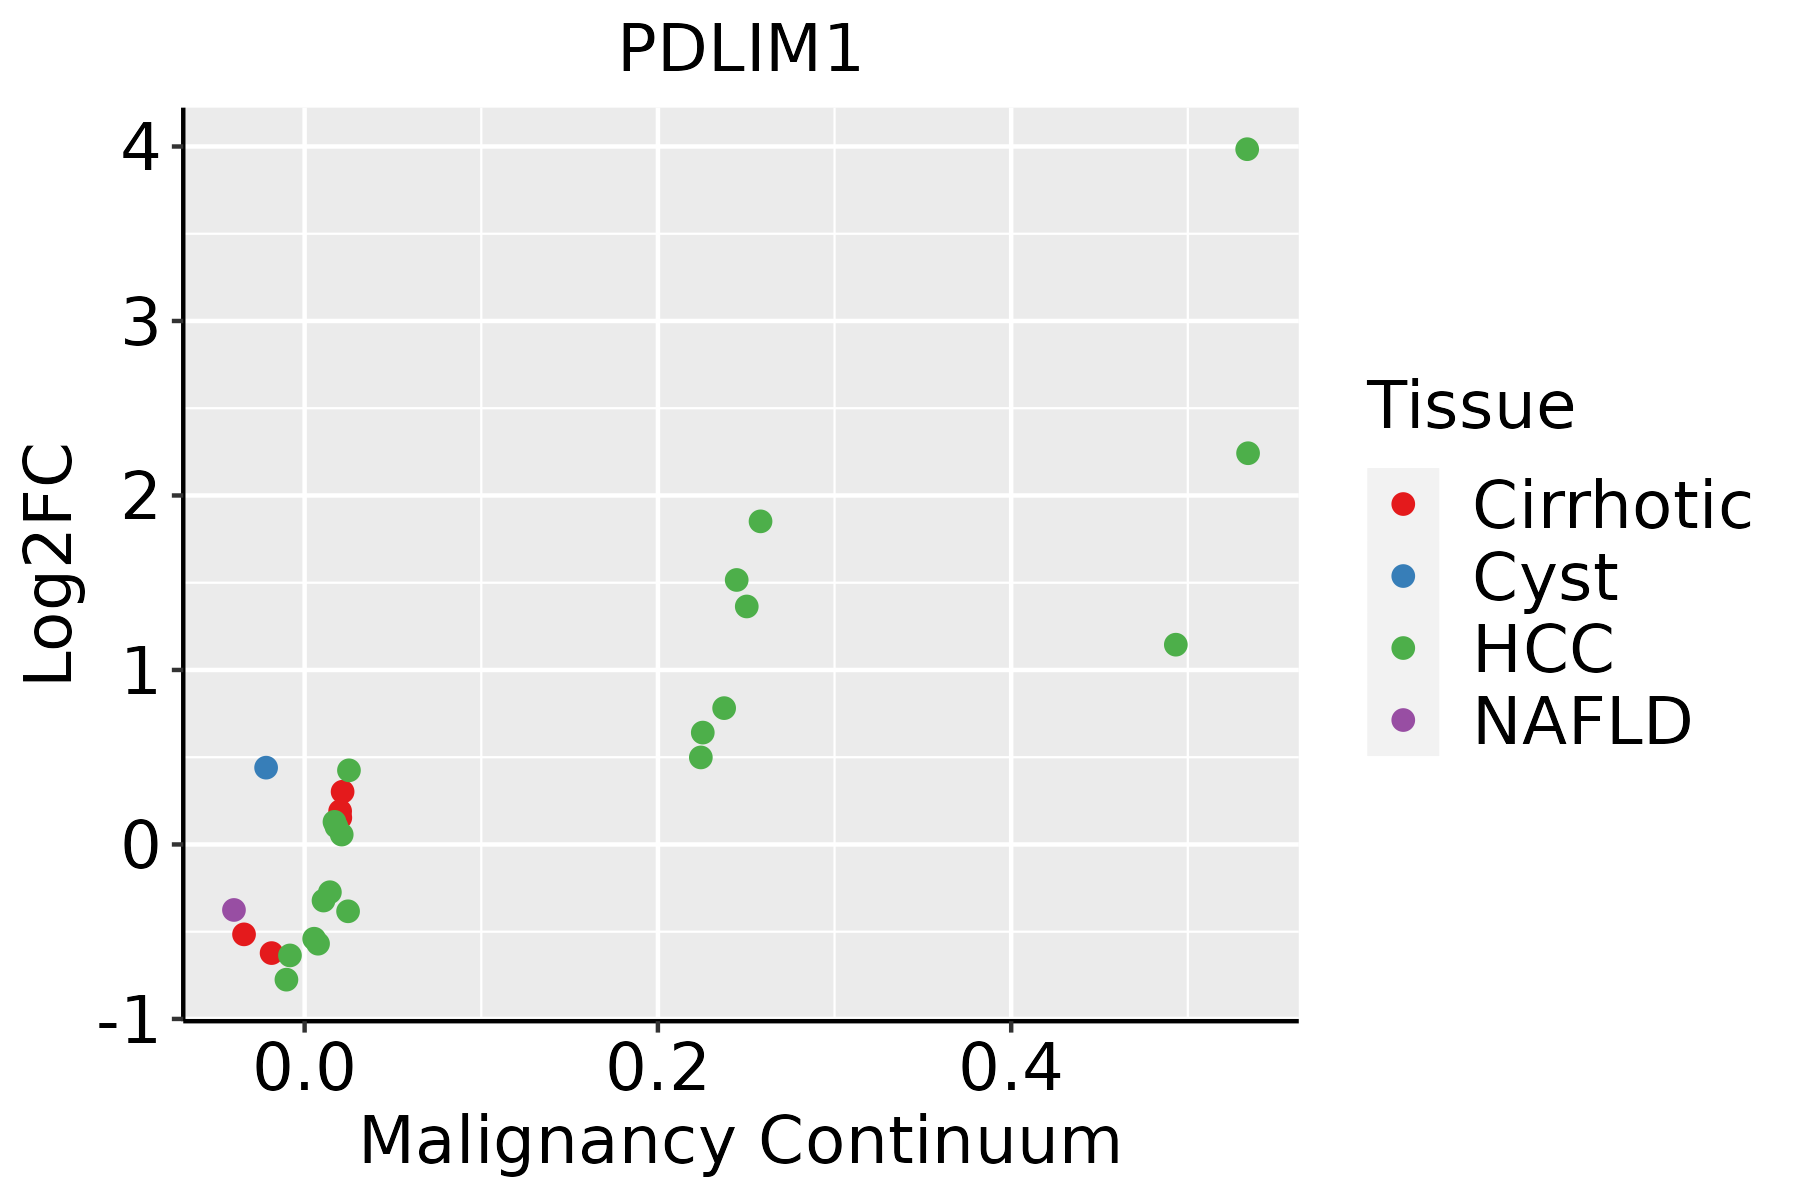 | HCC: Hepatocellular carcinoma |
| NAFLD: Non-alcoholic fatty liver disease | ||
| Lung | 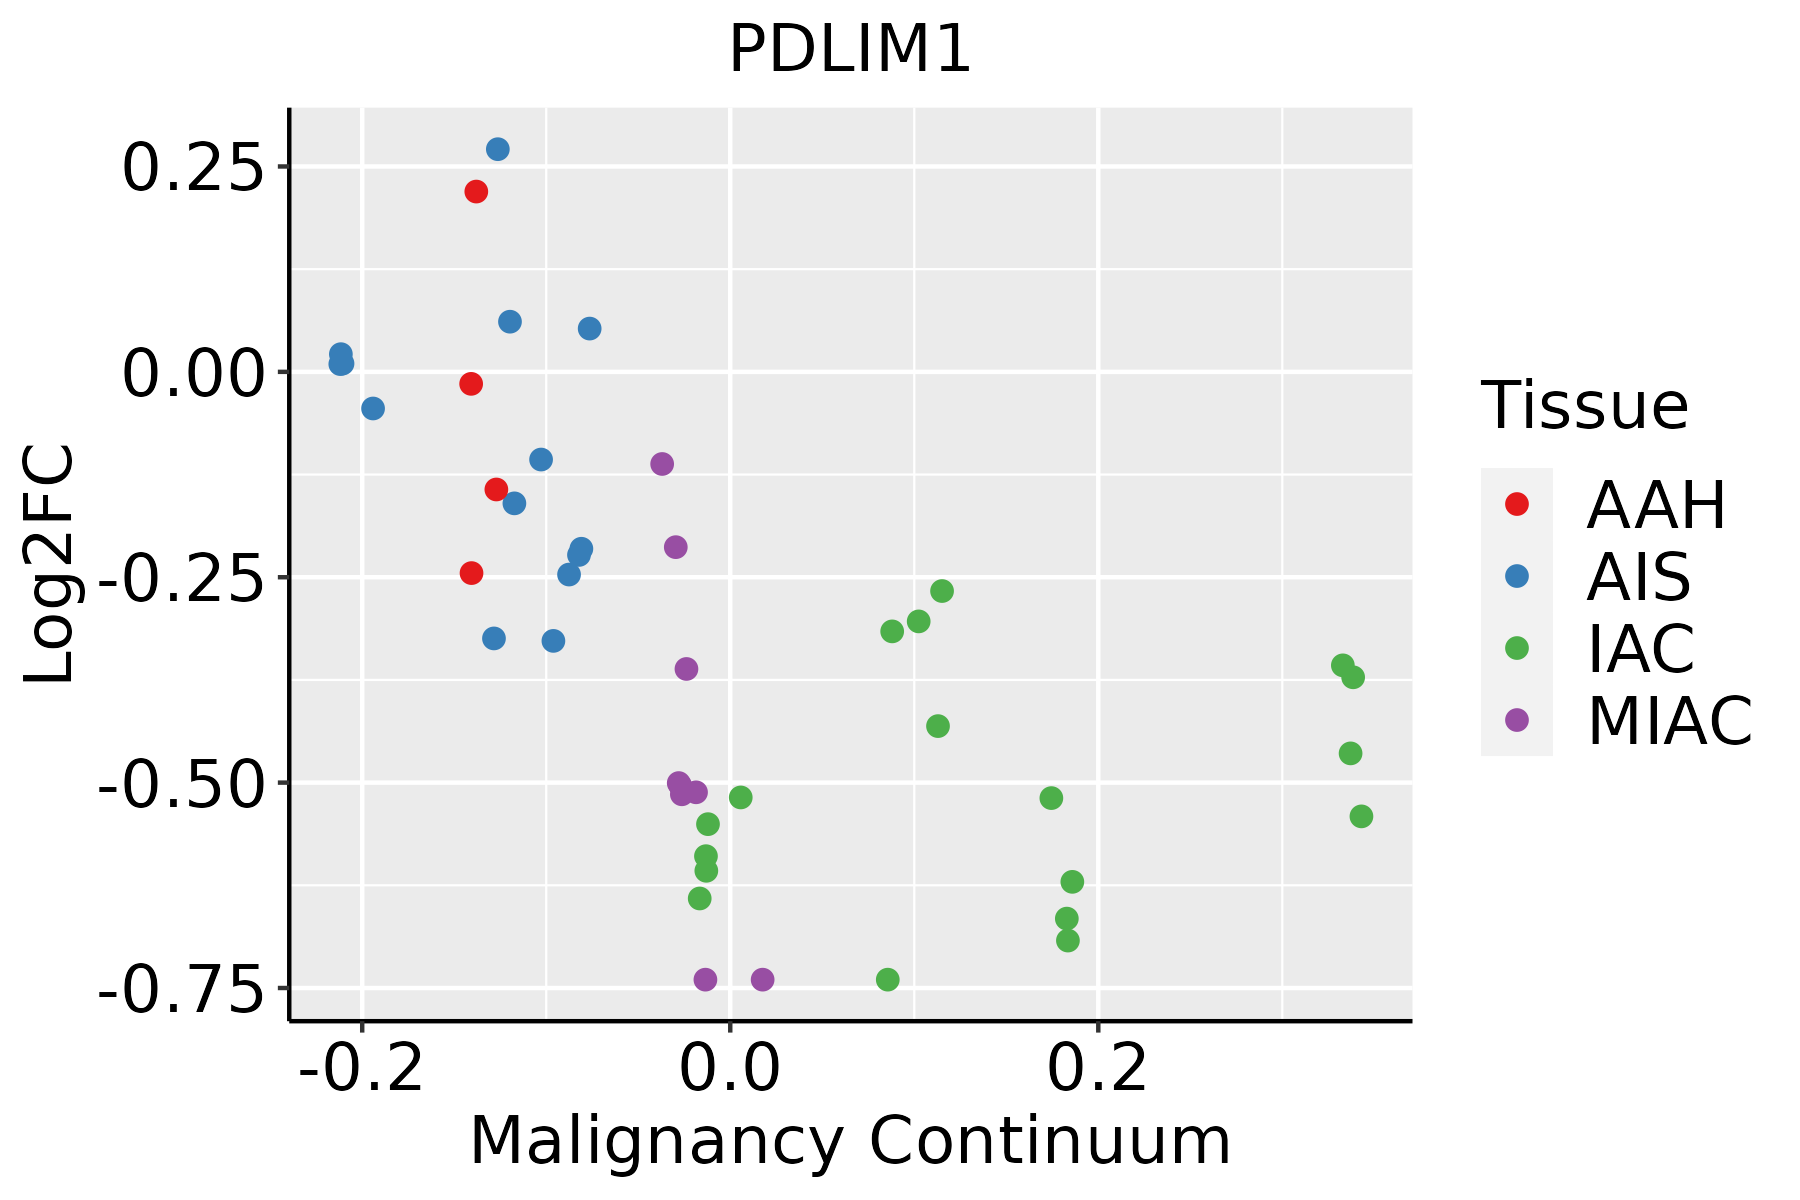 | AAH: Atypical adenomatous hyperplasia |
| AIS: Adenocarcinoma in situ | ||
| IAC: Invasive lung adenocarcinoma | ||
| MIA: Minimally invasive adenocarcinoma | ||
| Oral Cavity | 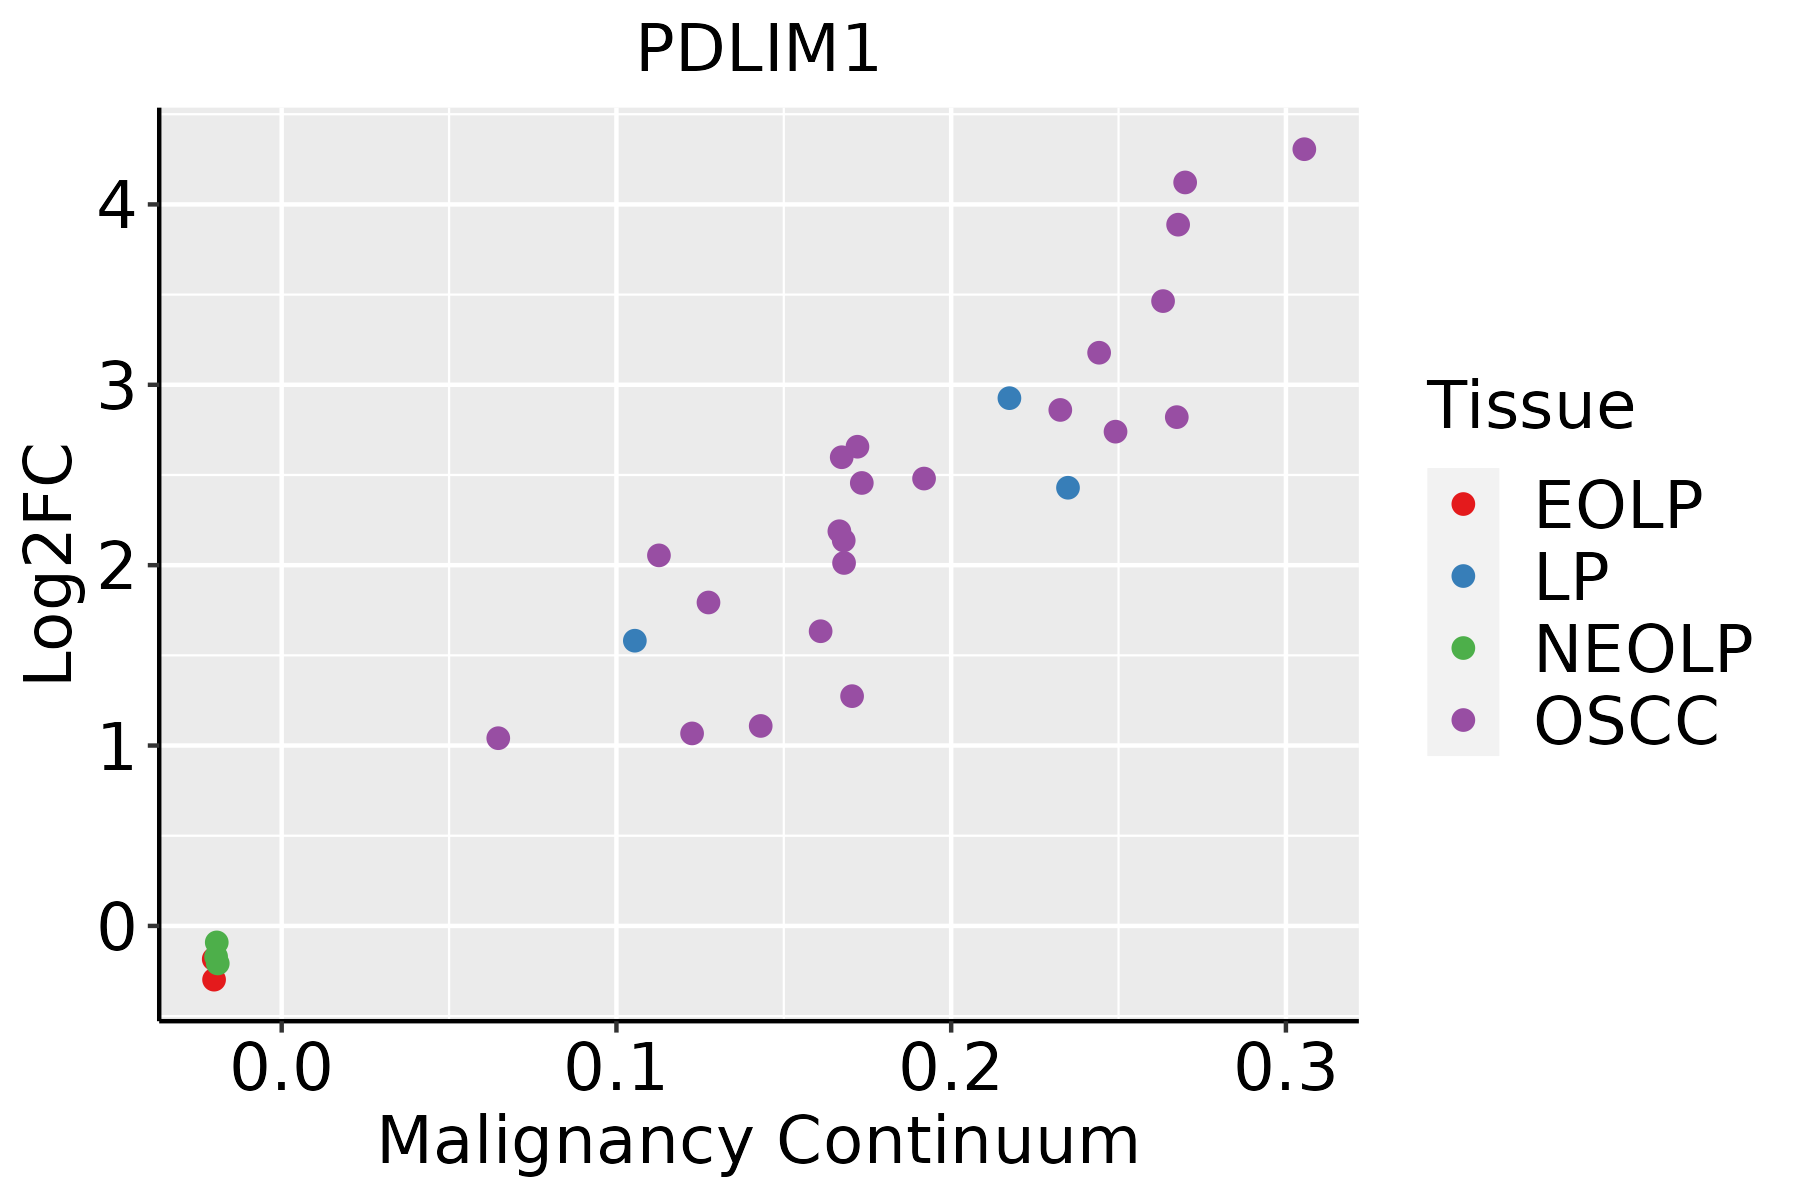 | EOLP: Erosive Oral lichen planus |
| LP: leukoplakia | ||
| NEOLP: Non-erosive oral lichen planus | ||
| OSCC: Oral squamous cell carcinoma | ||
| Prostate | 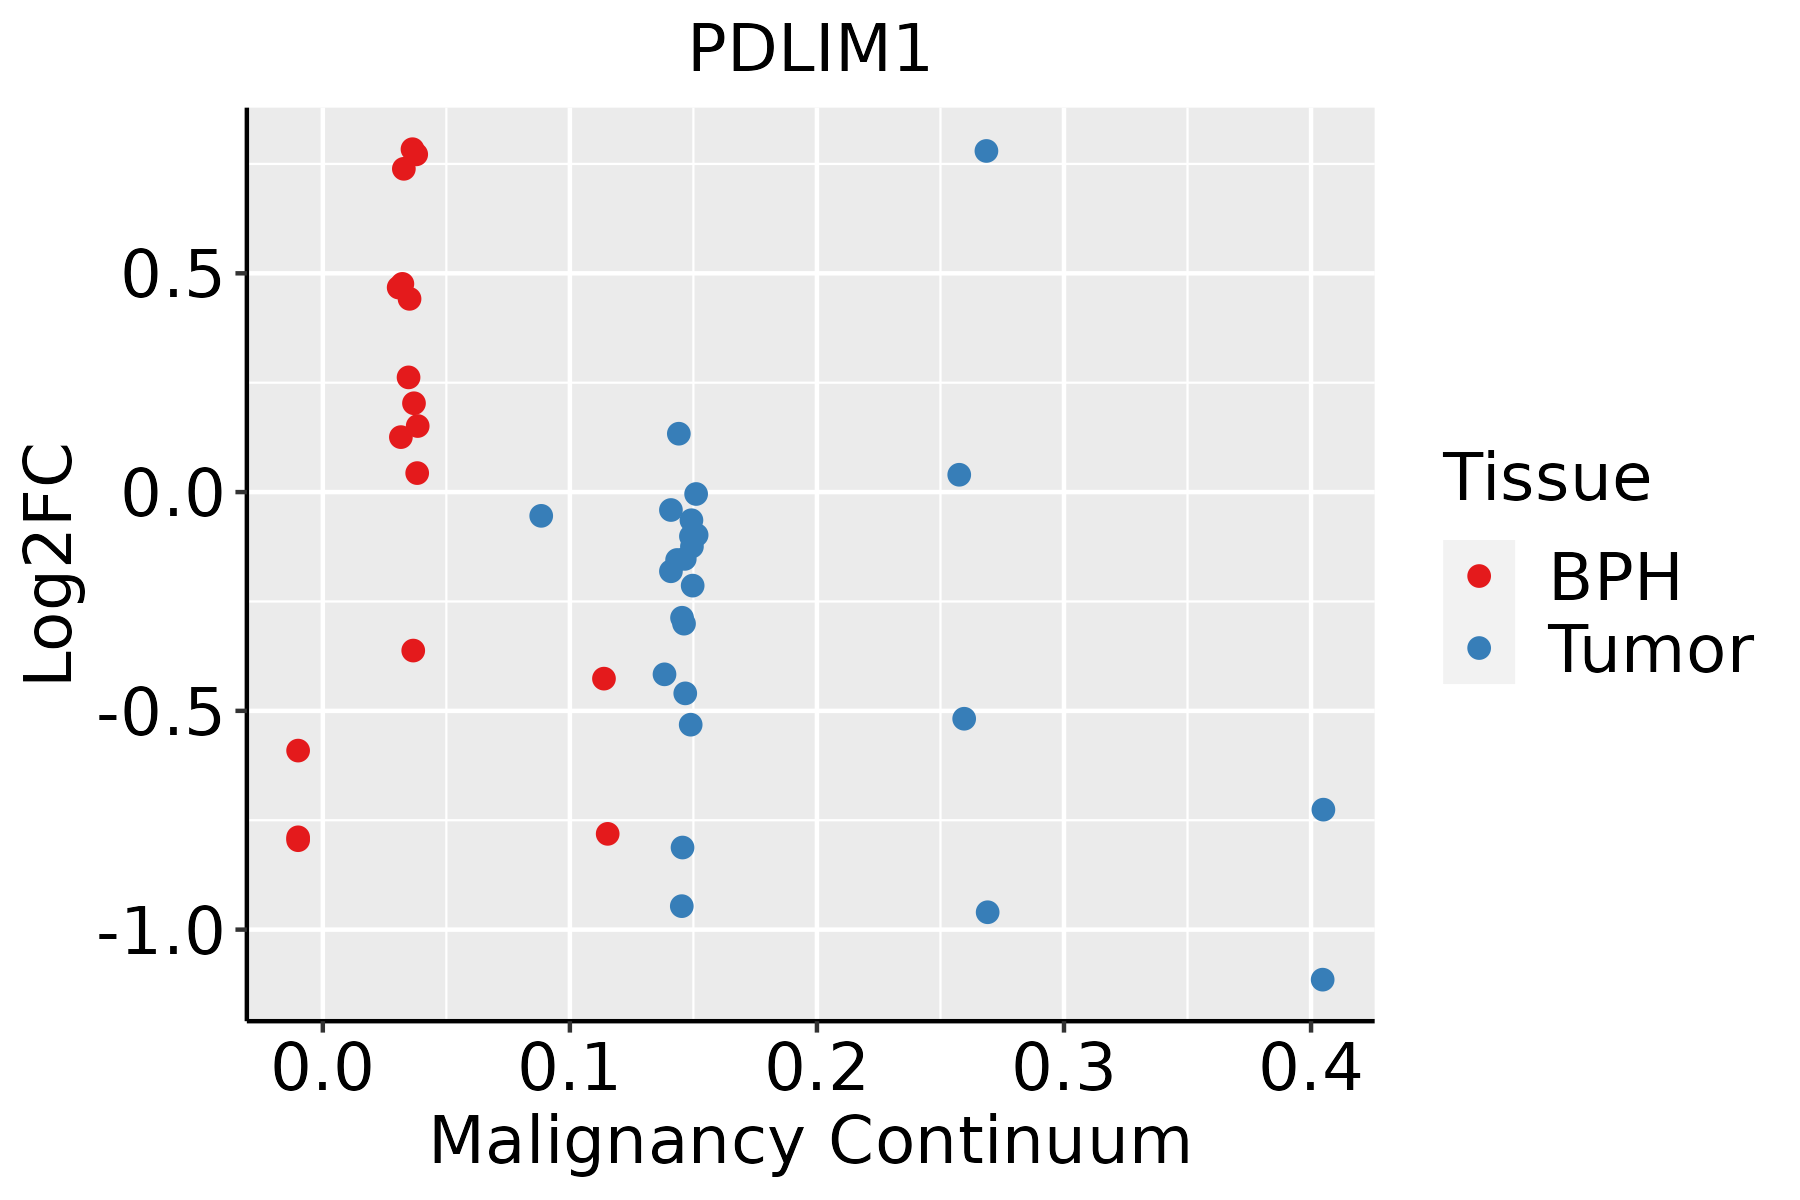 | BPH: Benign Prostatic Hyperplasia |
| Skin |  | AK: Actinic keratosis |
| cSCC: Cutaneous squamous cell carcinoma | ||
| SCCIS:squamous cell carcinoma in situ | ||
| Thyroid | 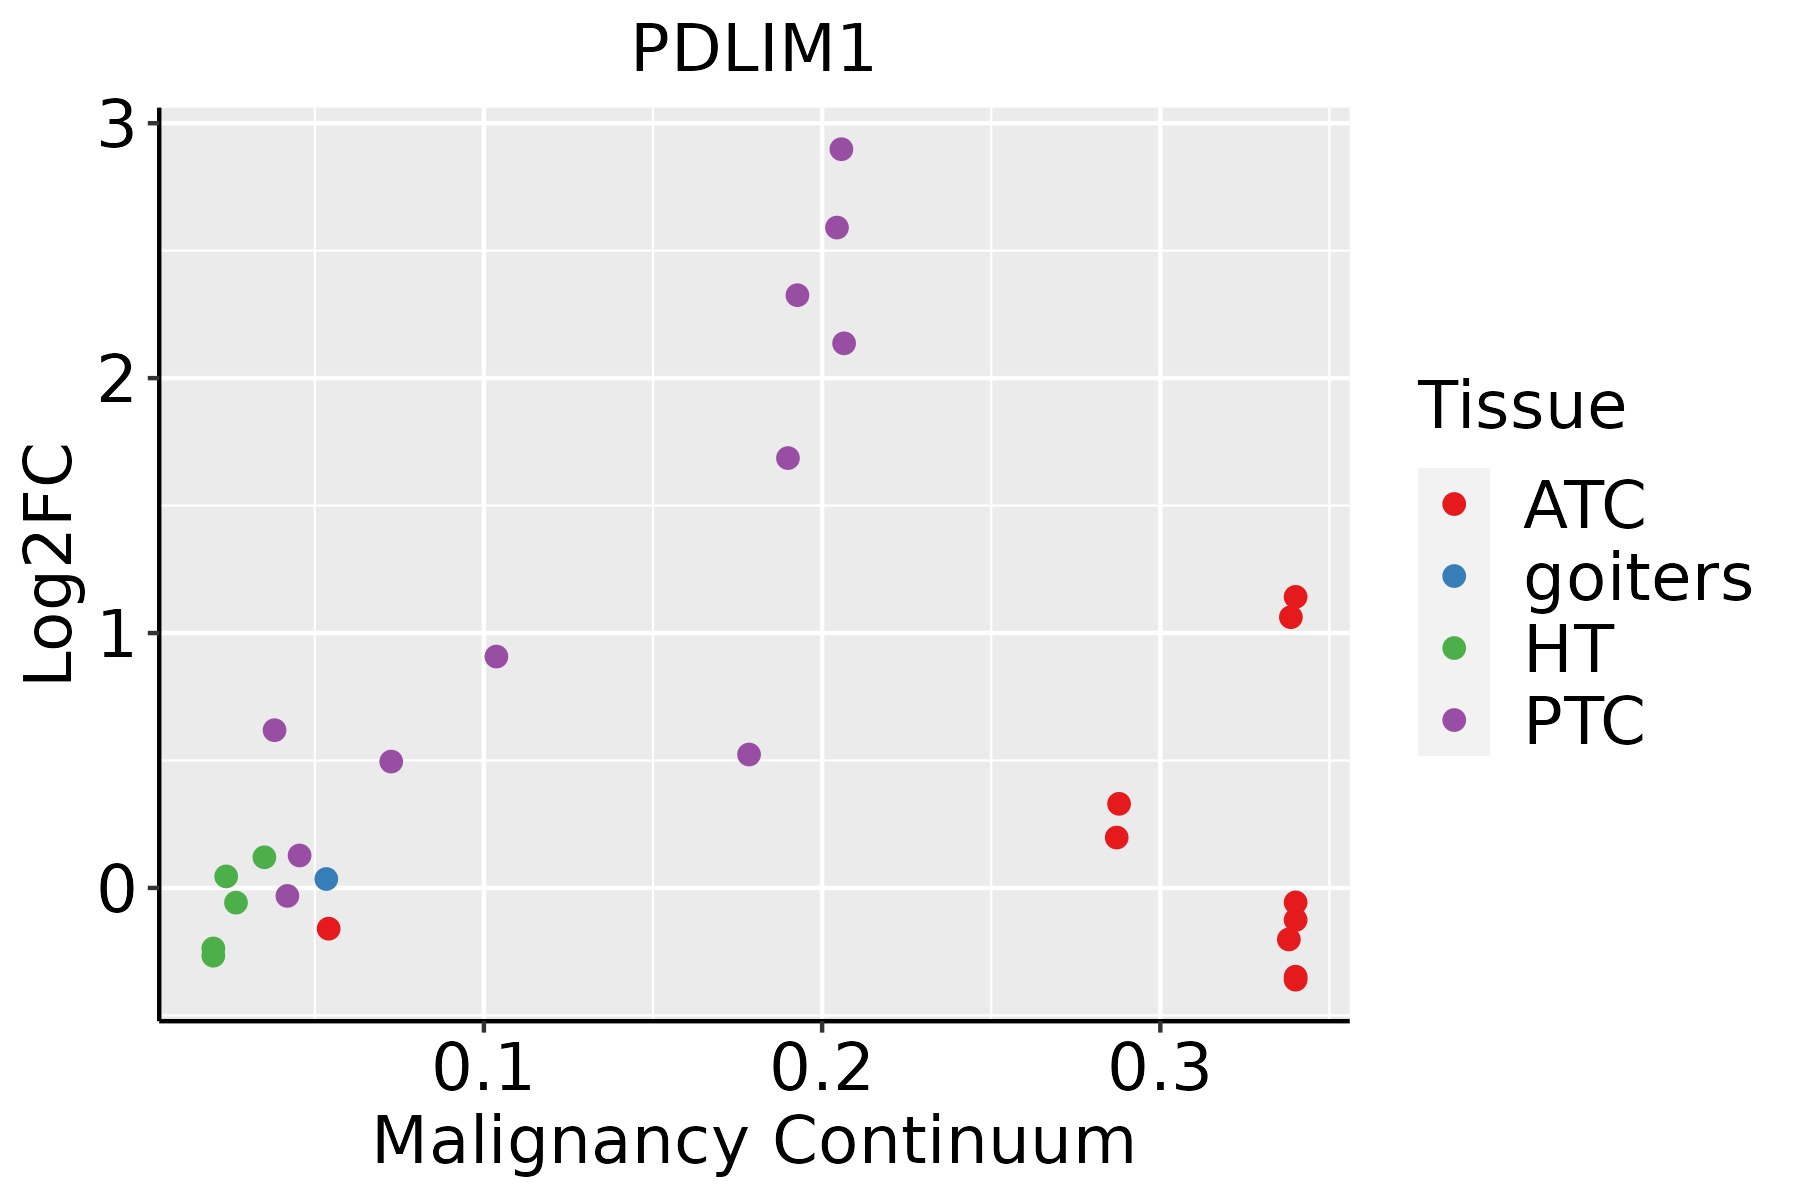 | ATC: Anaplastic thyroid cancer |
| HT: Hashimoto's thyroiditis | ||
| PTC: Papillary thyroid cancer |
| ∗log2FC in expression of this searched gene in stem-like cells from each diseased tissue sample relative to stem-like cells in normal samples in each tissue plotted against the malignancy continuum. Samples are colored based on if they are from different disease stage. |
Top |
Malignant transformation related pathway analysis |
| Find out the enriched GO biological processes and KEGG pathways involved in transition from healthy to precancer to cancer |
| Tissue | Disease Stage | Enriched GO biological Processes |
| Colorectum | AD |  |
| Colorectum | SER |  |
| Colorectum | MSS |  |
| Colorectum | MSI-H |  |
| Colorectum | FAP |  |
| ∗Top 15 enriched GO BP terms are showed in the bar plot of each disease state in each tissue. Each row represents a significant GO biological process which is colored according to the -log10(p.adjust). |
| Page: 1 2 3 4 5 6 7 8 9 |
| GO ID | Tissue | Disease Stage | Description | Gene Ratio | Bg Ratio | pvalue | p.adjust | Count |
| GO:00069799 | Breast | Precancer | response to oxidative stress | 70/1080 | 446/18723 | 1.59e-14 | 4.26e-12 | 70 |
| GO:00362939 | Breast | Precancer | response to decreased oxygen levels | 53/1080 | 322/18723 | 4.09e-12 | 6.84e-10 | 53 |
| GO:00016669 | Breast | Precancer | response to hypoxia | 51/1080 | 307/18723 | 7.33e-12 | 1.11e-09 | 51 |
| GO:00704829 | Breast | Precancer | response to oxygen levels | 55/1080 | 347/18723 | 7.47e-12 | 1.11e-09 | 55 |
| GO:00016678 | Breast | Precancer | ameboidal-type cell migration | 47/1080 | 475/18723 | 2.19e-04 | 3.35e-03 | 47 |
| GO:00070159 | Breast | Precancer | actin filament organization | 44/1080 | 442/18723 | 3.02e-04 | 4.35e-03 | 44 |
| GO:00300389 | Breast | Precancer | contractile actin filament bundle assembly | 14/1080 | 106/18723 | 3.07e-03 | 2.62e-02 | 14 |
| GO:00431499 | Breast | Precancer | stress fiber assembly | 14/1080 | 106/18723 | 3.07e-03 | 2.62e-02 | 14 |
| GO:00071638 | Breast | Precancer | establishment or maintenance of cell polarity | 23/1080 | 218/18723 | 3.82e-03 | 3.06e-02 | 23 |
| GO:00510179 | Breast | Precancer | actin filament bundle assembly | 18/1080 | 157/18723 | 4.17e-03 | 3.28e-02 | 18 |
| GO:00615729 | Breast | Precancer | actin filament bundle organization | 18/1080 | 161/18723 | 5.43e-03 | 4.01e-02 | 18 |
| GO:000697914 | Breast | IDC | response to oxidative stress | 83/1434 | 446/18723 | 2.36e-14 | 7.06e-12 | 83 |
| GO:007048214 | Breast | IDC | response to oxygen levels | 64/1434 | 347/18723 | 3.45e-11 | 5.57e-09 | 64 |
| GO:003629314 | Breast | IDC | response to decreased oxygen levels | 60/1434 | 322/18723 | 9.26e-11 | 1.25e-08 | 60 |
| GO:000166614 | Breast | IDC | response to hypoxia | 58/1434 | 307/18723 | 1.09e-10 | 1.38e-08 | 58 |
| GO:000166714 | Breast | IDC | ameboidal-type cell migration | 64/1434 | 475/18723 | 6.65e-06 | 2.05e-04 | 64 |
| GO:000701514 | Breast | IDC | actin filament organization | 55/1434 | 442/18723 | 2.45e-04 | 3.84e-03 | 55 |
| GO:000716314 | Breast | IDC | establishment or maintenance of cell polarity | 32/1434 | 218/18723 | 2.84e-04 | 4.33e-03 | 32 |
| GO:003003814 | Breast | IDC | contractile actin filament bundle assembly | 19/1434 | 106/18723 | 4.05e-04 | 5.60e-03 | 19 |
| GO:004314914 | Breast | IDC | stress fiber assembly | 19/1434 | 106/18723 | 4.05e-04 | 5.60e-03 | 19 |
| Page: 1 2 3 4 5 6 7 8 9 10 11 12 13 14 15 16 17 18 19 |
| Pathway ID | Tissue | Disease Stage | Description | Gene Ratio | Bg Ratio | pvalue | p.adjust | qvalue | Count |
| Page: 1 |
Top |
Cell-cell communication analysis |
| Identification of potential cell-cell interactions between two cell types and their ligand-receptor pairs for different disease states |
| Ligand | Receptor | LRpair | Pathway | Tissue | Disease Stage |
| Page: 1 |
Top |
Single-cell gene regulatory network inference analysis |
| Find out the significant the regulons (TFs) and the target genes of each regulon across cell types for different disease states |
| TF | Cell Type | Tissue | Disease Stage | Target Gene | RSS | Regulon Activity |
| ∗The dot plots of a searched regulon are shown for all cell subpopulations in each disease state of each tissue based on the regulon specific score inferred using pySCENIC and by calculating the average expression. |
| Page: 1 |
Top |
Somatic mutation of malignant transformation related genes |
| Annotation of somatic variants for genes involved in malignant transformation |
| Hugo Symbol | Variant Class | Variant Classification | dbSNP RS | HGVSc | HGVSp | HGVSp Short | SWISSPROT | BIOTYPE | SIFT | PolyPhen | Tumor Sample Barcode | Tissue | Histology | Sex | Age | Stage | Therapy Types | Drugs | Outcome |
| PDLIM1 | SNV | Missense_Mutation | rs374874749 | c.749N>T | p.Ser250Leu | p.S250L | O00151 | protein_coding | tolerated(0.19) | benign(0.04) | TCGA-AN-A046-01 | Breast | breast invasive carcinoma | Female | >=65 | I/II | Unknown | Unknown | SD |
| PDLIM1 | SNV | Missense_Mutation | c.561N>G | p.Ser187Arg | p.S187R | O00151 | protein_coding | tolerated(0.57) | benign(0) | TCGA-GM-A2DA-01 | Breast | breast invasive carcinoma | Female | <65 | I/II | Chemotherapy | fluorouracil | PD | |
| PDLIM1 | insertion | Frame_Shift_Ins | novel | c.436_437insCTTGGCTAAGTTTTACTTTTTTTTGTAGAGATTGGGA | p.Asn146ThrfsTer21 | p.N146Tfs*21 | O00151 | protein_coding | TCGA-E9-A1NC-01 | Breast | breast invasive carcinoma | Female | <65 | I/II | Chemotherapy | doxorubicin | CR | ||
| PDLIM1 | SNV | Missense_Mutation | rs151177027 | c.571G>A | p.Asp191Asn | p.D191N | O00151 | protein_coding | tolerated(0.08) | benign(0.155) | TCGA-2W-A8YY-01 | Cervix | cervical & endocervical cancer | Female | <65 | I/II | Chemotherapy | cisplatin | CR |
| PDLIM1 | SNV | Missense_Mutation | c.430T>C | p.Tyr144His | p.Y144H | O00151 | protein_coding | tolerated(0.05) | benign(0.172) | TCGA-AA-3672-01 | Colorectum | colon adenocarcinoma | Female | >=65 | III/IV | Unknown | Unknown | SD | |
| PDLIM1 | SNV | Missense_Mutation | c.594N>T | p.Lys198Asn | p.K198N | O00151 | protein_coding | deleterious(0.02) | probably_damaging(0.976) | TCGA-AA-A010-01 | Colorectum | colon adenocarcinoma | Female | <65 | I/II | Chemotherapy | folinic | CR | |
| PDLIM1 | SNV | Missense_Mutation | c.142N>T | p.Asp48Tyr | p.D48Y | O00151 | protein_coding | deleterious(0) | possibly_damaging(0.791) | TCGA-AA-A010-01 | Colorectum | colon adenocarcinoma | Female | <65 | I/II | Chemotherapy | folinic | CR | |
| PDLIM1 | SNV | Missense_Mutation | c.509N>A | p.Ser170Asn | p.S170N | O00151 | protein_coding | tolerated(0.5) | benign(0) | TCGA-AM-5821-01 | Colorectum | colon adenocarcinoma | Female | >=65 | I/II | Unknown | Unknown | SD | |
| PDLIM1 | SNV | Missense_Mutation | rs151177027 | c.571N>A | p.Asp191Asn | p.D191N | O00151 | protein_coding | tolerated(0.08) | benign(0.155) | TCGA-CA-6718-01 | Colorectum | colon adenocarcinoma | Male | <65 | I/II | Unknown | Unknown | PD |
| PDLIM1 | SNV | Missense_Mutation | c.856N>C | p.Cys286Arg | p.C286R | O00151 | protein_coding | deleterious(0) | probably_damaging(0.984) | TCGA-CM-5861-01 | Colorectum | colon adenocarcinoma | Female | <65 | I/II | Unknown | Unknown | PD |
| Page: 1 2 3 4 |
Top |
Related drugs of malignant transformation related genes |
| Identification of chemicals and drugs interact with genes involved in malignant transfromation |
| (DGIdb 4.0) |
| Entrez ID | Symbol | Category | Interaction Types | Drug Claim Name | Drug Name | PMIDs |
| Page: 1 |

Copyright 2023-Present -The University of Texas Health Science Center at Houston |