
|
|||||
|
 | |
| |
| |
| |
| |
| |
|
Gene: PDK3 |
Gene summary for PDK3 |
| Gene information | Species | Human | Gene symbol | PDK3 | Gene ID | 5165 |
| Gene name | pyruvate dehydrogenase kinase 3 | |
| Gene Alias | CMTX6 | |
| Cytomap | Xp22.11 | |
| Gene Type | protein-coding | GO ID | GO:0001666 | UniProtAcc | Q15120 |
Top |
Malignant transformation analysis |
| Identification of the aberrant gene expression in precancerous and cancerous lesions by comparing the gene expression of stem-like cells in diseased tissues with normal stem cells |
| Entrez ID | Symbol | Replicates | Species | Organ | Tissue | Adj P-value | Log2FC | Malignancy |
| 5165 | PDK3 | LZE4T | Human | Esophagus | ESCC | 1.47e-07 | 1.92e-01 | 0.0811 |
| 5165 | PDK3 | LZE7T | Human | Esophagus | ESCC | 9.32e-08 | 3.14e-01 | 0.0667 |
| 5165 | PDK3 | LZE8T | Human | Esophagus | ESCC | 4.41e-02 | 1.01e-01 | 0.067 |
| 5165 | PDK3 | LZE20T | Human | Esophagus | ESCC | 4.88e-05 | 1.55e-01 | 0.0662 |
| 5165 | PDK3 | LZE24T | Human | Esophagus | ESCC | 1.48e-08 | 2.18e-01 | 0.0596 |
| 5165 | PDK3 | P2T-E | Human | Esophagus | ESCC | 2.07e-22 | 4.32e-01 | 0.1177 |
| 5165 | PDK3 | P4T-E | Human | Esophagus | ESCC | 9.47e-14 | 2.89e-01 | 0.1323 |
| 5165 | PDK3 | P5T-E | Human | Esophagus | ESCC | 1.25e-06 | 1.35e-01 | 0.1327 |
| 5165 | PDK3 | P8T-E | Human | Esophagus | ESCC | 7.34e-12 | 2.58e-01 | 0.0889 |
| 5165 | PDK3 | P10T-E | Human | Esophagus | ESCC | 5.07e-14 | 1.57e-01 | 0.116 |
| 5165 | PDK3 | P11T-E | Human | Esophagus | ESCC | 4.80e-15 | 4.57e-01 | 0.1426 |
| 5165 | PDK3 | P12T-E | Human | Esophagus | ESCC | 1.65e-16 | 3.44e-01 | 0.1122 |
| 5165 | PDK3 | P15T-E | Human | Esophagus | ESCC | 2.31e-15 | 2.95e-01 | 0.1149 |
| 5165 | PDK3 | P16T-E | Human | Esophagus | ESCC | 3.85e-09 | 1.15e-01 | 0.1153 |
| 5165 | PDK3 | P17T-E | Human | Esophagus | ESCC | 2.60e-06 | 2.33e-01 | 0.1278 |
| 5165 | PDK3 | P19T-E | Human | Esophagus | ESCC | 6.53e-04 | 2.93e-01 | 0.1662 |
| 5165 | PDK3 | P20T-E | Human | Esophagus | ESCC | 7.88e-10 | 2.29e-01 | 0.1124 |
| 5165 | PDK3 | P21T-E | Human | Esophagus | ESCC | 2.34e-03 | 5.94e-02 | 0.1617 |
| 5165 | PDK3 | P22T-E | Human | Esophagus | ESCC | 6.99e-39 | 7.00e-01 | 0.1236 |
| 5165 | PDK3 | P23T-E | Human | Esophagus | ESCC | 2.13e-09 | 2.56e-01 | 0.108 |
| Page: 1 2 3 |
| Tissue | Expression Dynamics | Abbreviation |
| Esophagus | 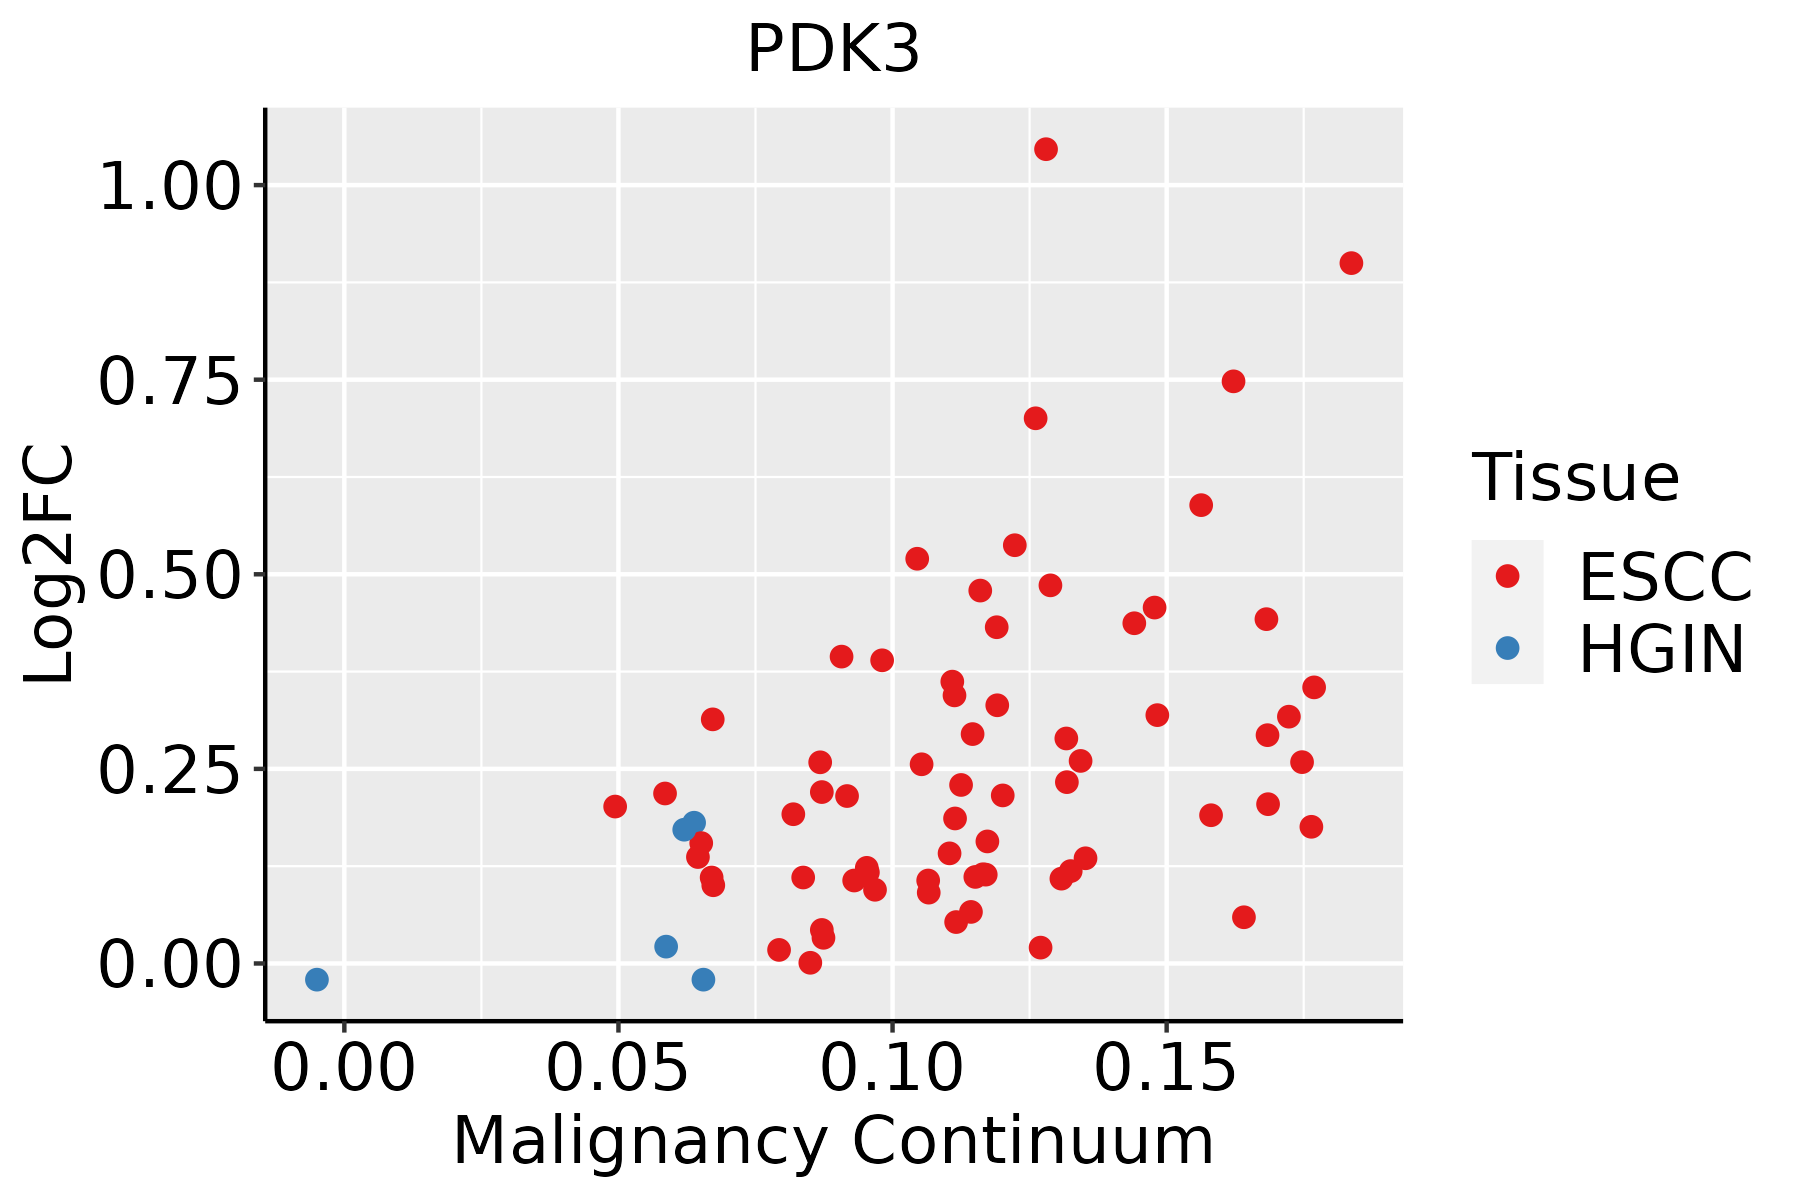 | ESCC: Esophageal squamous cell carcinoma |
| HGIN: High-grade intraepithelial neoplasias | ||
| LGIN: Low-grade intraepithelial neoplasias | ||
| Lung | 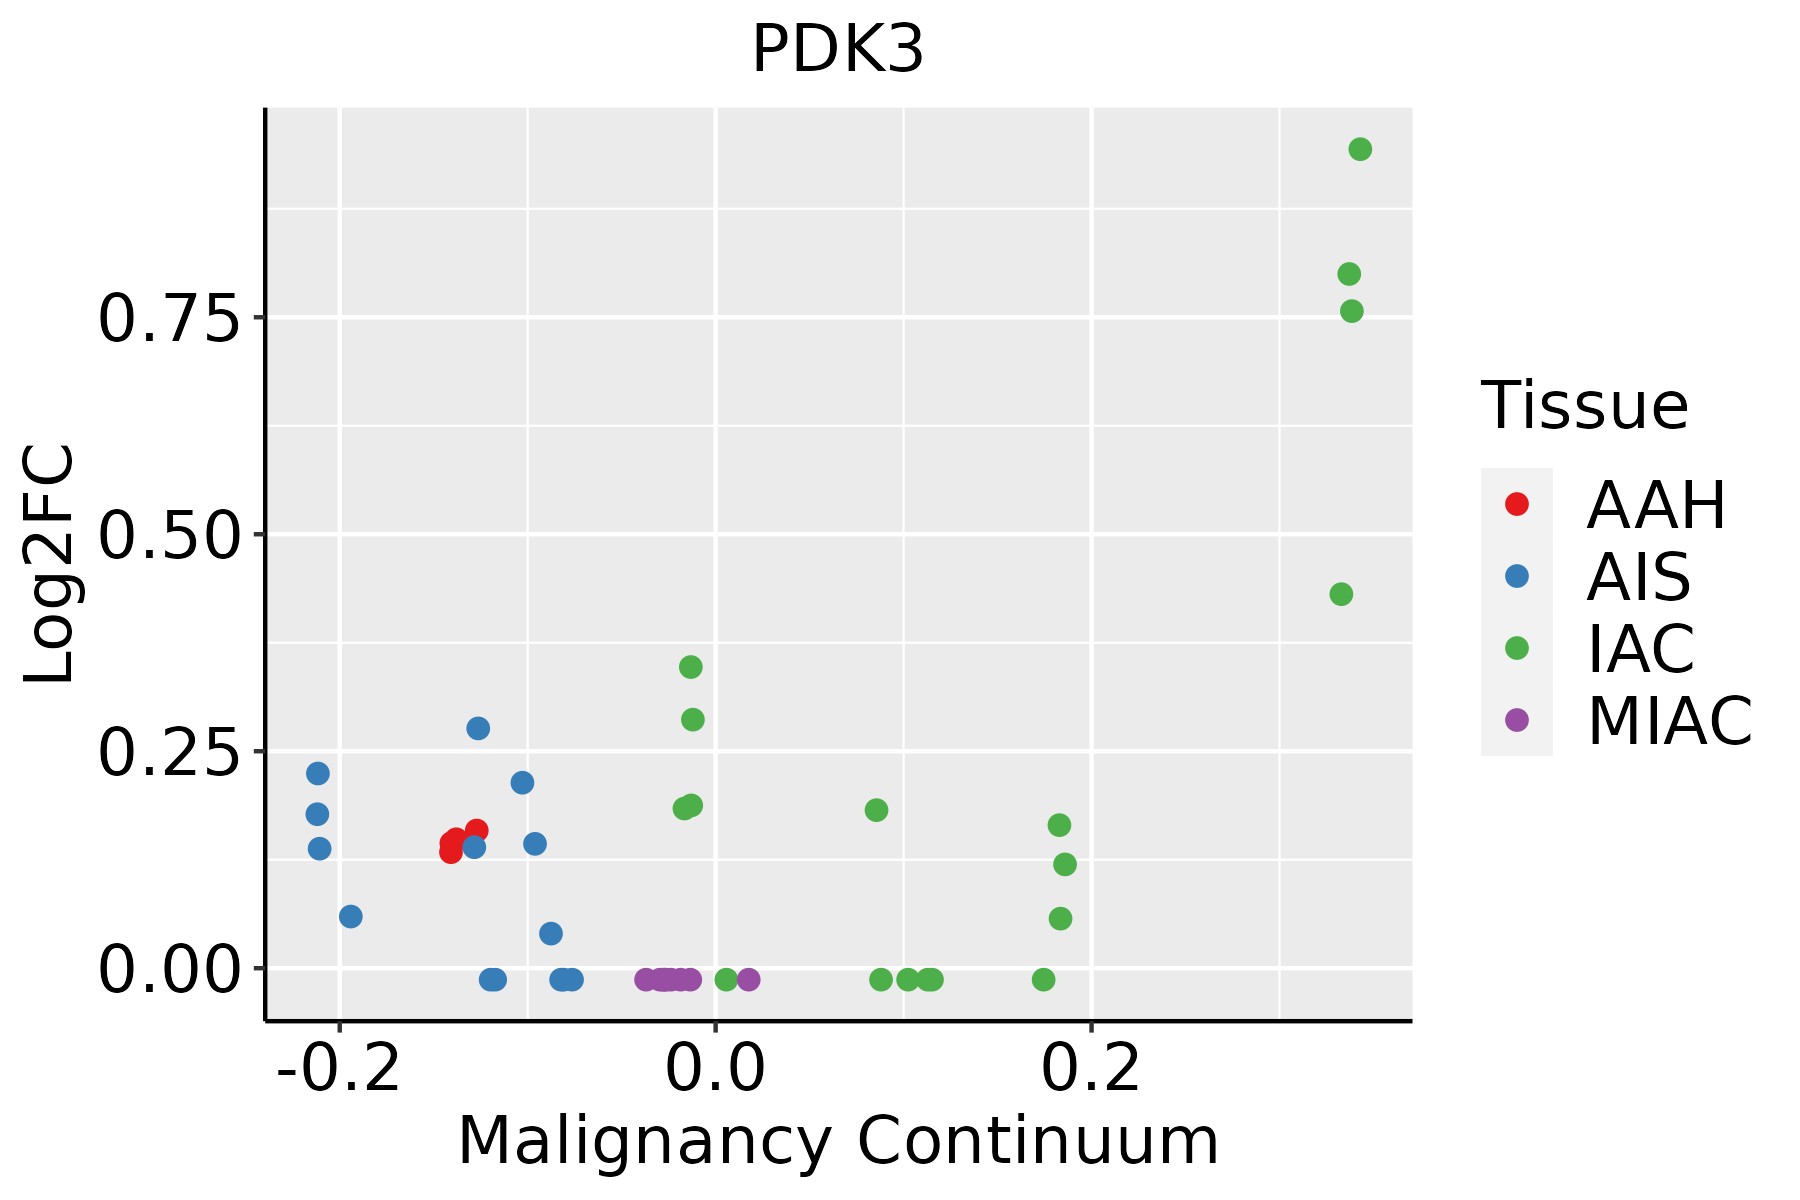 | AAH: Atypical adenomatous hyperplasia |
| AIS: Adenocarcinoma in situ | ||
| IAC: Invasive lung adenocarcinoma | ||
| MIA: Minimally invasive adenocarcinoma |
| ∗log2FC in expression of this searched gene in stem-like cells from each diseased tissue sample relative to stem-like cells in normal samples in each tissue plotted against the malignancy continuum. Samples are colored based on if they are from different disease stage. |
Top |
Malignant transformation related pathway analysis |
| Find out the enriched GO biological processes and KEGG pathways involved in transition from healthy to precancer to cancer |
| Tissue | Disease Stage | Enriched GO biological Processes |
| Colorectum | AD |  |
| Colorectum | SER |  |
| Colorectum | MSS |  |
| Colorectum | MSI-H |  |
| Colorectum | FAP |  |
| ∗Top 15 enriched GO BP terms are showed in the bar plot of each disease state in each tissue. Each row represents a significant GO biological process which is colored according to the -log10(p.adjust). |
| Page: 1 2 3 4 5 6 7 8 9 |
| GO ID | Tissue | Disease Stage | Description | Gene Ratio | Bg Ratio | pvalue | p.adjust | Count |
| GO:0070482111 | Esophagus | ESCC | response to oxygen levels | 218/8552 | 347/18723 | 6.91e-11 | 2.17e-09 | 218 |
| GO:0036293111 | Esophagus | ESCC | response to decreased oxygen levels | 201/8552 | 322/18723 | 8.37e-10 | 2.04e-08 | 201 |
| GO:0030522110 | Esophagus | ESCC | intracellular receptor signaling pathway | 170/8552 | 265/18723 | 8.58e-10 | 2.09e-08 | 170 |
| GO:0001666111 | Esophagus | ESCC | response to hypoxia | 192/8552 | 307/18723 | 1.59e-09 | 3.69e-08 | 192 |
| GO:0006753110 | Esophagus | ESCC | nucleoside phosphate metabolic process | 288/8552 | 497/18723 | 1.80e-08 | 3.50e-07 | 288 |
| GO:0019693111 | Esophagus | ESCC | ribose phosphate metabolic process | 234/8552 | 396/18723 | 4.24e-08 | 7.76e-07 | 234 |
| GO:0009117111 | Esophagus | ESCC | nucleotide metabolic process | 282/8552 | 489/18723 | 4.70e-08 | 8.50e-07 | 282 |
| GO:00059969 | Esophagus | ESCC | monosaccharide metabolic process | 159/8552 | 257/18723 | 1.11e-07 | 1.81e-06 | 159 |
| GO:00193189 | Esophagus | ESCC | hexose metabolic process | 147/8552 | 237/18723 | 2.63e-07 | 3.94e-06 | 147 |
| GO:00067906 | Esophagus | ESCC | sulfur compound metabolic process | 201/8552 | 339/18723 | 2.64e-07 | 3.94e-06 | 201 |
| GO:0071453110 | Esophagus | ESCC | cellular response to oxygen levels | 114/8552 | 177/18723 | 3.63e-07 | 5.06e-06 | 114 |
| GO:0036294110 | Esophagus | ESCC | cellular response to decreased oxygen levels | 105/8552 | 161/18723 | 4.20e-07 | 5.73e-06 | 105 |
| GO:0009259111 | Esophagus | ESCC | ribonucleotide metabolic process | 224/8552 | 385/18723 | 4.41e-07 | 6.00e-06 | 224 |
| GO:0072521111 | Esophagus | ESCC | purine-containing compound metabolic process | 238/8552 | 416/18723 | 1.20e-06 | 1.49e-05 | 238 |
| GO:0009150111 | Esophagus | ESCC | purine ribonucleotide metabolic process | 213/8552 | 368/18723 | 1.40e-06 | 1.69e-05 | 213 |
| GO:0046390110 | Esophagus | ESCC | ribose phosphate biosynthetic process | 119/8552 | 190/18723 | 1.73e-06 | 2.06e-05 | 119 |
| GO:00442725 | Esophagus | ESCC | sulfur compound biosynthetic process | 96/8552 | 148/18723 | 1.86e-06 | 2.16e-05 | 96 |
| GO:0006163111 | Esophagus | ESCC | purine nucleotide metabolic process | 226/8552 | 396/18723 | 2.81e-06 | 3.21e-05 | 226 |
| GO:00182099 | Esophagus | ESCC | peptidyl-serine modification | 196/8552 | 338/18723 | 3.07e-06 | 3.47e-05 | 196 |
| GO:007145616 | Esophagus | ESCC | cellular response to hypoxia | 97/8552 | 151/18723 | 3.12e-06 | 3.51e-05 | 97 |
| Page: 1 2 3 4 |
| Pathway ID | Tissue | Disease Stage | Description | Gene Ratio | Bg Ratio | pvalue | p.adjust | qvalue | Count |
| hsa05415211 | Esophagus | ESCC | Diabetic cardiomyopathy | 146/4205 | 203/8465 | 5.81e-11 | 7.78e-10 | 3.99e-10 | 146 |
| hsa0541538 | Esophagus | ESCC | Diabetic cardiomyopathy | 146/4205 | 203/8465 | 5.81e-11 | 7.78e-10 | 3.99e-10 | 146 |
| hsa0541516 | Lung | IAC | Diabetic cardiomyopathy | 38/1053 | 203/8465 | 6.01e-03 | 2.57e-02 | 1.71e-02 | 38 |
| hsa0541517 | Lung | IAC | Diabetic cardiomyopathy | 38/1053 | 203/8465 | 6.01e-03 | 2.57e-02 | 1.71e-02 | 38 |
| Page: 1 |
Top |
Cell-cell communication analysis |
| Identification of potential cell-cell interactions between two cell types and their ligand-receptor pairs for different disease states |
| Ligand | Receptor | LRpair | Pathway | Tissue | Disease Stage |
| Page: 1 |
Top |
Single-cell gene regulatory network inference analysis |
| Find out the significant the regulons (TFs) and the target genes of each regulon across cell types for different disease states |
| TF | Cell Type | Tissue | Disease Stage | Target Gene | RSS | Regulon Activity |
| ∗The dot plots of a searched regulon are shown for all cell subpopulations in each disease state of each tissue based on the regulon specific score inferred using pySCENIC and by calculating the average expression. |
| Page: 1 |
Top |
Somatic mutation of malignant transformation related genes |
| Annotation of somatic variants for genes involved in malignant transformation |
| Hugo Symbol | Variant Class | Variant Classification | dbSNP RS | HGVSc | HGVSp | HGVSp Short | SWISSPROT | BIOTYPE | SIFT | PolyPhen | Tumor Sample Barcode | Tissue | Histology | Sex | Age | Stage | Therapy Types | Drugs | Outcome |
| PDK3 | insertion | In_Frame_Ins | novel | c.629_630insTAC | p.Gln210delinsHisThr | p.Q210delinsHT | Q15120 | protein_coding | TCGA-AO-A128-01 | Breast | breast invasive carcinoma | Female | <65 | I/II | Chemotherapy | doxorubicin | SD | ||
| PDK3 | insertion | Frame_Shift_Ins | novel | c.630_631insAAAATCAATAAACA | p.Tyr211LysfsTer9 | p.Y211Kfs*9 | Q15120 | protein_coding | TCGA-AO-A128-01 | Breast | breast invasive carcinoma | Female | <65 | I/II | Chemotherapy | doxorubicin | SD | ||
| PDK3 | SNV | Missense_Mutation | c.1133N>A | p.Arg378His | p.R378H | Q15120 | protein_coding | deleterious(0) | possibly_damaging(0.759) | TCGA-2W-A8YY-01 | Cervix | cervical & endocervical cancer | Female | <65 | I/II | Chemotherapy | cisplatin | CR | |
| PDK3 | SNV | Missense_Mutation | rs775948695 | c.1153N>A | p.Glu385Lys | p.E385K | Q15120 | protein_coding | tolerated(0.16) | benign(0.015) | TCGA-EA-A439-01 | Cervix | cervical & endocervical cancer | Female | <65 | I/II | Unknown | Unknown | PD |
| PDK3 | SNV | Missense_Mutation | novel | c.689A>C | p.Lys230Thr | p.K230T | Q15120 | protein_coding | tolerated(0.06) | benign(0.01) | TCGA-AZ-4315-01 | Colorectum | colon adenocarcinoma | Male | <65 | I/II | Unknown | Unknown | SD |
| PDK3 | SNV | Missense_Mutation | novel | c.1219G>A | p.Asp407Asn | p.D407N | Q15120 | protein_coding | tolerated_low_confidence(0.38) | benign(0) | TCGA-AZ-4315-01 | Colorectum | colon adenocarcinoma | Male | <65 | I/II | Unknown | Unknown | SD |
| PDK3 | SNV | Missense_Mutation | c.335N>A | p.Leu112Gln | p.L112Q | Q15120 | protein_coding | deleterious(0) | probably_damaging(0.964) | TCGA-CK-6746-01 | Colorectum | colon adenocarcinoma | Female | >=65 | I/II | Unknown | Unknown | SD | |
| PDK3 | SNV | Missense_Mutation | c.895C>T | p.Arg299Cys | p.R299C | Q15120 | protein_coding | tolerated(0.05) | benign(0.253) | TCGA-AG-A002-01 | Colorectum | rectum adenocarcinoma | Male | <65 | I/II | Unknown | Unknown | SD | |
| PDK3 | SNV | Missense_Mutation | novel | c.838N>T | p.Asp280Tyr | p.D280Y | Q15120 | protein_coding | deleterious(0) | probably_damaging(0.992) | TCGA-F5-6814-01 | Colorectum | rectum adenocarcinoma | Male | <65 | I/II | Unknown | Unknown | SD |
| PDK3 | SNV | Missense_Mutation | c.1238N>T | p.Arg413Ile | p.R413I | Q15120 | protein_coding | deleterious_low_confidence(0.02) | possibly_damaging(0.695) | TCGA-F5-6814-01 | Colorectum | rectum adenocarcinoma | Male | <65 | I/II | Unknown | Unknown | SD |
| Page: 1 2 3 4 5 6 |
Top |
Related drugs of malignant transformation related genes |
| Identification of chemicals and drugs interact with genes involved in malignant transfromation |
| (DGIdb 4.0) |
| Entrez ID | Symbol | Category | Interaction Types | Drug Claim Name | Drug Name | PMIDs |
| 5165 | PDK3 | KINASE, ENZYME, DRUGGABLE GENOME, SERINE THREONINE KINASE | CPI-613 | |||
| 5165 | PDK3 | KINASE, ENZYME, DRUGGABLE GENOME, SERINE THREONINE KINASE | inhibitor | 328083452 |
| Page: 1 |

Copyright 2023-Present -The University of Texas Health Science Center at Houston |