
|
|||||
|
 | |
| |
| |
| |
| |
| |
|
Gene: PDK1 |
Gene summary for PDK1 |
| Gene information | Species | Human | Gene symbol | PDK1 | Gene ID | 5163 |
| Gene name | pyruvate dehydrogenase kinase 1 | |
| Gene Alias | PDK1 | |
| Cytomap | 2q31.1 | |
| Gene Type | protein-coding | GO ID | GO:0001666 | UniProtAcc | Q15118 |
Top |
Malignant transformation analysis |
| Identification of the aberrant gene expression in precancerous and cancerous lesions by comparing the gene expression of stem-like cells in diseased tissues with normal stem cells |
| Entrez ID | Symbol | Replicates | Species | Organ | Tissue | Adj P-value | Log2FC | Malignancy |
| 5163 | PDK1 | LZE4T | Human | Esophagus | ESCC | 1.12e-11 | 3.18e-01 | 0.0811 |
| 5163 | PDK1 | LZE20T | Human | Esophagus | ESCC | 5.83e-04 | 1.38e-01 | 0.0662 |
| 5163 | PDK1 | P2T-E | Human | Esophagus | ESCC | 6.75e-09 | 1.28e-01 | 0.1177 |
| 5163 | PDK1 | P4T-E | Human | Esophagus | ESCC | 3.82e-23 | 7.10e-01 | 0.1323 |
| 5163 | PDK1 | P5T-E | Human | Esophagus | ESCC | 1.10e-17 | 3.47e-01 | 0.1327 |
| 5163 | PDK1 | P9T-E | Human | Esophagus | ESCC | 2.93e-08 | 2.94e-01 | 0.1131 |
| 5163 | PDK1 | P10T-E | Human | Esophagus | ESCC | 6.53e-09 | 2.11e-01 | 0.116 |
| 5163 | PDK1 | P11T-E | Human | Esophagus | ESCC | 1.14e-05 | 2.25e-01 | 0.1426 |
| 5163 | PDK1 | P12T-E | Human | Esophagus | ESCC | 9.33e-07 | 2.76e-01 | 0.1122 |
| 5163 | PDK1 | P15T-E | Human | Esophagus | ESCC | 2.57e-18 | 5.78e-01 | 0.1149 |
| 5163 | PDK1 | P16T-E | Human | Esophagus | ESCC | 1.11e-12 | 3.89e-01 | 0.1153 |
| 5163 | PDK1 | P20T-E | Human | Esophagus | ESCC | 8.25e-11 | 2.29e-01 | 0.1124 |
| 5163 | PDK1 | P21T-E | Human | Esophagus | ESCC | 7.40e-10 | 2.79e-01 | 0.1617 |
| 5163 | PDK1 | P22T-E | Human | Esophagus | ESCC | 1.19e-04 | 1.26e-01 | 0.1236 |
| 5163 | PDK1 | P23T-E | Human | Esophagus | ESCC | 9.78e-08 | 1.73e-01 | 0.108 |
| 5163 | PDK1 | P26T-E | Human | Esophagus | ESCC | 7.65e-15 | 3.32e-01 | 0.1276 |
| 5163 | PDK1 | P27T-E | Human | Esophagus | ESCC | 2.43e-10 | 2.52e-01 | 0.1055 |
| 5163 | PDK1 | P28T-E | Human | Esophagus | ESCC | 1.72e-18 | 4.88e-01 | 0.1149 |
| 5163 | PDK1 | P30T-E | Human | Esophagus | ESCC | 1.07e-03 | 1.49e-01 | 0.137 |
| 5163 | PDK1 | P32T-E | Human | Esophagus | ESCC | 5.84e-15 | 3.42e-01 | 0.1666 |
| Page: 1 2 3 4 |
| Tissue | Expression Dynamics | Abbreviation |
| Esophagus | 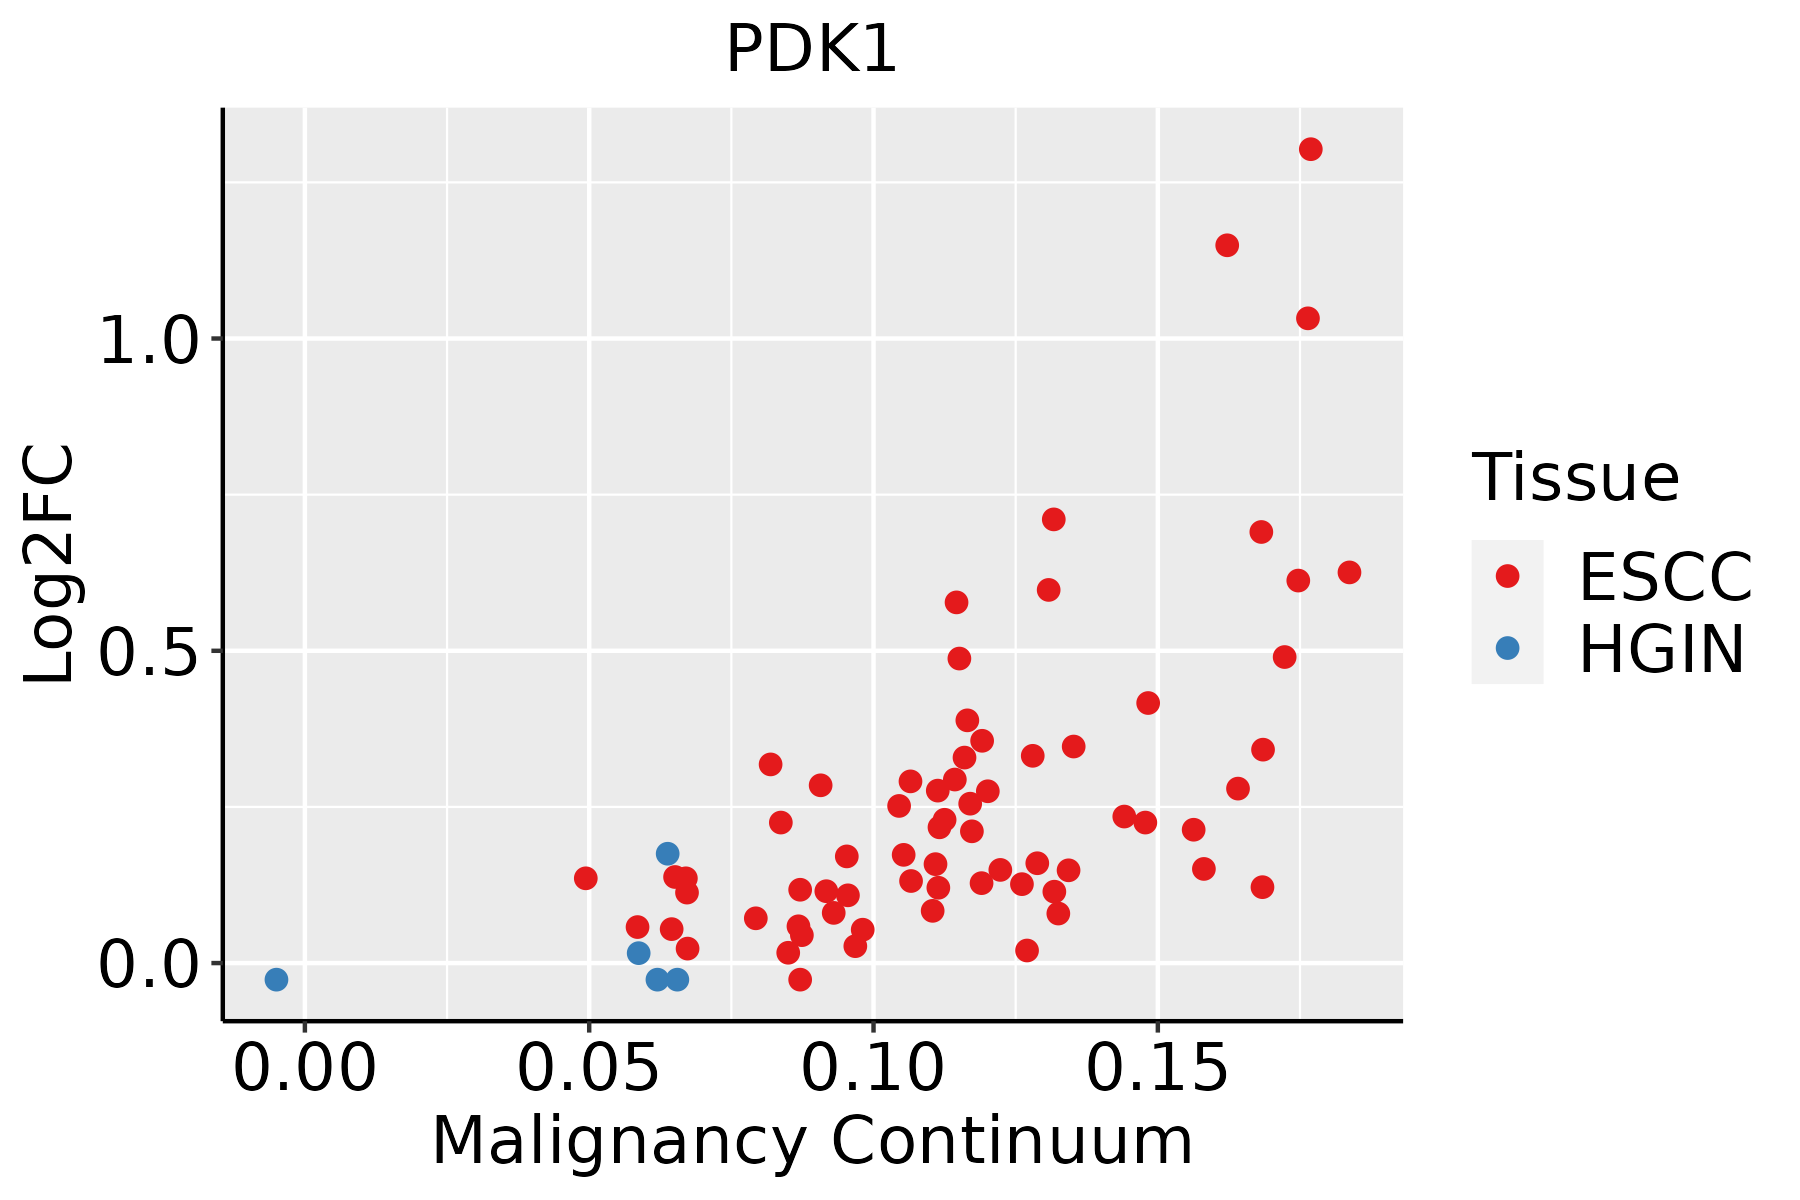 | ESCC: Esophageal squamous cell carcinoma |
| HGIN: High-grade intraepithelial neoplasias | ||
| LGIN: Low-grade intraepithelial neoplasias | ||
| Liver |  | HCC: Hepatocellular carcinoma |
| NAFLD: Non-alcoholic fatty liver disease | ||
| Prostate | 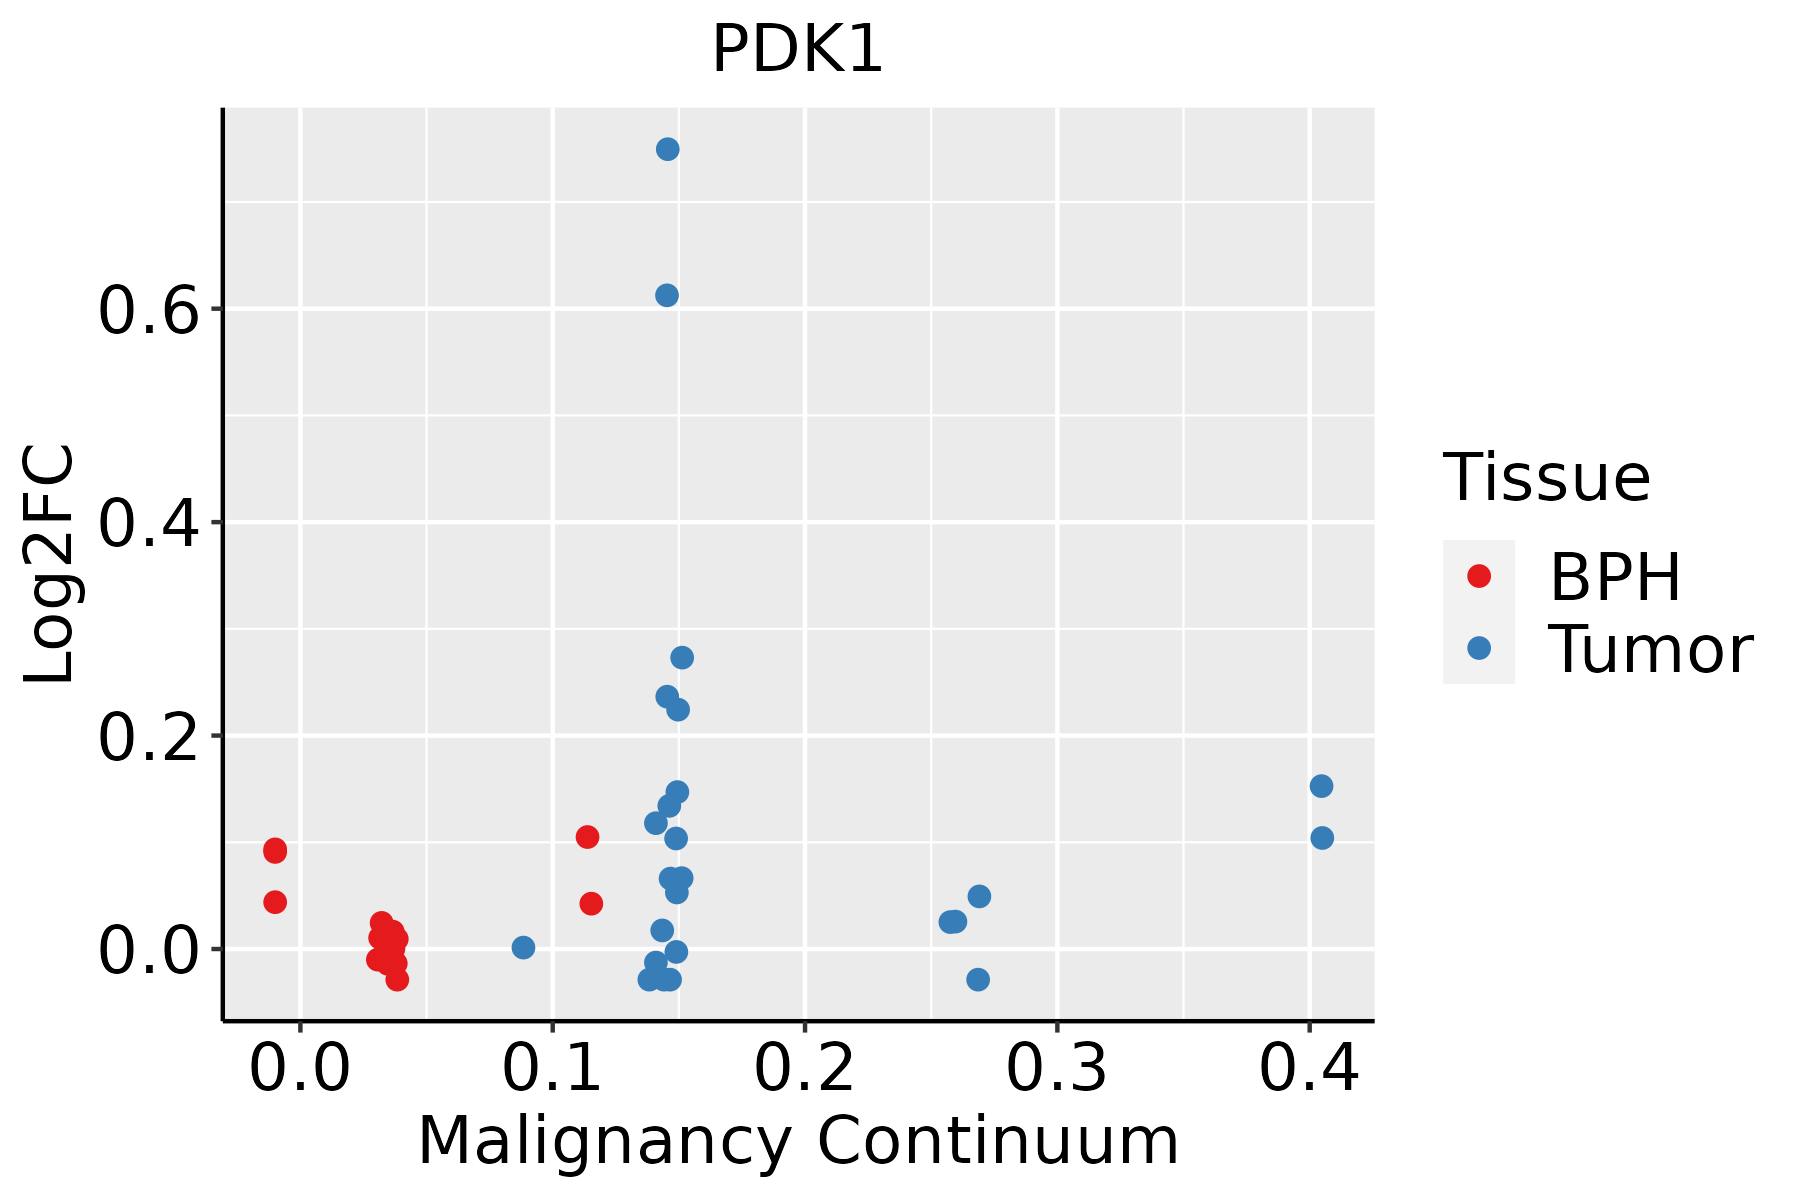 | BPH: Benign Prostatic Hyperplasia |
| Skin | 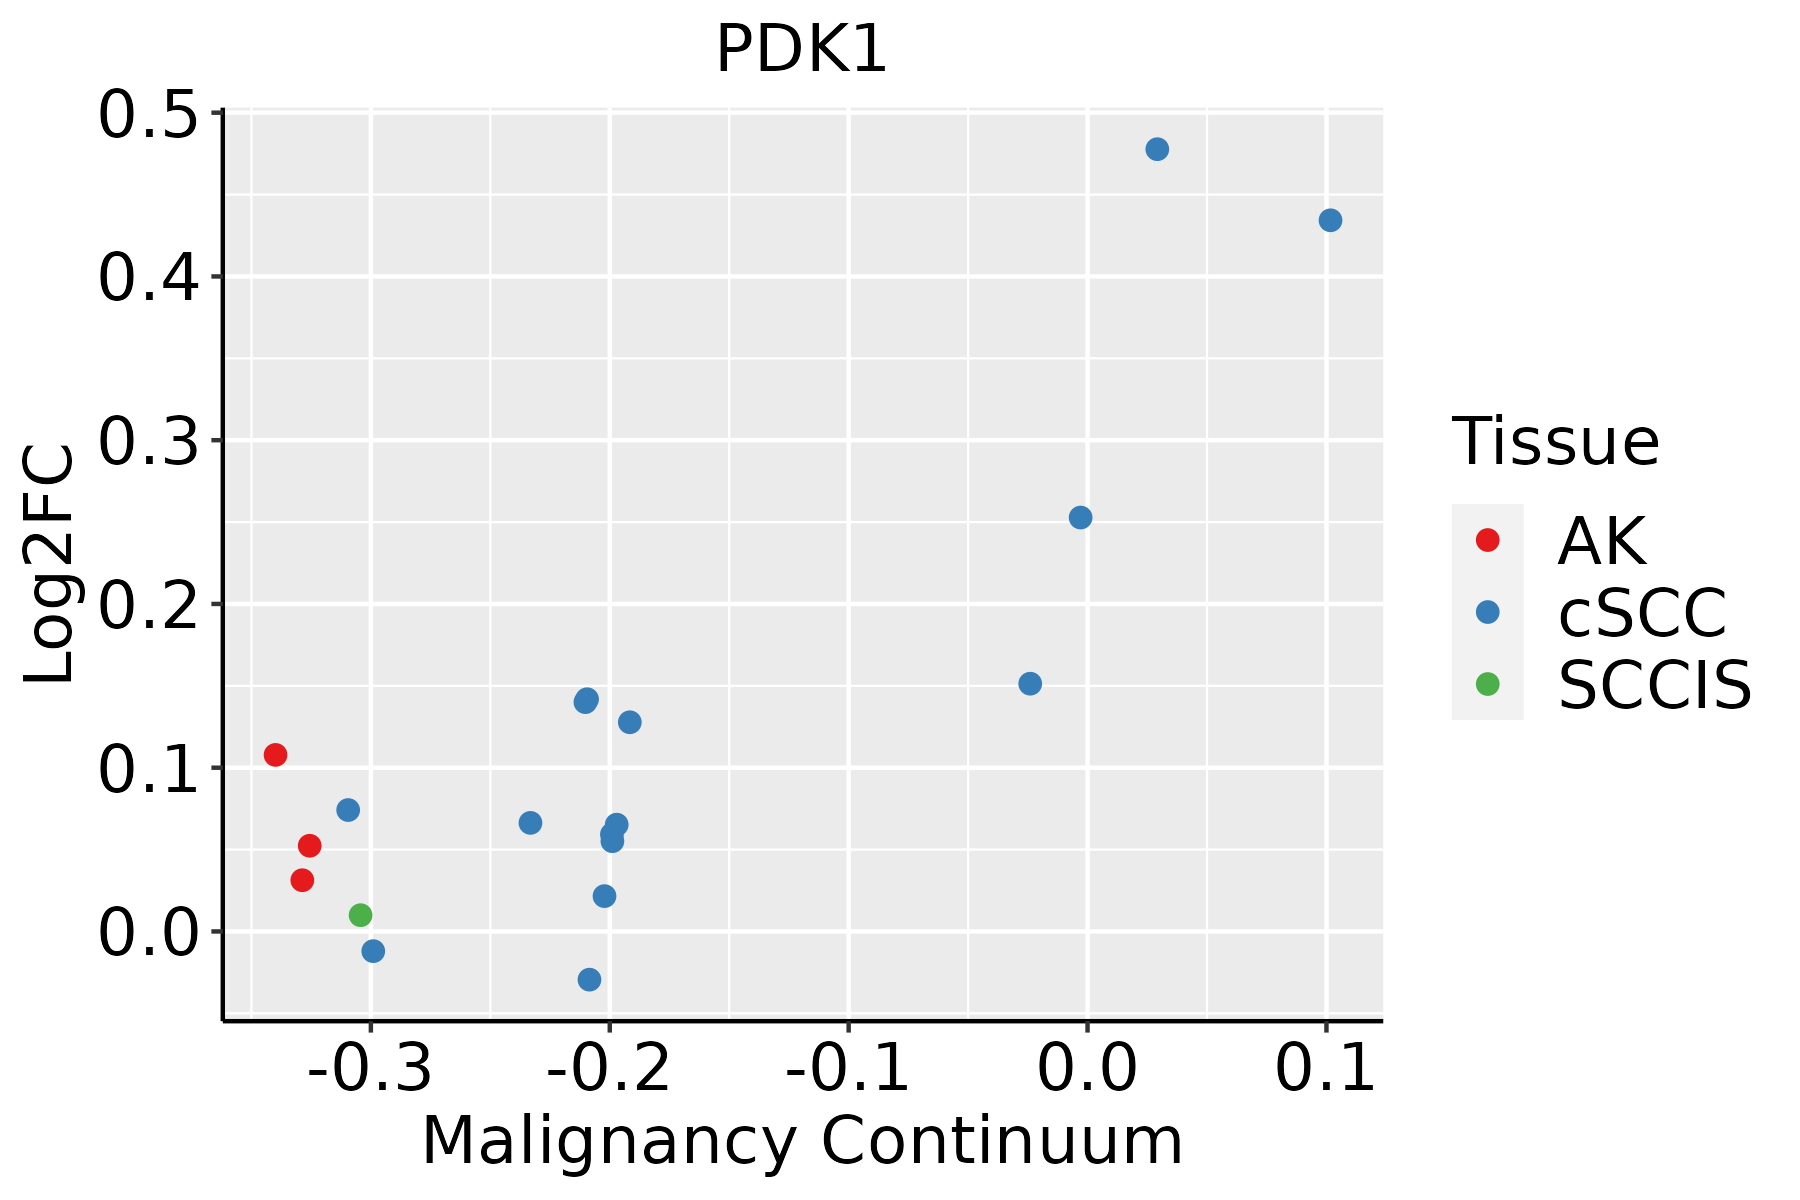 | AK: Actinic keratosis |
| cSCC: Cutaneous squamous cell carcinoma | ||
| SCCIS:squamous cell carcinoma in situ | ||
| Thyroid |  | ATC: Anaplastic thyroid cancer |
| HT: Hashimoto's thyroiditis | ||
| PTC: Papillary thyroid cancer |
| ∗log2FC in expression of this searched gene in stem-like cells from each diseased tissue sample relative to stem-like cells in normal samples in each tissue plotted against the malignancy continuum. Samples are colored based on if they are from different disease stage. |
Top |
Malignant transformation related pathway analysis |
| Find out the enriched GO biological processes and KEGG pathways involved in transition from healthy to precancer to cancer |
| Tissue | Disease Stage | Enriched GO biological Processes |
| Colorectum | AD |  |
| Colorectum | SER |  |
| Colorectum | MSS |  |
| Colorectum | MSI-H |  |
| Colorectum | FAP |  |
| ∗Top 15 enriched GO BP terms are showed in the bar plot of each disease state in each tissue. Each row represents a significant GO biological process which is colored according to the -log10(p.adjust). |
| Page: 1 2 3 4 5 6 7 8 9 |
| GO ID | Tissue | Disease Stage | Description | Gene Ratio | Bg Ratio | pvalue | p.adjust | Count |
| GO:0097193111 | Esophagus | ESCC | intrinsic apoptotic signaling pathway | 222/8552 | 288/18723 | 5.87e-28 | 2.02e-25 | 222 |
| GO:0006979111 | Esophagus | ESCC | response to oxidative stress | 303/8552 | 446/18723 | 7.15e-22 | 1.30e-19 | 303 |
| GO:0062197111 | Esophagus | ESCC | cellular response to chemical stress | 234/8552 | 337/18723 | 5.37e-19 | 5.97e-17 | 234 |
| GO:0034599111 | Esophagus | ESCC | cellular response to oxidative stress | 197/8552 | 288/18723 | 3.76e-15 | 2.15e-13 | 197 |
| GO:0070482111 | Esophagus | ESCC | response to oxygen levels | 218/8552 | 347/18723 | 6.91e-11 | 2.17e-09 | 218 |
| GO:0036293111 | Esophagus | ESCC | response to decreased oxygen levels | 201/8552 | 322/18723 | 8.37e-10 | 2.04e-08 | 201 |
| GO:0001666111 | Esophagus | ESCC | response to hypoxia | 192/8552 | 307/18723 | 1.59e-09 | 3.69e-08 | 192 |
| GO:0006753110 | Esophagus | ESCC | nucleoside phosphate metabolic process | 288/8552 | 497/18723 | 1.80e-08 | 3.50e-07 | 288 |
| GO:0019693111 | Esophagus | ESCC | ribose phosphate metabolic process | 234/8552 | 396/18723 | 4.24e-08 | 7.76e-07 | 234 |
| GO:0009117111 | Esophagus | ESCC | nucleotide metabolic process | 282/8552 | 489/18723 | 4.70e-08 | 8.50e-07 | 282 |
| GO:0008631110 | Esophagus | ESCC | intrinsic apoptotic signaling pathway in response to oxidative stress | 38/8552 | 45/18723 | 8.42e-08 | 1.43e-06 | 38 |
| GO:00059969 | Esophagus | ESCC | monosaccharide metabolic process | 159/8552 | 257/18723 | 1.11e-07 | 1.81e-06 | 159 |
| GO:00193189 | Esophagus | ESCC | hexose metabolic process | 147/8552 | 237/18723 | 2.63e-07 | 3.94e-06 | 147 |
| GO:00067906 | Esophagus | ESCC | sulfur compound metabolic process | 201/8552 | 339/18723 | 2.64e-07 | 3.94e-06 | 201 |
| GO:0071453110 | Esophagus | ESCC | cellular response to oxygen levels | 114/8552 | 177/18723 | 3.63e-07 | 5.06e-06 | 114 |
| GO:0036294110 | Esophagus | ESCC | cellular response to decreased oxygen levels | 105/8552 | 161/18723 | 4.20e-07 | 5.73e-06 | 105 |
| GO:0009259111 | Esophagus | ESCC | ribonucleotide metabolic process | 224/8552 | 385/18723 | 4.41e-07 | 6.00e-06 | 224 |
| GO:0072521111 | Esophagus | ESCC | purine-containing compound metabolic process | 238/8552 | 416/18723 | 1.20e-06 | 1.49e-05 | 238 |
| GO:0009150111 | Esophagus | ESCC | purine ribonucleotide metabolic process | 213/8552 | 368/18723 | 1.40e-06 | 1.69e-05 | 213 |
| GO:0046390110 | Esophagus | ESCC | ribose phosphate biosynthetic process | 119/8552 | 190/18723 | 1.73e-06 | 2.06e-05 | 119 |
| Page: 1 2 3 4 5 6 7 8 9 10 11 12 13 14 15 16 17 |
| Pathway ID | Tissue | Disease Stage | Description | Gene Ratio | Bg Ratio | pvalue | p.adjust | qvalue | Count |
| hsa0406629 | Esophagus | ESCC | HIF-1 signaling pathway | 75/4205 | 109/8465 | 3.66e-05 | 1.68e-04 | 8.60e-05 | 75 |
| hsa0523018 | Esophagus | ESCC | Central carbon metabolism in cancer | 50/4205 | 70/8465 | 1.70e-04 | 6.62e-04 | 3.39e-04 | 50 |
| hsa04066113 | Esophagus | ESCC | HIF-1 signaling pathway | 75/4205 | 109/8465 | 3.66e-05 | 1.68e-04 | 8.60e-05 | 75 |
| hsa0523019 | Esophagus | ESCC | Central carbon metabolism in cancer | 50/4205 | 70/8465 | 1.70e-04 | 6.62e-04 | 3.39e-04 | 50 |
| hsa0406612 | Liver | Cirrhotic | HIF-1 signaling pathway | 46/2530 | 109/8465 | 4.00e-03 | 1.59e-02 | 9.78e-03 | 46 |
| hsa052308 | Liver | Cirrhotic | Central carbon metabolism in cancer | 30/2530 | 70/8465 | 1.41e-02 | 4.35e-02 | 2.68e-02 | 30 |
| hsa0406613 | Liver | Cirrhotic | HIF-1 signaling pathway | 46/2530 | 109/8465 | 4.00e-03 | 1.59e-02 | 9.78e-03 | 46 |
| hsa0523011 | Liver | Cirrhotic | Central carbon metabolism in cancer | 30/2530 | 70/8465 | 1.41e-02 | 4.35e-02 | 2.68e-02 | 30 |
| hsa0406622 | Liver | HCC | HIF-1 signaling pathway | 70/4020 | 109/8465 | 2.96e-04 | 1.36e-03 | 7.57e-04 | 70 |
| hsa0523021 | Liver | HCC | Central carbon metabolism in cancer | 43/4020 | 70/8465 | 1.30e-02 | 3.19e-02 | 1.78e-02 | 43 |
| hsa0406632 | Liver | HCC | HIF-1 signaling pathway | 70/4020 | 109/8465 | 2.96e-04 | 1.36e-03 | 7.57e-04 | 70 |
| hsa0523031 | Liver | HCC | Central carbon metabolism in cancer | 43/4020 | 70/8465 | 1.30e-02 | 3.19e-02 | 1.78e-02 | 43 |
| hsa0406626 | Prostate | Tumor | HIF-1 signaling pathway | 41/1791 | 109/8465 | 5.67e-05 | 4.27e-04 | 2.65e-04 | 41 |
| hsa0523022 | Prostate | Tumor | Central carbon metabolism in cancer | 23/1791 | 70/8465 | 1.50e-02 | 4.47e-02 | 2.77e-02 | 23 |
| hsa0406635 | Prostate | Tumor | HIF-1 signaling pathway | 41/1791 | 109/8465 | 5.67e-05 | 4.27e-04 | 2.65e-04 | 41 |
| hsa0523032 | Prostate | Tumor | Central carbon metabolism in cancer | 23/1791 | 70/8465 | 1.50e-02 | 4.47e-02 | 2.77e-02 | 23 |
| Page: 1 |
Top |
Cell-cell communication analysis |
| Identification of potential cell-cell interactions between two cell types and their ligand-receptor pairs for different disease states |
| Ligand | Receptor | LRpair | Pathway | Tissue | Disease Stage |
| Page: 1 |
Top |
Single-cell gene regulatory network inference analysis |
| Find out the significant the regulons (TFs) and the target genes of each regulon across cell types for different disease states |
| TF | Cell Type | Tissue | Disease Stage | Target Gene | RSS | Regulon Activity |
| ∗The dot plots of a searched regulon are shown for all cell subpopulations in each disease state of each tissue based on the regulon specific score inferred using pySCENIC and by calculating the average expression. |
| Page: 1 |
Top |
Somatic mutation of malignant transformation related genes |
| Annotation of somatic variants for genes involved in malignant transformation |
| Hugo Symbol | Variant Class | Variant Classification | dbSNP RS | HGVSc | HGVSp | HGVSp Short | SWISSPROT | BIOTYPE | SIFT | PolyPhen | Tumor Sample Barcode | Tissue | Histology | Sex | Age | Stage | Therapy Types | Drugs | Outcome |
| PDK1 | SNV | Missense_Mutation | rs756942072 | c.805N>A | p.Glu269Lys | p.E269K | Q15118 | protein_coding | tolerated(0.09) | benign(0.04) | TCGA-AN-A046-01 | Breast | breast invasive carcinoma | Female | >=65 | I/II | Unknown | Unknown | SD |
| PDK1 | SNV | Missense_Mutation | c.244N>C | p.Glu82Gln | p.E82Q | Q15118 | protein_coding | deleterious(0.02) | probably_damaging(0.976) | TCGA-C8-A1HM-01 | Breast | breast invasive carcinoma | Female | >=65 | I/II | Chemotherapy | doxorubicin | CR | |
| PDK1 | SNV | Missense_Mutation | novel | c.319G>A | p.Val107Ile | p.V107I | Q15118 | protein_coding | deleterious(0.01) | benign(0.358) | TCGA-2W-A8YY-01 | Cervix | cervical & endocervical cancer | Female | <65 | I/II | Chemotherapy | cisplatin | CR |
| PDK1 | SNV | Missense_Mutation | c.694N>G | p.His232Asp | p.H232D | Q15118 | protein_coding | deleterious(0.01) | possibly_damaging(0.716) | TCGA-C5-A1BJ-01 | Cervix | cervical & endocervical cancer | Female | <65 | I/II | Unknown | Unknown | SD | |
| PDK1 | SNV | Missense_Mutation | rs775981849 | c.1105N>A | p.Ala369Thr | p.A369T | Q15118 | protein_coding | tolerated(0.49) | benign(0.107) | TCGA-IR-A3LK-01 | Cervix | cervical & endocervical cancer | Female | >=65 | I/II | Chemotherapy | cisplatin | PD |
| PDK1 | SNV | Missense_Mutation | c.1093N>C | p.Glu365Gln | p.E365Q | Q15118 | protein_coding | tolerated(0.14) | possibly_damaging(0.566) | TCGA-Q1-A73O-01 | Cervix | cervical & endocervical cancer | Female | <65 | I/II | Chemotherapy | cisplatin | CR | |
| PDK1 | SNV | Missense_Mutation | c.1144N>C | p.Ser382Pro | p.S382P | Q15118 | protein_coding | deleterious(0.01) | possibly_damaging(0.798) | TCGA-AA-3713-01 | Colorectum | colon adenocarcinoma | Male | >=65 | III/IV | Chemotherapy | 5-fluorouracil | PR | |
| PDK1 | SNV | Missense_Mutation | c.1367N>T | p.Ala456Val | p.A456V | Q15118 | protein_coding | deleterious_low_confidence(0.04) | benign(0.038) | TCGA-AA-A01C-01 | Colorectum | colon adenocarcinoma | Male | >=65 | III/IV | Unknown | Unknown | SD | |
| PDK1 | SNV | Missense_Mutation | novel | c.1345N>T | p.Asp449Tyr | p.D449Y | Q15118 | protein_coding | deleterious(0) | probably_damaging(0.947) | TCGA-AZ-4315-01 | Colorectum | colon adenocarcinoma | Male | <65 | I/II | Unknown | Unknown | SD |
| PDK1 | SNV | Missense_Mutation | c.1277N>A | p.Ala426Asp | p.A426D | Q15118 | protein_coding | deleterious(0) | benign(0.269) | TCGA-CK-6746-01 | Colorectum | colon adenocarcinoma | Female | >=65 | I/II | Unknown | Unknown | SD |
| Page: 1 2 3 4 |
Top |
Related drugs of malignant transformation related genes |
| Identification of chemicals and drugs interact with genes involved in malignant transfromation |
| (DGIdb 4.0) |
| Entrez ID | Symbol | Category | Interaction Types | Drug Claim Name | Drug Name | PMIDs |
| 5163 | PDK1 | CLINICALLY ACTIONABLE, SERINE THREONINE KINASE, KINASE, ENZYME, DRUGGABLE GENOME | Heterocyclic derivative 13 | |||
| 5163 | PDK1 | CLINICALLY ACTIONABLE, SERINE THREONINE KINASE, KINASE, ENZYME, DRUGGABLE GENOME | PMID25684022-Compound-US20120277229 45(1.5) | |||
| 5163 | PDK1 | CLINICALLY ACTIONABLE, SERINE THREONINE KINASE, KINASE, ENZYME, DRUGGABLE GENOME | Pyrido[4,3-d]pyrimidin-5(6H)-one derivative 1 | |||
| 5163 | PDK1 | CLINICALLY ACTIONABLE, SERINE THREONINE KINASE, KINASE, ENZYME, DRUGGABLE GENOME | PMID25684022-Compound-WO2008005457 | |||
| 5163 | PDK1 | CLINICALLY ACTIONABLE, SERINE THREONINE KINASE, KINASE, ENZYME, DRUGGABLE GENOME | PMID25684022-Compound-WO2011137219 37(4-6) | |||
| 5163 | PDK1 | CLINICALLY ACTIONABLE, SERINE THREONINE KINASE, KINASE, ENZYME, DRUGGABLE GENOME | Indolinone derivative 1 | |||
| 5163 | PDK1 | CLINICALLY ACTIONABLE, SERINE THREONINE KINASE, KINASE, ENZYME, DRUGGABLE GENOME | Thiazole carboxamide derivative 16 | |||
| 5163 | PDK1 | CLINICALLY ACTIONABLE, SERINE THREONINE KINASE, KINASE, ENZYME, DRUGGABLE GENOME | PMID25684022-Compound-US20130053382 37(4-6) | |||
| 5163 | PDK1 | CLINICALLY ACTIONABLE, SERINE THREONINE KINASE, KINASE, ENZYME, DRUGGABLE GENOME | 1,2-dihydroindazolo[4,3-bc][1,5]benzoxazepine derivative 1 | |||
| 5163 | PDK1 | CLINICALLY ACTIONABLE, SERINE THREONINE KINASE, KINASE, ENZYME, DRUGGABLE GENOME | Thiazole carboxamide derivative 9 |
| Page: 1 2 3 4 5 6 7 8 9 10 11 |

Copyright 2023-Present -The University of Texas Health Science Center at Houston |