
|
|||||
|
 | |
| |
| |
| |
| |
| |
|
Gene: PDIA6 |
Gene summary for PDIA6 |
| Gene information | Species | Human | Gene symbol | PDIA6 | Gene ID | 10130 |
| Gene name | protein disulfide isomerase family A member 6 | |
| Gene Alias | ERP5 | |
| Cytomap | 2p25.1 | |
| Gene Type | protein-coding | GO ID | GO:0006457 | UniProtAcc | Q15084 |
Top |
Malignant transformation analysis |
| Identification of the aberrant gene expression in precancerous and cancerous lesions by comparing the gene expression of stem-like cells in diseased tissues with normal stem cells |
| Entrez ID | Symbol | Replicates | Species | Organ | Tissue | Adj P-value | Log2FC | Malignancy |
| 10130 | PDIA6 | GSM4909281 | Human | Breast | IDC | 2.50e-22 | 6.06e-01 | 0.21 |
| 10130 | PDIA6 | GSM4909285 | Human | Breast | IDC | 3.42e-40 | 7.61e-01 | 0.21 |
| 10130 | PDIA6 | GSM4909287 | Human | Breast | IDC | 2.53e-07 | 3.38e-01 | 0.2057 |
| 10130 | PDIA6 | GSM4909288 | Human | Breast | IDC | 1.81e-04 | 2.15e-01 | 0.0988 |
| 10130 | PDIA6 | GSM4909294 | Human | Breast | IDC | 2.31e-04 | -2.38e-01 | 0.2022 |
| 10130 | PDIA6 | GSM4909296 | Human | Breast | IDC | 8.05e-18 | -3.54e-01 | 0.1524 |
| 10130 | PDIA6 | GSM4909297 | Human | Breast | IDC | 3.64e-14 | -2.01e-01 | 0.1517 |
| 10130 | PDIA6 | GSM4909298 | Human | Breast | IDC | 9.62e-04 | -2.35e-01 | 0.1551 |
| 10130 | PDIA6 | GSM4909301 | Human | Breast | IDC | 1.75e-04 | -2.11e-01 | 0.1577 |
| 10130 | PDIA6 | GSM4909307 | Human | Breast | IDC | 2.73e-02 | -2.42e-01 | 0.1569 |
| 10130 | PDIA6 | GSM4909311 | Human | Breast | IDC | 7.23e-43 | -3.53e-01 | 0.1534 |
| 10130 | PDIA6 | GSM4909312 | Human | Breast | IDC | 5.10e-17 | 3.09e-04 | 0.1552 |
| 10130 | PDIA6 | GSM4909313 | Human | Breast | IDC | 4.76e-02 | -7.16e-02 | 0.0391 |
| 10130 | PDIA6 | GSM4909316 | Human | Breast | IDC | 6.49e-03 | -3.87e-02 | 0.21 |
| 10130 | PDIA6 | GSM4909317 | Human | Breast | IDC | 4.40e-08 | 3.92e-01 | 0.1355 |
| 10130 | PDIA6 | GSM4909319 | Human | Breast | IDC | 8.08e-47 | -3.67e-01 | 0.1563 |
| 10130 | PDIA6 | GSM4909320 | Human | Breast | IDC | 1.53e-09 | -3.05e-01 | 0.1575 |
| 10130 | PDIA6 | GSM4909321 | Human | Breast | IDC | 2.64e-19 | -1.04e-02 | 0.1559 |
| 10130 | PDIA6 | brca2 | Human | Breast | Precancer | 2.46e-09 | 3.64e-01 | -0.024 |
| 10130 | PDIA6 | M2 | Human | Breast | IDC | 8.13e-07 | 4.40e-02 | 0.21 |
| Page: 1 2 3 4 5 6 7 8 9 10 11 12 13 |
| Tissue | Expression Dynamics | Abbreviation |
| Breast | 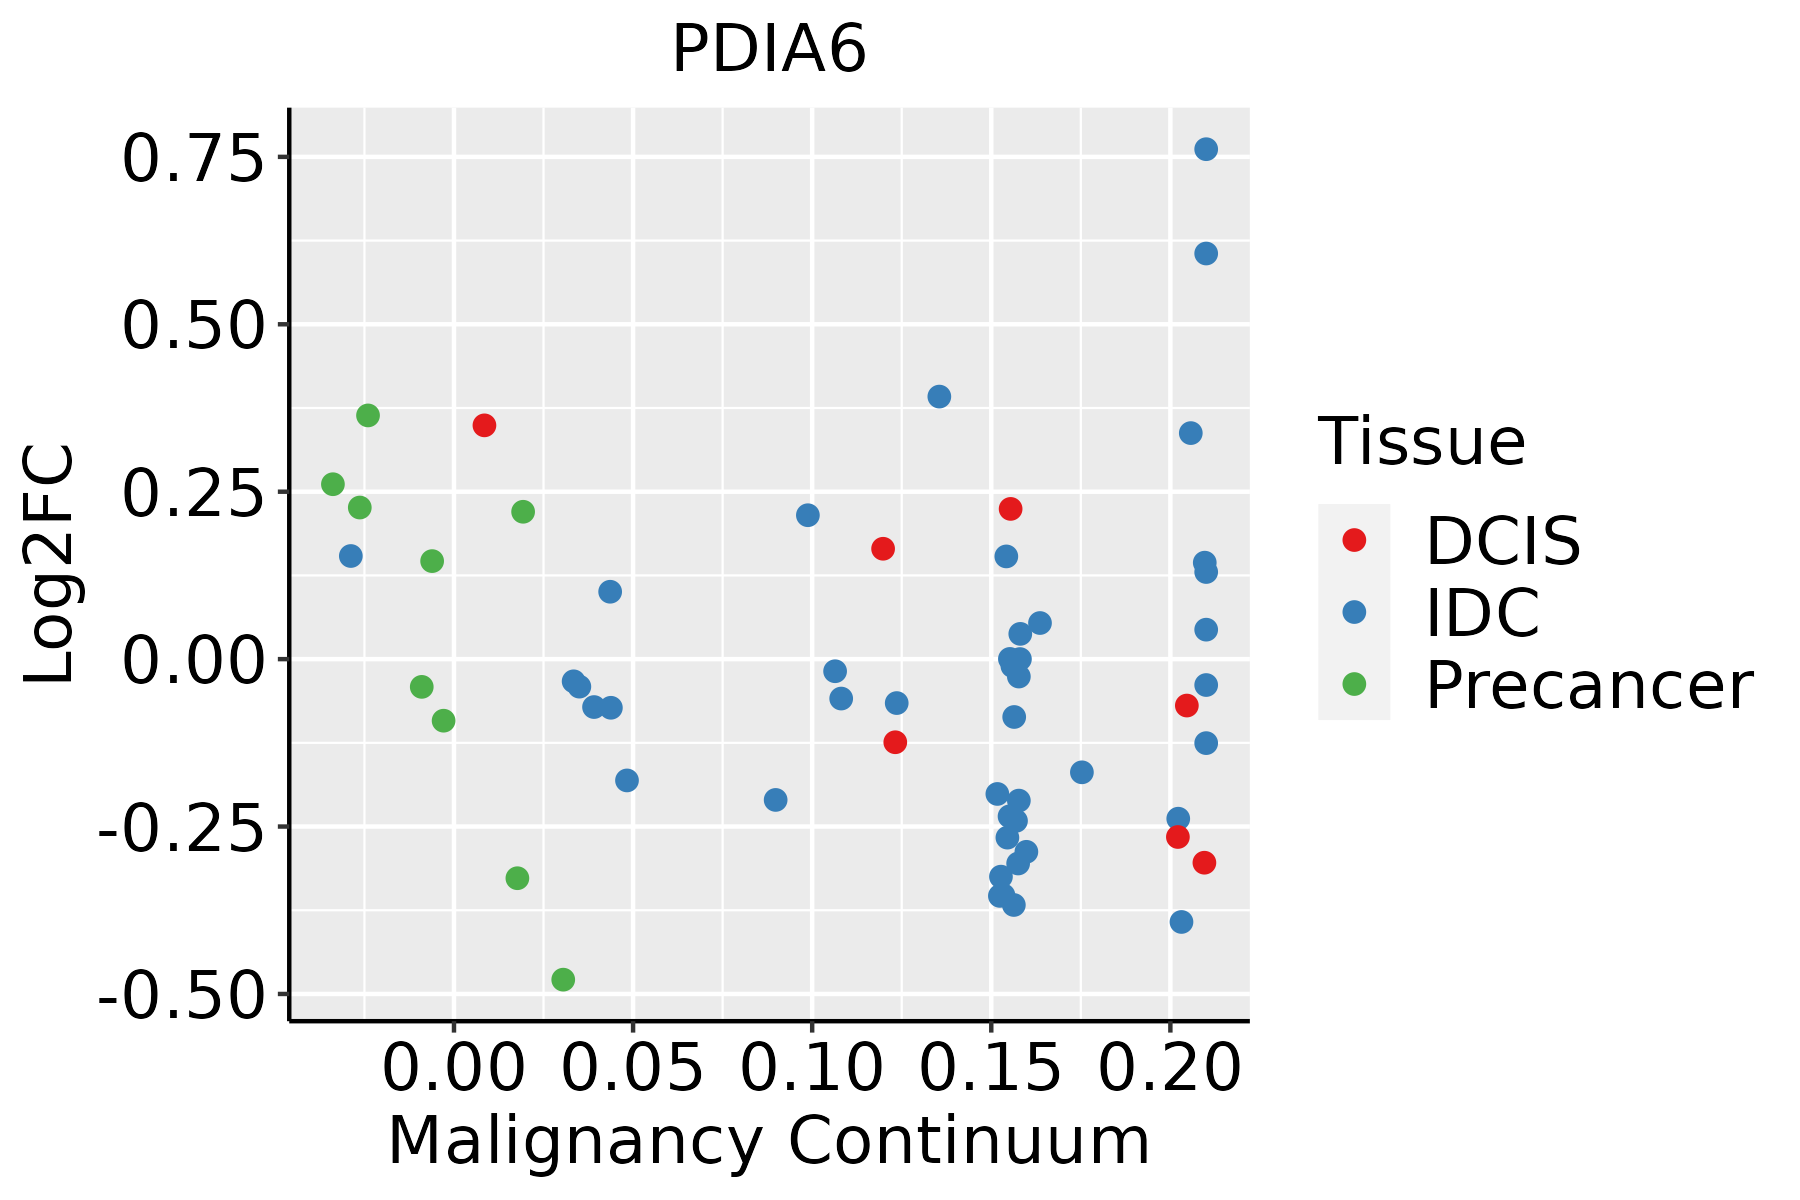 | IDC: Invasive ductal carcinoma |
| DCIS: Ductal carcinoma in situ | ||
| Precancer(BRCA1-mut): Precancerous lesion from BRCA1 mutation carriers | ||
| Cervix |  | CC: Cervix cancer |
| HSIL_HPV: HPV-infected high-grade squamous intraepithelial lesions | ||
| N_HPV: HPV-infected normal cervix | ||
| Endometrium |  | AEH: Atypical endometrial hyperplasia |
| EEC: Endometrioid Cancer | ||
| Esophagus | 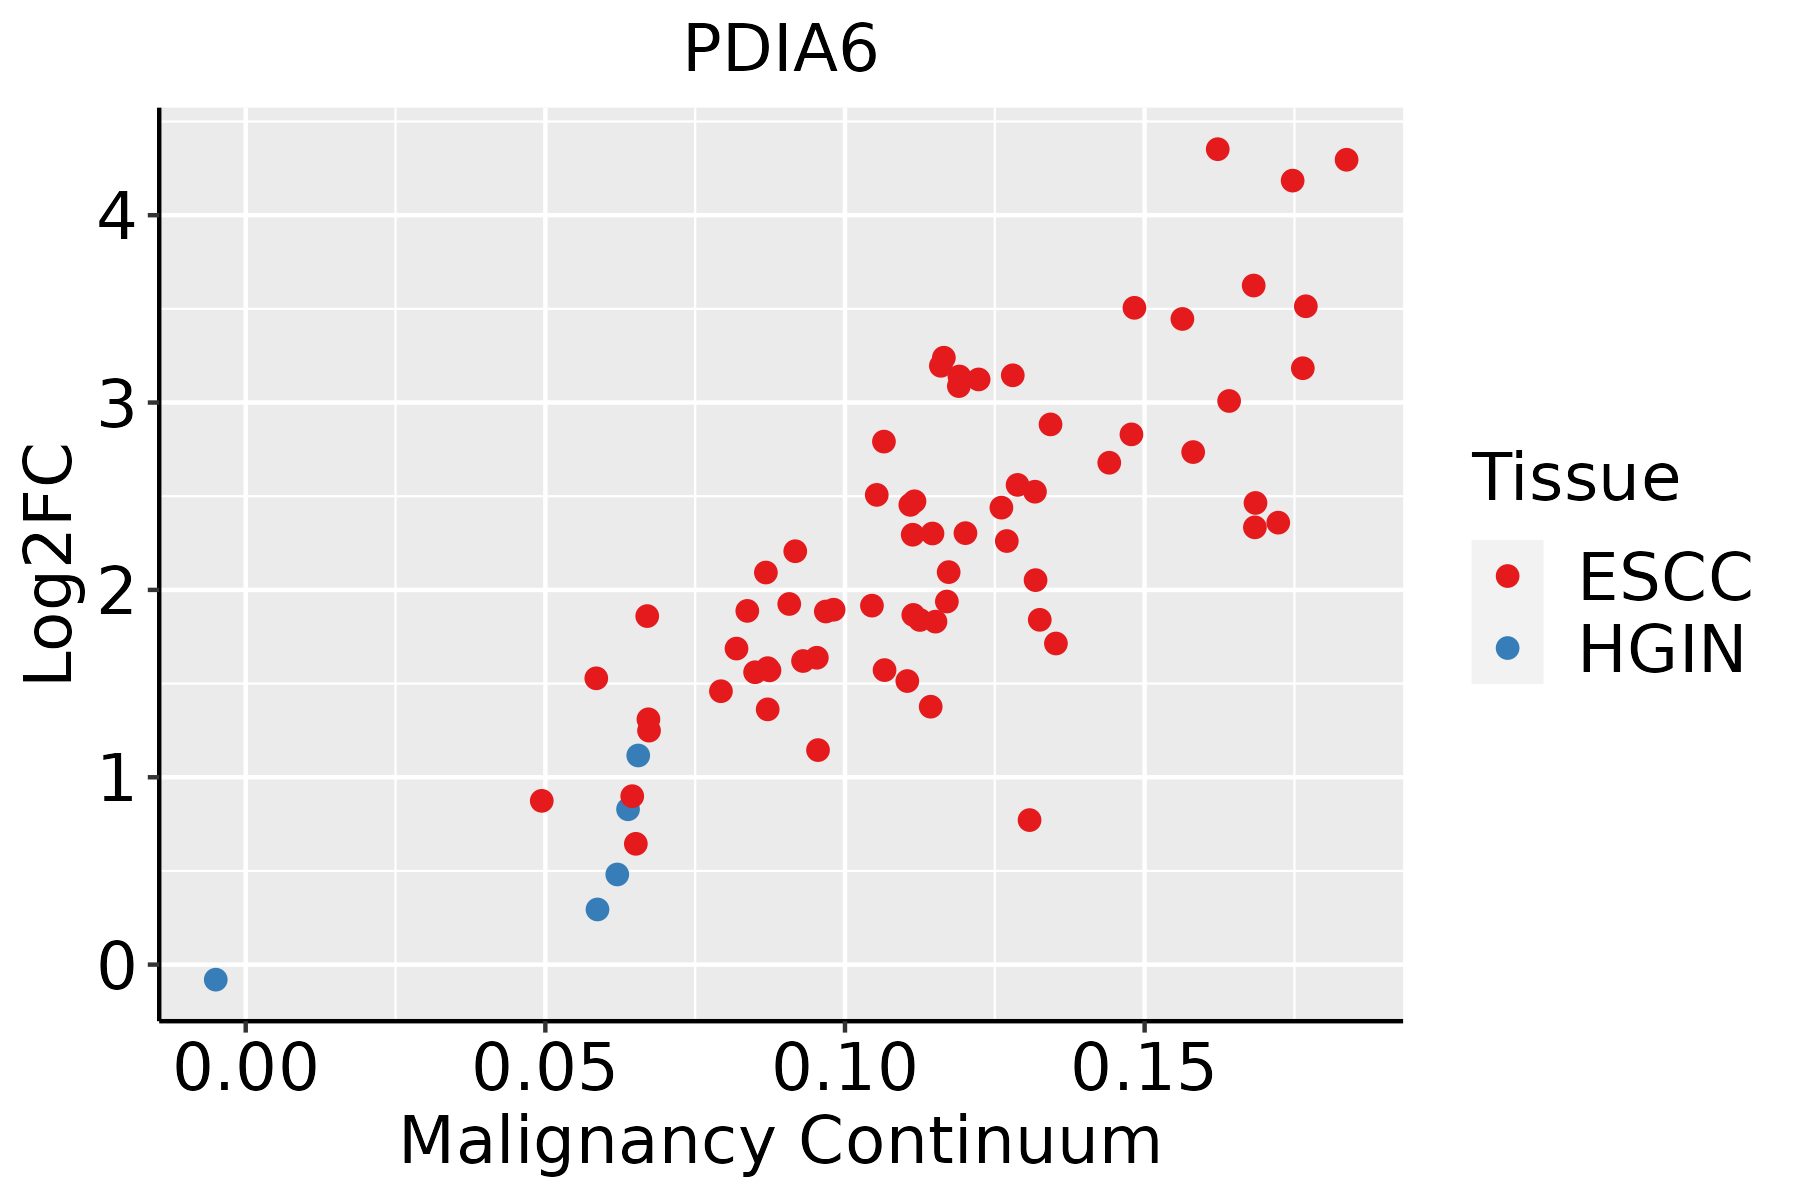 | ESCC: Esophageal squamous cell carcinoma |
| HGIN: High-grade intraepithelial neoplasias | ||
| LGIN: Low-grade intraepithelial neoplasias | ||
| GC | 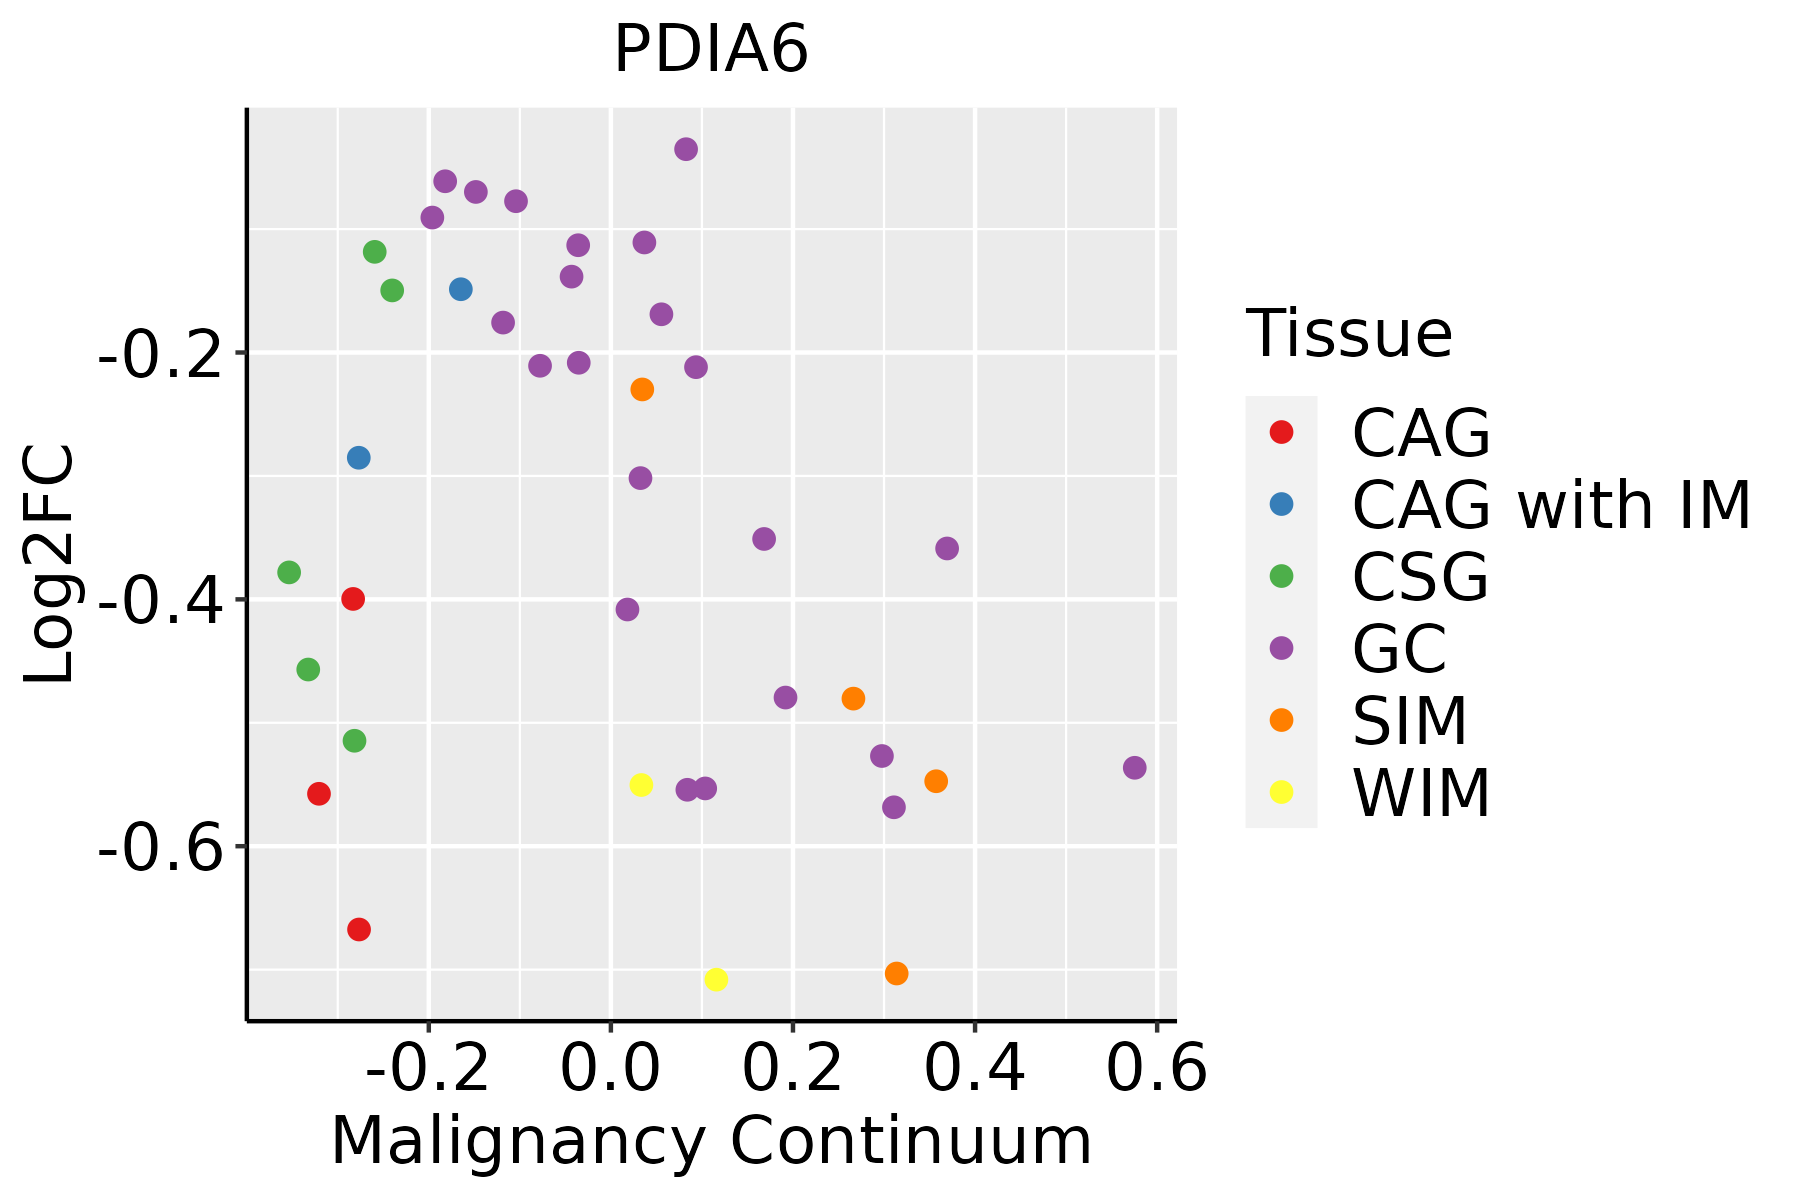 | CAG: Chronic atrophic gastritis |
| CAG with IM: Chronic atrophic gastritis with intestinal metaplasia | ||
| CSG: Chronic superficial gastritis | ||
| GC: Gastric cancer | ||
| SIM: Severe intestinal metaplasia | ||
| WIM: Wild intestinal metaplasia | ||
| Liver | 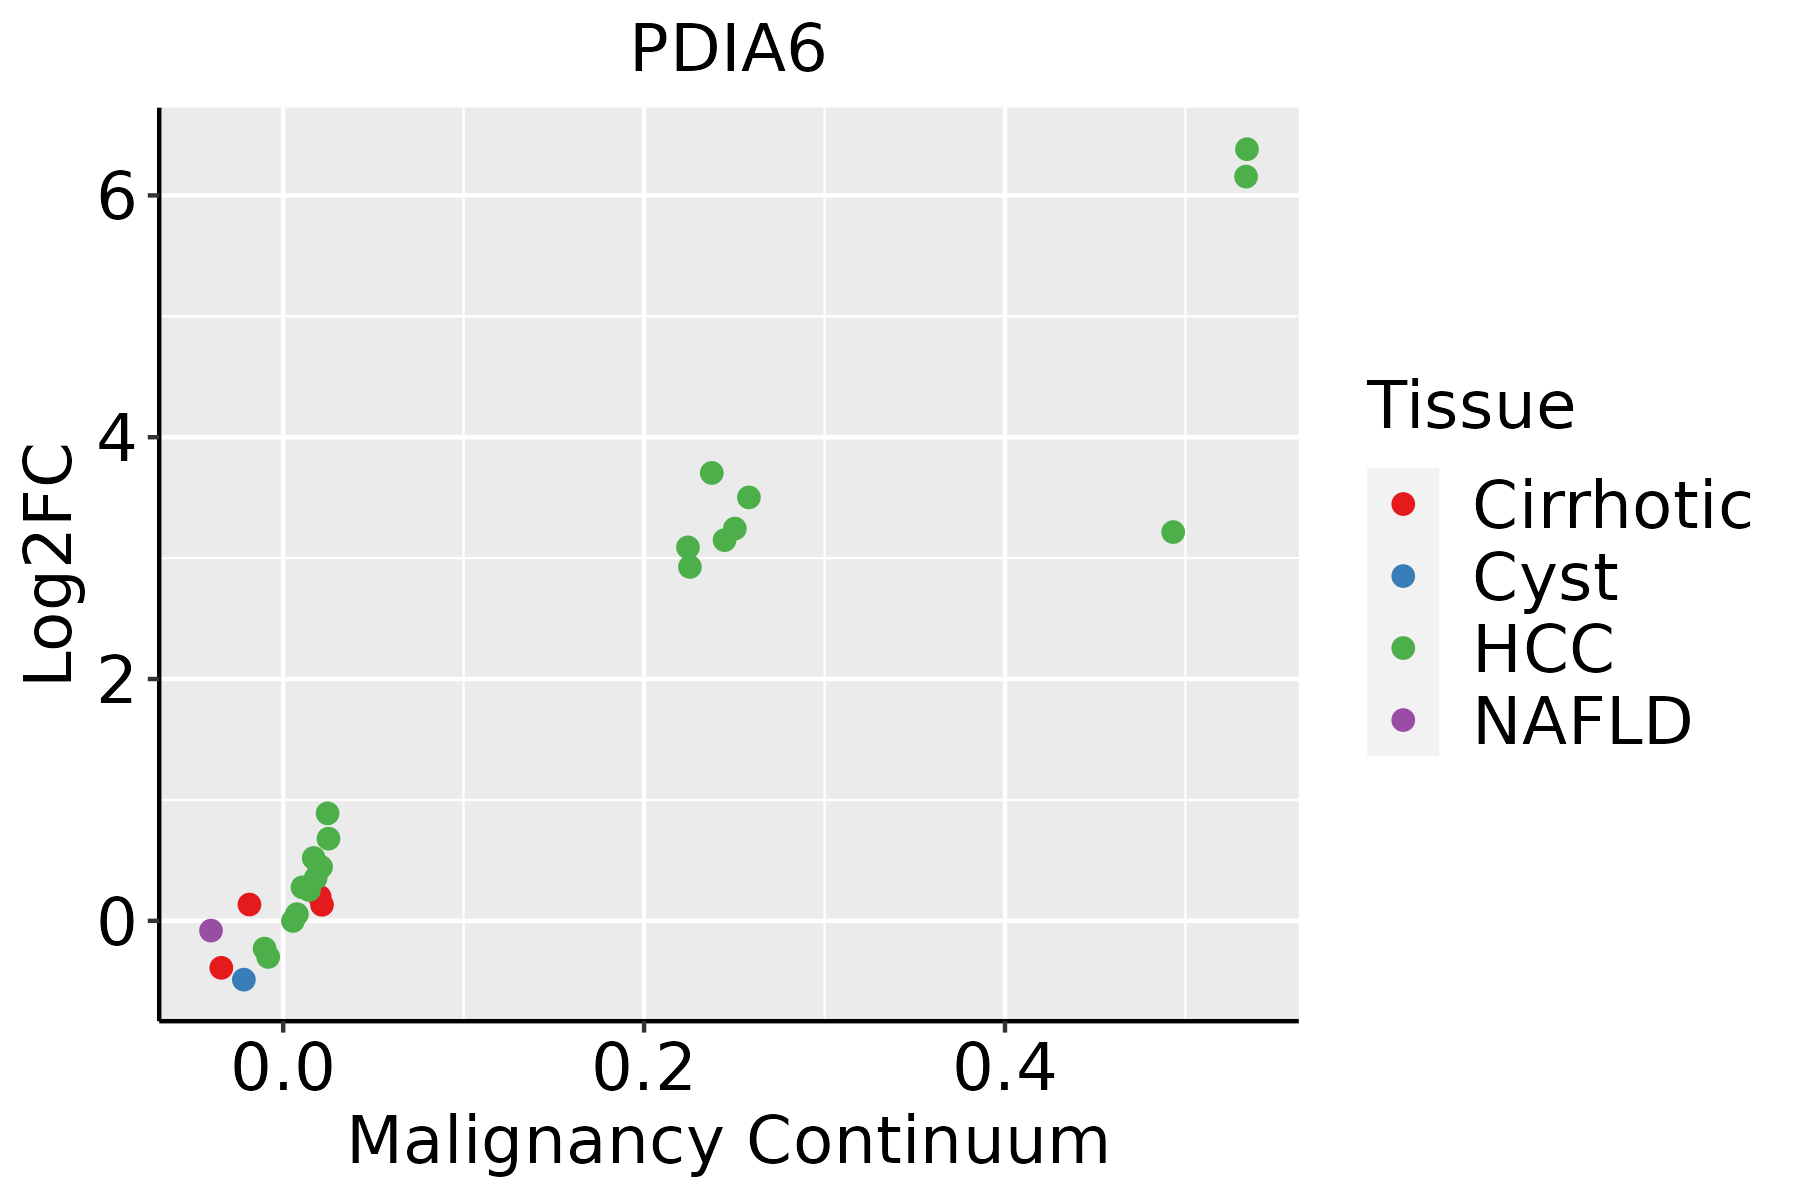 | HCC: Hepatocellular carcinoma |
| NAFLD: Non-alcoholic fatty liver disease | ||
| Oral Cavity |  | EOLP: Erosive Oral lichen planus |
| LP: leukoplakia | ||
| NEOLP: Non-erosive oral lichen planus | ||
| OSCC: Oral squamous cell carcinoma | ||
| Prostate |  | BPH: Benign Prostatic Hyperplasia |
| Skin | 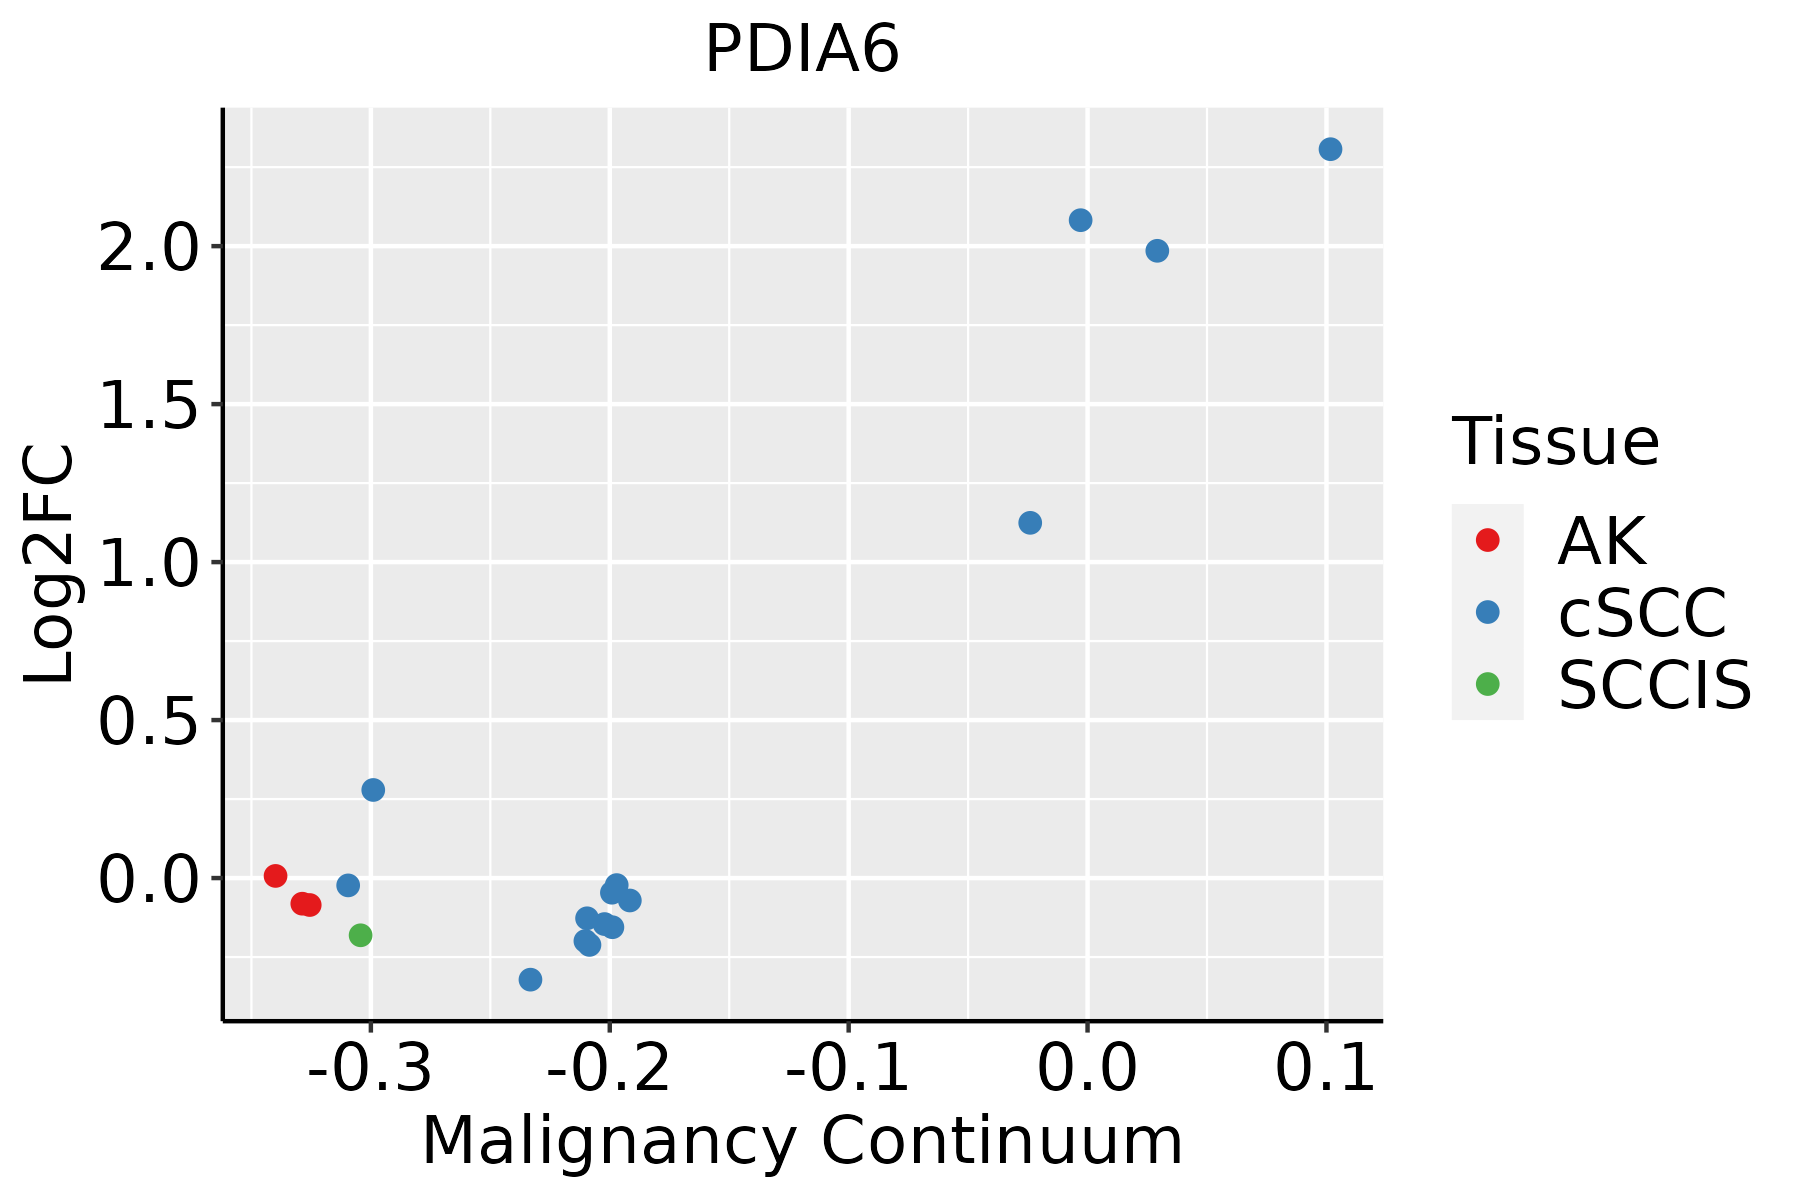 | AK: Actinic keratosis |
| cSCC: Cutaneous squamous cell carcinoma | ||
| SCCIS:squamous cell carcinoma in situ | ||
| Thyroid | 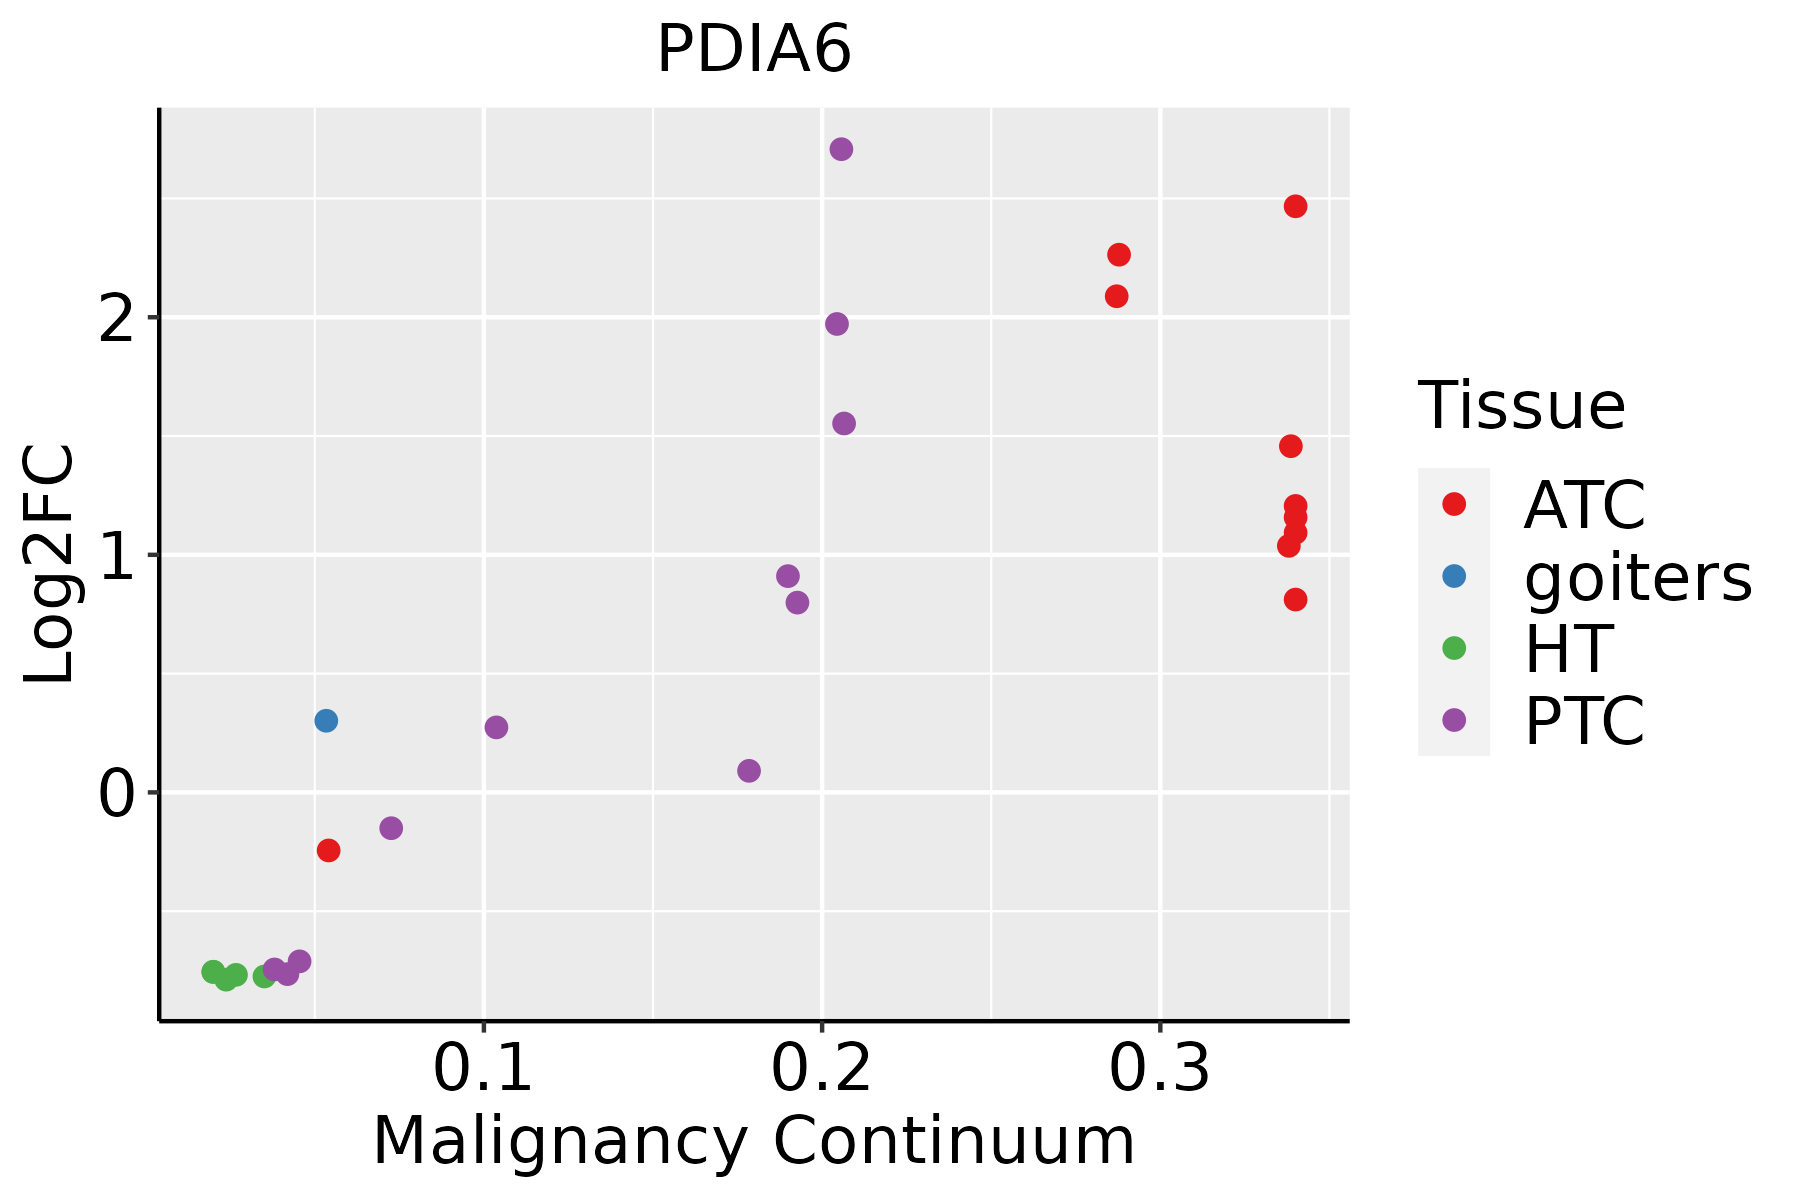 | ATC: Anaplastic thyroid cancer |
| HT: Hashimoto's thyroiditis | ||
| PTC: Papillary thyroid cancer |
| ∗log2FC in expression of this searched gene in stem-like cells from each diseased tissue sample relative to stem-like cells in normal samples in each tissue plotted against the malignancy continuum. Samples are colored based on if they are from different disease stage. |
Top |
Malignant transformation related pathway analysis |
| Find out the enriched GO biological processes and KEGG pathways involved in transition from healthy to precancer to cancer |
| Tissue | Disease Stage | Enriched GO biological Processes |
| Colorectum | AD |  |
| Colorectum | SER |  |
| Colorectum | MSS |  |
| Colorectum | MSI-H |  |
| Colorectum | FAP |  |
| ∗Top 15 enriched GO BP terms are showed in the bar plot of each disease state in each tissue. Each row represents a significant GO biological process which is colored according to the -log10(p.adjust). |
| Page: 1 2 3 4 5 6 7 8 9 |
| GO ID | Tissue | Disease Stage | Description | Gene Ratio | Bg Ratio | pvalue | p.adjust | Count |
| GO:00064578 | Breast | Precancer | protein folding | 43/1080 | 212/18723 | 3.48e-13 | 7.45e-11 | 43 |
| GO:000645713 | Breast | IDC | protein folding | 47/1434 | 212/18723 | 2.31e-11 | 3.86e-09 | 47 |
| GO:000645723 | Breast | DCIS | protein folding | 47/1390 | 212/18723 | 7.84e-12 | 1.53e-09 | 47 |
| GO:00064579 | Cervix | CC | protein folding | 44/2311 | 212/18723 | 3.43e-04 | 3.59e-03 | 44 |
| GO:000645724 | Cervix | N_HPV | protein folding | 22/534 | 212/18723 | 1.90e-07 | 1.57e-05 | 22 |
| GO:000645710 | Endometrium | AEH | protein folding | 61/2100 | 212/18723 | 1.86e-12 | 3.48e-10 | 61 |
| GO:000645715 | Endometrium | EEC | protein folding | 63/2168 | 212/18723 | 6.82e-13 | 1.40e-10 | 63 |
| GO:0006457110 | Esophagus | ESCC | protein folding | 163/8552 | 212/18723 | 1.13e-20 | 1.74e-18 | 163 |
| GO:00064577 | Liver | Cirrhotic | protein folding | 114/4634 | 212/18723 | 9.23e-20 | 2.31e-17 | 114 |
| GO:000645712 | Liver | HCC | protein folding | 160/7958 | 212/18723 | 1.07e-22 | 1.88e-20 | 160 |
| GO:000645722 | Liver | Cyst | protein folding | 18/496 | 212/18723 | 1.48e-05 | 9.59e-04 | 18 |
| GO:000645718 | Oral cavity | OSCC | protein folding | 154/7305 | 212/18723 | 1.89e-23 | 4.60e-21 | 154 |
| GO:000645719 | Oral cavity | LP | protein folding | 125/4623 | 212/18723 | 1.62e-26 | 8.45e-24 | 125 |
| GO:000645725 | Oral cavity | EOLP | protein folding | 59/2218 | 212/18723 | 1.76e-10 | 1.79e-08 | 59 |
| GO:000645716 | Prostate | BPH | protein folding | 85/3107 | 212/18723 | 2.37e-16 | 4.74e-14 | 85 |
| GO:000645717 | Prostate | Tumor | protein folding | 85/3246 | 212/18723 | 3.37e-15 | 5.37e-13 | 85 |
| GO:0006457111 | Skin | cSCC | protein folding | 131/4864 | 212/18723 | 2.96e-28 | 1.32e-25 | 131 |
| GO:00064576 | Stomach | GC | protein folding | 42/1159 | 212/18723 | 1.46e-11 | 3.31e-09 | 42 |
| GO:000645711 | Stomach | CAG with IM | protein folding | 42/1050 | 212/18723 | 5.92e-13 | 2.11e-10 | 42 |
| GO:000645721 | Stomach | CSG | protein folding | 42/1034 | 212/18723 | 3.56e-13 | 1.26e-10 | 42 |
| Page: 1 2 |
| Pathway ID | Tissue | Disease Stage | Description | Gene Ratio | Bg Ratio | pvalue | p.adjust | qvalue | Count |
| hsa0414118 | Breast | Precancer | Protein processing in endoplasmic reticulum | 33/684 | 174/8465 | 2.78e-06 | 3.83e-05 | 2.94e-05 | 33 |
| hsa0414119 | Breast | Precancer | Protein processing in endoplasmic reticulum | 33/684 | 174/8465 | 2.78e-06 | 3.83e-05 | 2.94e-05 | 33 |
| hsa0414124 | Breast | IDC | Protein processing in endoplasmic reticulum | 36/867 | 174/8465 | 2.73e-05 | 2.86e-04 | 2.14e-04 | 36 |
| hsa0414134 | Breast | IDC | Protein processing in endoplasmic reticulum | 36/867 | 174/8465 | 2.73e-05 | 2.86e-04 | 2.14e-04 | 36 |
| hsa0414143 | Breast | DCIS | Protein processing in endoplasmic reticulum | 36/846 | 174/8465 | 1.60e-05 | 1.91e-04 | 1.41e-04 | 36 |
| hsa0414153 | Breast | DCIS | Protein processing in endoplasmic reticulum | 36/846 | 174/8465 | 1.60e-05 | 1.91e-04 | 1.41e-04 | 36 |
| hsa0414120 | Cervix | CC | Protein processing in endoplasmic reticulum | 55/1267 | 174/8465 | 1.74e-08 | 2.68e-07 | 1.58e-07 | 55 |
| hsa04141110 | Cervix | CC | Protein processing in endoplasmic reticulum | 55/1267 | 174/8465 | 1.74e-08 | 2.68e-07 | 1.58e-07 | 55 |
| hsa0414144 | Cervix | N_HPV | Protein processing in endoplasmic reticulum | 21/349 | 174/8465 | 8.84e-06 | 1.09e-04 | 8.55e-05 | 21 |
| hsa0414154 | Cervix | N_HPV | Protein processing in endoplasmic reticulum | 21/349 | 174/8465 | 8.84e-06 | 1.09e-04 | 8.55e-05 | 21 |
| hsa0414126 | Endometrium | AEH | Protein processing in endoplasmic reticulum | 62/1197 | 174/8465 | 5.97e-13 | 1.39e-11 | 1.01e-11 | 62 |
| hsa04141111 | Endometrium | AEH | Protein processing in endoplasmic reticulum | 62/1197 | 174/8465 | 5.97e-13 | 1.39e-11 | 1.01e-11 | 62 |
| hsa0414127 | Endometrium | EEC | Protein processing in endoplasmic reticulum | 64/1237 | 174/8465 | 2.17e-13 | 5.09e-12 | 3.80e-12 | 64 |
| hsa0414136 | Endometrium | EEC | Protein processing in endoplasmic reticulum | 64/1237 | 174/8465 | 2.17e-13 | 5.09e-12 | 3.80e-12 | 64 |
| hsa04141211 | Esophagus | ESCC | Protein processing in endoplasmic reticulum | 147/4205 | 174/8465 | 3.29e-22 | 1.10e-19 | 5.64e-20 | 147 |
| hsa04141310 | Esophagus | ESCC | Protein processing in endoplasmic reticulum | 147/4205 | 174/8465 | 3.29e-22 | 1.10e-19 | 5.64e-20 | 147 |
| hsa0414114 | Liver | Cirrhotic | Protein processing in endoplasmic reticulum | 114/2530 | 174/8465 | 1.16e-22 | 9.67e-21 | 5.96e-21 | 114 |
| hsa0414115 | Liver | Cirrhotic | Protein processing in endoplasmic reticulum | 114/2530 | 174/8465 | 1.16e-22 | 9.67e-21 | 5.96e-21 | 114 |
| hsa0414122 | Liver | HCC | Protein processing in endoplasmic reticulum | 146/4020 | 174/8465 | 7.34e-24 | 2.46e-21 | 1.37e-21 | 146 |
| hsa0414132 | Liver | HCC | Protein processing in endoplasmic reticulum | 146/4020 | 174/8465 | 7.34e-24 | 2.46e-21 | 1.37e-21 | 146 |
| Page: 1 2 3 |
Top |
Cell-cell communication analysis |
| Identification of potential cell-cell interactions between two cell types and their ligand-receptor pairs for different disease states |
| Ligand | Receptor | LRpair | Pathway | Tissue | Disease Stage |
| Page: 1 |
Top |
Single-cell gene regulatory network inference analysis |
| Find out the significant the regulons (TFs) and the target genes of each regulon across cell types for different disease states |
| TF | Cell Type | Tissue | Disease Stage | Target Gene | RSS | Regulon Activity |
| ∗The dot plots of a searched regulon are shown for all cell subpopulations in each disease state of each tissue based on the regulon specific score inferred using pySCENIC and by calculating the average expression. |
| Page: 1 |
Top |
Somatic mutation of malignant transformation related genes |
| Annotation of somatic variants for genes involved in malignant transformation |
| Hugo Symbol | Variant Class | Variant Classification | dbSNP RS | HGVSc | HGVSp | HGVSp Short | SWISSPROT | BIOTYPE | SIFT | PolyPhen | Tumor Sample Barcode | Tissue | Histology | Sex | Age | Stage | Therapy Types | Drugs | Outcome |
| PDIA6 | SNV | Missense_Mutation | novel | c.70C>T | p.Arg24Cys | p.R24C | Q15084 | protein_coding | deleterious_low_confidence(0) | benign(0) | TCGA-2W-A8YY-01 | Cervix | cervical & endocervical cancer | Female | <65 | I/II | Chemotherapy | cisplatin | CR |
| PDIA6 | SNV | Missense_Mutation | novel | c.136N>G | p.Pro46Ala | p.P46A | Q15084 | protein_coding | tolerated_low_confidence(0.28) | benign(0) | TCGA-FU-A40J-01 | Cervix | cervical & endocervical cancer | Female | <65 | III/IV | Chemotherapy | carboplatin | CR |
| PDIA6 | SNV | Missense_Mutation | rs373388851 | c.713A>G | p.Tyr238Cys | p.Y238C | Q15084 | protein_coding | deleterious(0) | probably_damaging(0.984) | TCGA-VS-A8QA-01 | Cervix | cervical & endocervical cancer | Female | <65 | I/II | Unknown | Unknown | SD |
| PDIA6 | SNV | Missense_Mutation | c.788N>T | p.Thr263Met | p.T263M | Q15084 | protein_coding | tolerated(0.2) | probably_damaging(0.93) | TCGA-AA-3715-01 | Colorectum | colon adenocarcinoma | Male | >=65 | I/II | Unknown | Unknown | PD | |
| PDIA6 | SNV | Missense_Mutation | novel | c.241G>A | p.Glu81Lys | p.E81K | Q15084 | protein_coding | tolerated(0.1) | benign(0.17) | TCGA-AA-3984-01 | Colorectum | colon adenocarcinoma | Female | <65 | I/II | Unknown | Unknown | SD |
| PDIA6 | SNV | Missense_Mutation | c.458T>C | p.Ile153Thr | p.I153T | Q15084 | protein_coding | deleterious(0) | probably_damaging(1) | TCGA-AD-6895-01 | Colorectum | colon adenocarcinoma | Male | >=65 | III/IV | Unknown | Unknown | SD | |
| PDIA6 | SNV | Missense_Mutation | rs775783522 | c.581N>A | p.Arg194Gln | p.R194Q | Q15084 | protein_coding | tolerated(0.06) | benign(0.065) | TCGA-D5-6928-01 | Colorectum | colon adenocarcinoma | Male | >=65 | I/II | Unknown | Unknown | SD |
| PDIA6 | SNV | Missense_Mutation | c.541N>G | p.Ser181Gly | p.S181G | Q15084 | protein_coding | tolerated(0.2) | benign(0.044) | TCGA-DM-A1HB-01 | Colorectum | colon adenocarcinoma | Male | >=65 | III/IV | Unknown | Unknown | SD | |
| PDIA6 | SNV | Missense_Mutation | rs138012463 | c.1249C>T | p.Arg417Cys | p.R417C | Q15084 | protein_coding | deleterious(0) | probably_damaging(0.921) | TCGA-F4-6856-01 | Colorectum | colon adenocarcinoma | Male | <65 | I/II | Ancillary | leucovorin | CR |
| PDIA6 | SNV | Missense_Mutation | c.707N>C | p.Glu236Ala | p.E236A | Q15084 | protein_coding | tolerated(0.05) | probably_damaging(0.991) | TCGA-WS-AB45-01 | Colorectum | colon adenocarcinoma | Female | <65 | I/II | Unknown | Unknown | SD |
| Page: 1 2 3 4 5 |
Top |
Related drugs of malignant transformation related genes |
| Identification of chemicals and drugs interact with genes involved in malignant transfromation |
| (DGIdb 4.0) |
| Entrez ID | Symbol | Category | Interaction Types | Drug Claim Name | Drug Name | PMIDs |
| Page: 1 |

Copyright 2023-Present -The University of Texas Health Science Center at Houston |