
|
|||||
|
 | |
| |
| |
| |
| |
| |
|
Gene: PDHA1 |
Gene summary for PDHA1 |
| Gene information | Species | Human | Gene symbol | PDHA1 | Gene ID | 5160 |
| Gene name | pyruvate dehydrogenase E1 subunit alpha 1 | |
| Gene Alias | PDHA | |
| Cytomap | Xp22.12 | |
| Gene Type | protein-coding | GO ID | GO:0005975 | UniProtAcc | A0A024RBX9 |
Top |
Malignant transformation analysis |
| Identification of the aberrant gene expression in precancerous and cancerous lesions by comparing the gene expression of stem-like cells in diseased tissues with normal stem cells |
| Entrez ID | Symbol | Replicates | Species | Organ | Tissue | Adj P-value | Log2FC | Malignancy |
| 5160 | PDHA1 | HTA11_347_2000001011 | Human | Colorectum | AD | 7.92e-06 | 4.27e-01 | -0.1954 |
| 5160 | PDHA1 | HTA11_83_2000001011 | Human | Colorectum | SER | 7.37e-05 | 5.83e-01 | -0.1526 |
| 5160 | PDHA1 | HTA11_1391_2000001011 | Human | Colorectum | AD | 5.72e-07 | 6.02e-01 | -0.059 |
| 5160 | PDHA1 | HTA11_866_3004761011 | Human | Colorectum | AD | 4.70e-02 | 3.12e-01 | 0.096 |
| 5160 | PDHA1 | HTA11_7696_3000711011 | Human | Colorectum | AD | 4.10e-13 | 5.50e-01 | 0.0674 |
| 5160 | PDHA1 | HTA11_99999965104_69814 | Human | Colorectum | MSS | 1.77e-06 | 4.93e-01 | 0.281 |
| 5160 | PDHA1 | HTA11_99999971662_82457 | Human | Colorectum | MSS | 7.06e-15 | 6.93e-01 | 0.3859 |
| 5160 | PDHA1 | HTA11_99999973899_84307 | Human | Colorectum | MSS | 2.18e-02 | 5.41e-01 | 0.2585 |
| 5160 | PDHA1 | A015-C-203 | Human | Colorectum | FAP | 1.27e-04 | -6.87e-02 | -0.1294 |
| 5160 | PDHA1 | A001-C-119 | Human | Colorectum | FAP | 2.20e-03 | -2.53e-01 | -0.1557 |
| 5160 | PDHA1 | A001-C-108 | Human | Colorectum | FAP | 6.65e-05 | -1.27e-01 | -0.0272 |
| 5160 | PDHA1 | A002-C-205 | Human | Colorectum | FAP | 2.09e-05 | -1.90e-01 | -0.1236 |
| 5160 | PDHA1 | A015-C-006 | Human | Colorectum | FAP | 4.03e-04 | -2.30e-01 | -0.0994 |
| 5160 | PDHA1 | A002-C-114 | Human | Colorectum | FAP | 2.66e-03 | -1.15e-01 | -0.1561 |
| 5160 | PDHA1 | A015-C-104 | Human | Colorectum | FAP | 1.32e-06 | -1.10e-01 | -0.1899 |
| 5160 | PDHA1 | A001-C-014 | Human | Colorectum | FAP | 3.59e-06 | -1.94e-01 | 0.0135 |
| 5160 | PDHA1 | A002-C-116 | Human | Colorectum | FAP | 7.41e-08 | -2.11e-01 | -0.0452 |
| 5160 | PDHA1 | A018-E-020 | Human | Colorectum | FAP | 6.16e-04 | -2.38e-02 | -0.2034 |
| 5160 | PDHA1 | F034 | Human | Colorectum | FAP | 2.84e-02 | -1.14e-01 | -0.0665 |
| 5160 | PDHA1 | F072B | Human | Colorectum | FAP | 8.37e-03 | -1.64e-01 | 0.257 |
| Page: 1 2 3 4 5 6 7 8 |
| Tissue | Expression Dynamics | Abbreviation |
| Colorectum (GSE201348) |  | FAP: Familial adenomatous polyposis |
| CRC: Colorectal cancer | ||
| Colorectum (HTA11) |  | AD: Adenomas |
| SER: Sessile serrated lesions | ||
| MSI-H: Microsatellite-high colorectal cancer | ||
| MSS: Microsatellite stable colorectal cancer | ||
| Esophagus |  | ESCC: Esophageal squamous cell carcinoma |
| HGIN: High-grade intraepithelial neoplasias | ||
| LGIN: Low-grade intraepithelial neoplasias | ||
| Liver | 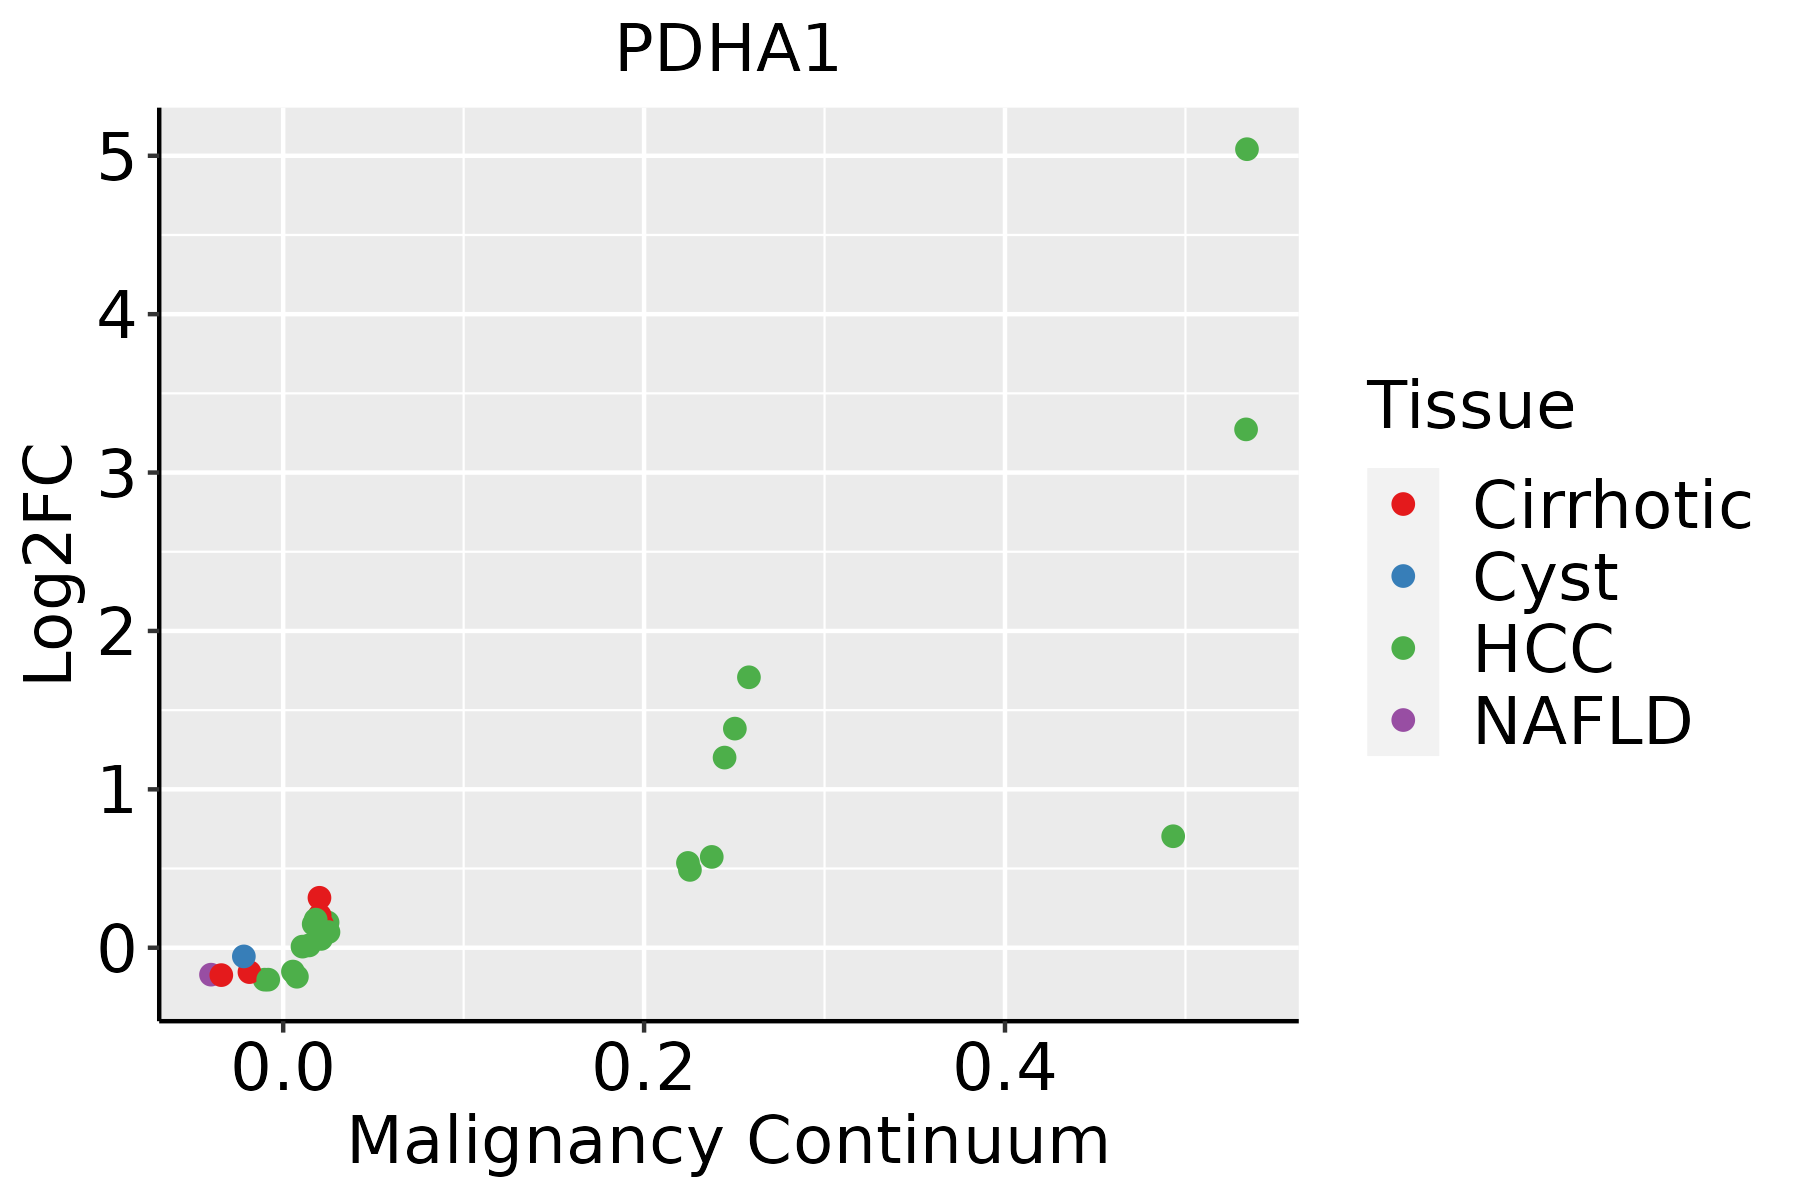 | HCC: Hepatocellular carcinoma |
| NAFLD: Non-alcoholic fatty liver disease | ||
| Oral Cavity | 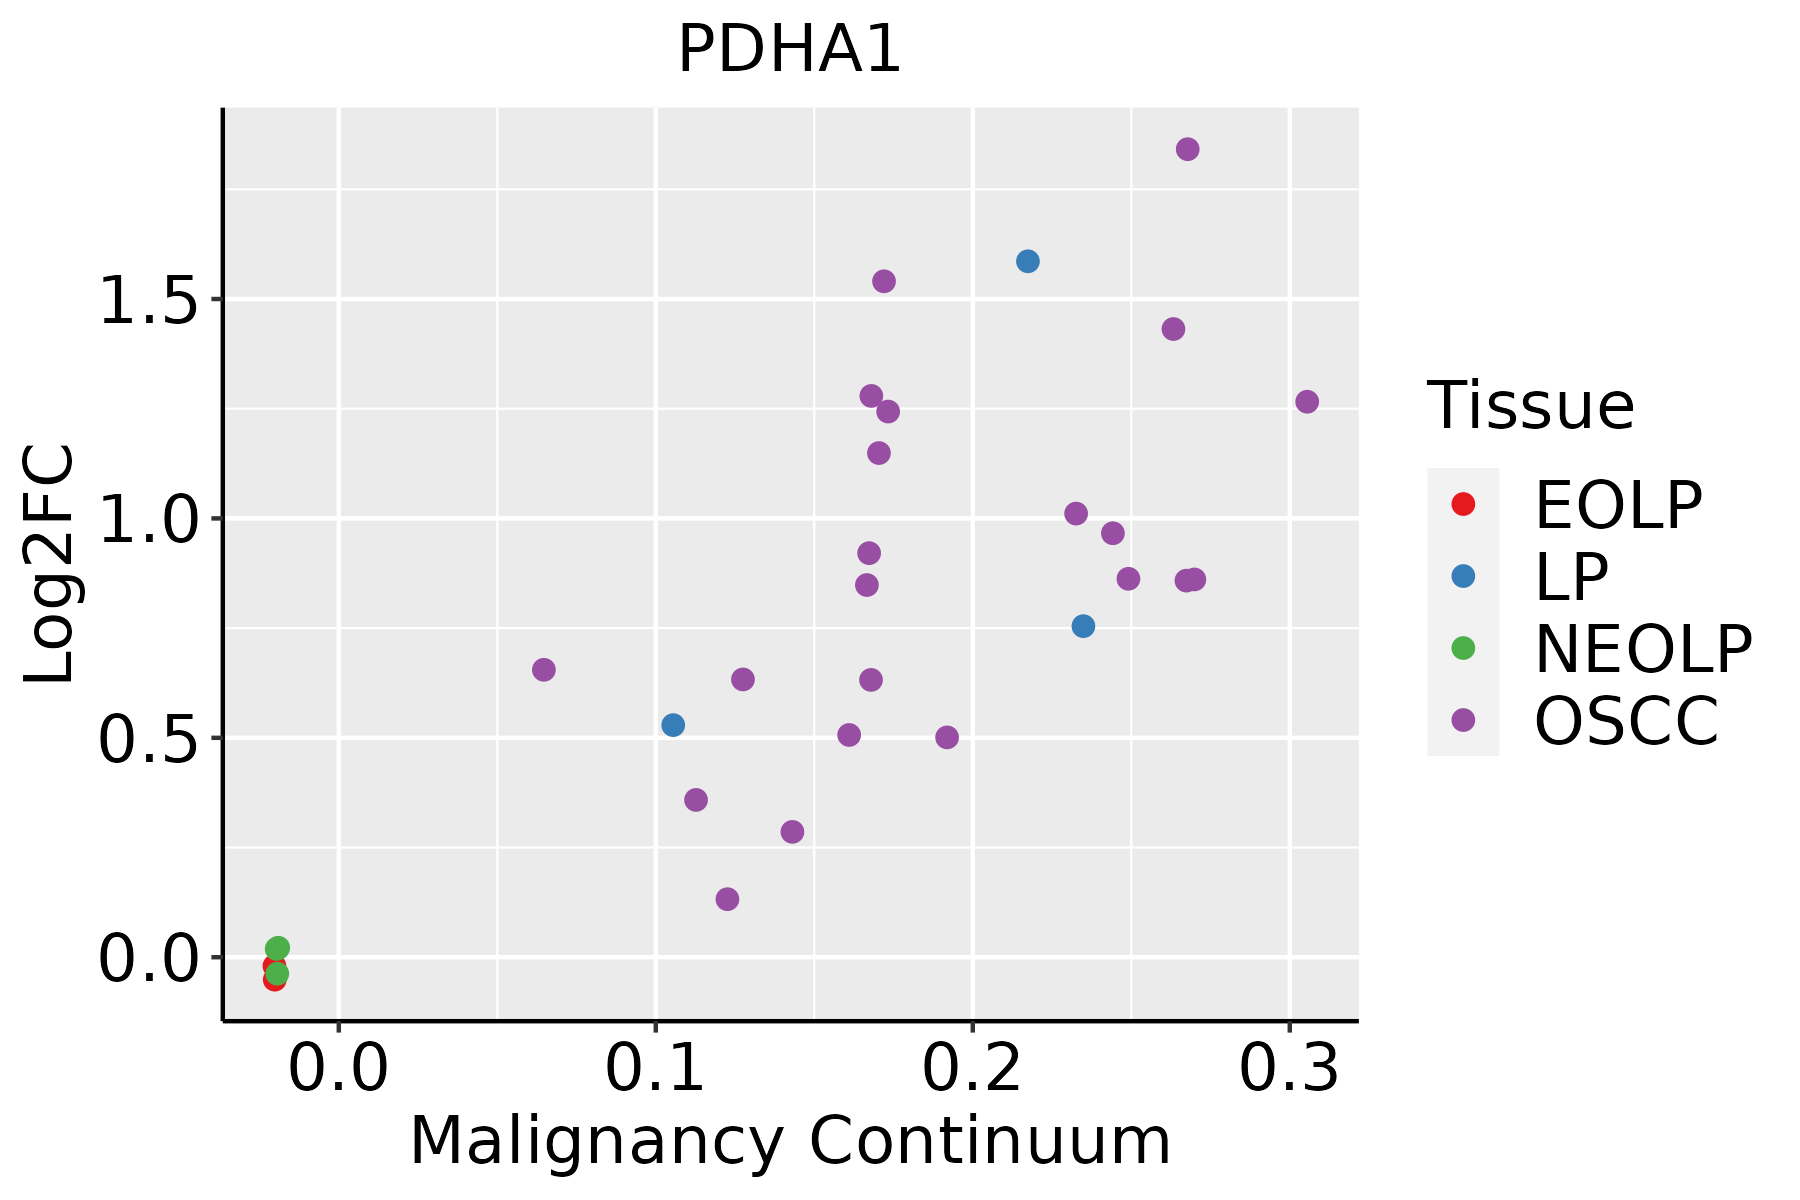 | EOLP: Erosive Oral lichen planus |
| LP: leukoplakia | ||
| NEOLP: Non-erosive oral lichen planus | ||
| OSCC: Oral squamous cell carcinoma | ||
| Skin | 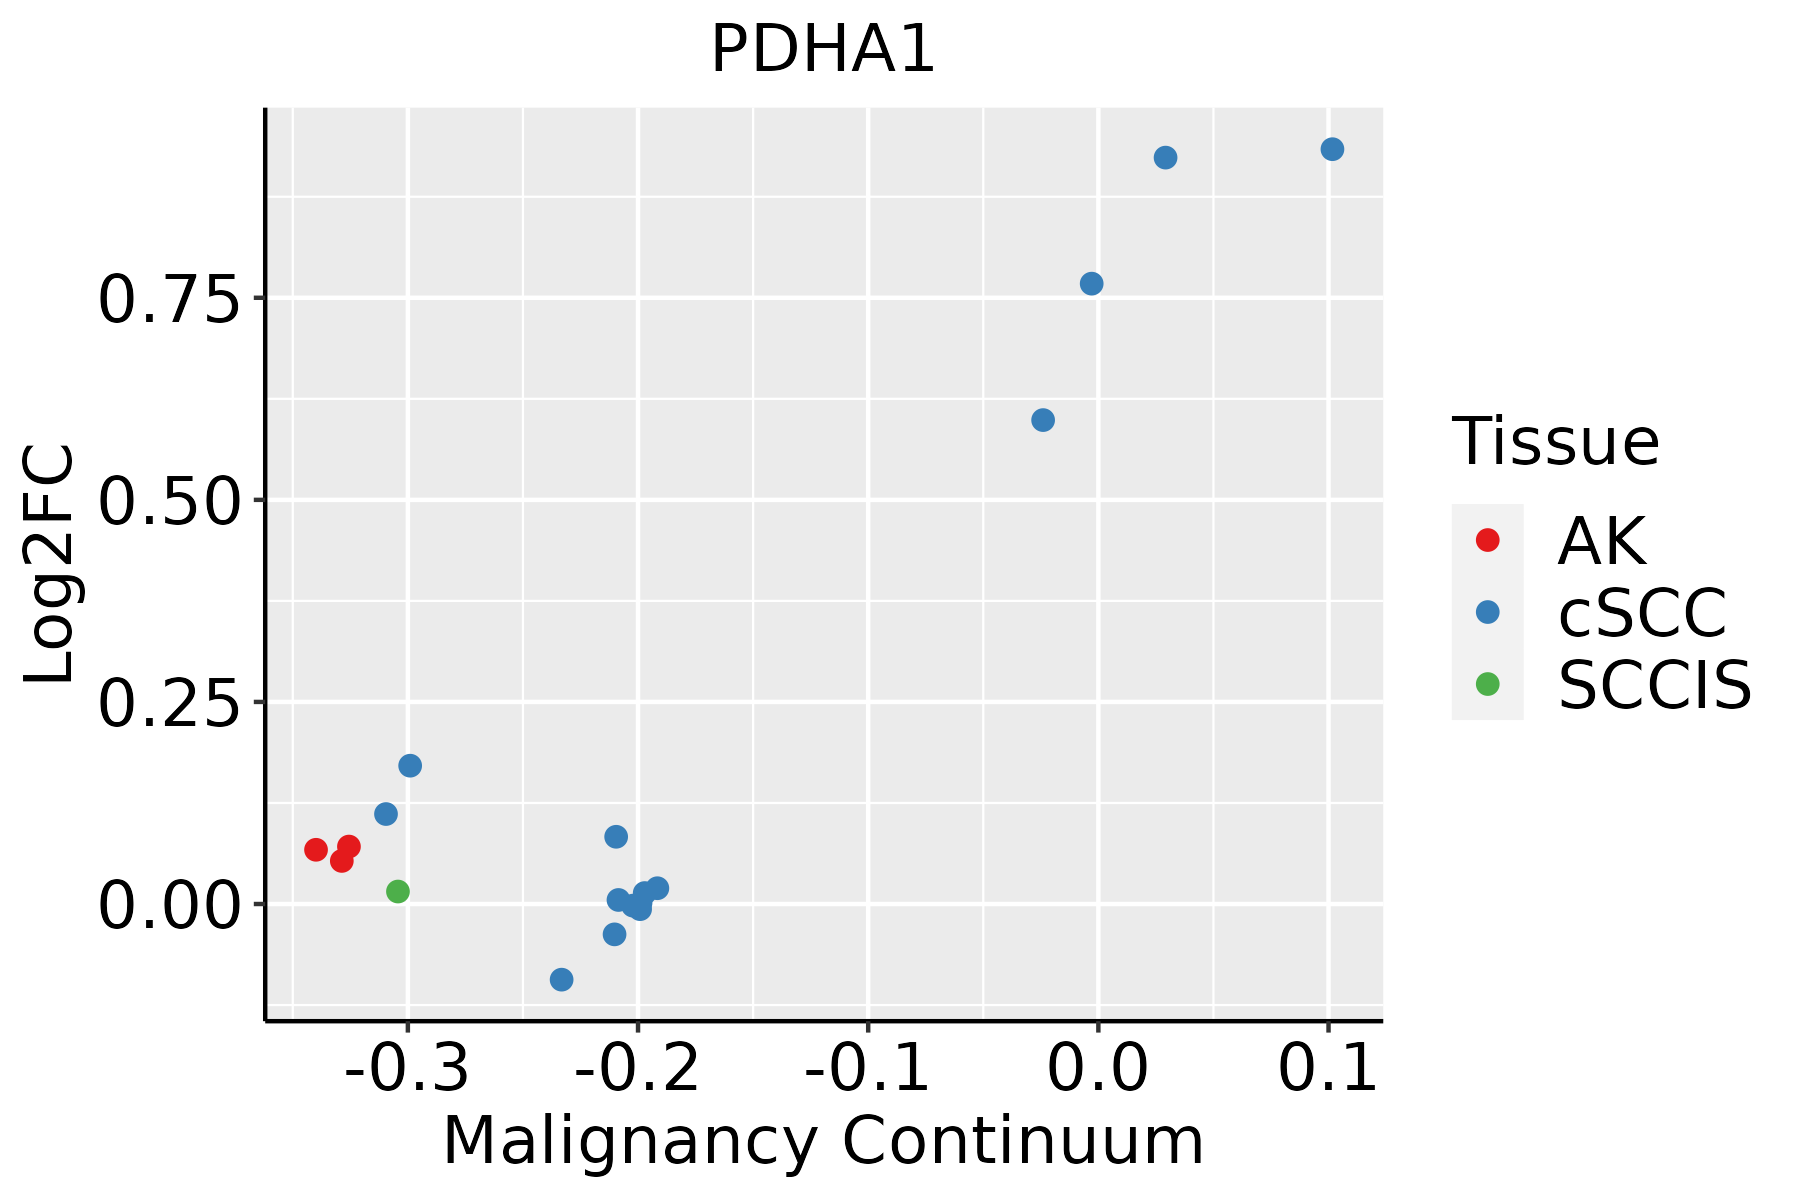 | AK: Actinic keratosis |
| cSCC: Cutaneous squamous cell carcinoma | ||
| SCCIS:squamous cell carcinoma in situ | ||
| Thyroid |  | ATC: Anaplastic thyroid cancer |
| HT: Hashimoto's thyroiditis | ||
| PTC: Papillary thyroid cancer |
| ∗log2FC in expression of this searched gene in stem-like cells from each diseased tissue sample relative to stem-like cells in normal samples in each tissue plotted against the malignancy continuum. Samples are colored based on if they are from different disease stage. |
Top |
Malignant transformation related pathway analysis |
| Find out the enriched GO biological processes and KEGG pathways involved in transition from healthy to precancer to cancer |
| Tissue | Disease Stage | Enriched GO biological Processes |
| Colorectum | AD |  |
| Colorectum | SER |  |
| Colorectum | MSS |  |
| Colorectum | MSI-H |  |
| Colorectum | FAP |  |
| ∗Top 15 enriched GO BP terms are showed in the bar plot of each disease state in each tissue. Each row represents a significant GO biological process which is colored according to the -log10(p.adjust). |
| Page: 1 2 3 4 5 6 7 8 9 |
| GO ID | Tissue | Disease Stage | Description | Gene Ratio | Bg Ratio | pvalue | p.adjust | Count |
| GO:0006091 | Colorectum | AD | generation of precursor metabolites and energy | 209/3918 | 490/18723 | 3.17e-28 | 6.61e-25 | 209 |
| GO:0009060 | Colorectum | AD | aerobic respiration | 108/3918 | 189/18723 | 9.14e-28 | 1.43e-24 | 108 |
| GO:0045333 | Colorectum | AD | cellular respiration | 119/3918 | 230/18723 | 3.21e-25 | 4.02e-22 | 119 |
| GO:0015980 | Colorectum | AD | energy derivation by oxidation of organic compounds | 143/3918 | 318/18723 | 2.78e-22 | 2.49e-19 | 143 |
| GO:0009150 | Colorectum | AD | purine ribonucleotide metabolic process | 142/3918 | 368/18723 | 4.29e-15 | 1.17e-12 | 142 |
| GO:0006163 | Colorectum | AD | purine nucleotide metabolic process | 149/3918 | 396/18723 | 1.08e-14 | 2.80e-12 | 149 |
| GO:0072521 | Colorectum | AD | purine-containing compound metabolic process | 153/3918 | 416/18723 | 4.34e-14 | 1.01e-11 | 153 |
| GO:0009259 | Colorectum | AD | ribonucleotide metabolic process | 144/3918 | 385/18723 | 5.25e-14 | 1.13e-11 | 144 |
| GO:0019693 | Colorectum | AD | ribose phosphate metabolic process | 145/3918 | 396/18723 | 3.01e-13 | 5.71e-11 | 145 |
| GO:0009117 | Colorectum | AD | nucleotide metabolic process | 168/3918 | 489/18723 | 2.20e-12 | 3.36e-10 | 168 |
| GO:0006753 | Colorectum | AD | nucleoside phosphate metabolic process | 169/3918 | 497/18723 | 4.99e-12 | 6.98e-10 | 169 |
| GO:0006090 | Colorectum | AD | pyruvate metabolic process | 47/3918 | 106/18723 | 4.85e-08 | 2.55e-06 | 47 |
| GO:0009152 | Colorectum | AD | purine ribonucleotide biosynthetic process | 64/3918 | 169/18723 | 3.09e-07 | 1.22e-05 | 64 |
| GO:0006099 | Colorectum | AD | tricarboxylic acid cycle | 19/3918 | 30/18723 | 5.82e-07 | 2.09e-05 | 19 |
| GO:0009260 | Colorectum | AD | ribonucleotide biosynthetic process | 66/3918 | 182/18723 | 1.25e-06 | 4.02e-05 | 66 |
| GO:0046390 | Colorectum | AD | ribose phosphate biosynthetic process | 67/3918 | 190/18723 | 3.21e-06 | 9.05e-05 | 67 |
| GO:0006164 | Colorectum | AD | purine nucleotide biosynthetic process | 66/3918 | 191/18723 | 8.22e-06 | 1.97e-04 | 66 |
| GO:0072522 | Colorectum | AD | purine-containing compound biosynthetic process | 68/3918 | 200/18723 | 1.12e-05 | 2.55e-04 | 68 |
| GO:0019318 | Colorectum | AD | hexose metabolic process | 77/3918 | 237/18723 | 1.96e-05 | 4.01e-04 | 77 |
| GO:1901293 | Colorectum | AD | nucleoside phosphate biosynthetic process | 80/3918 | 256/18723 | 6.31e-05 | 1.05e-03 | 80 |
| Page: 1 2 3 4 5 6 7 8 9 10 11 12 13 14 15 16 17 |
| Pathway ID | Tissue | Disease Stage | Description | Gene Ratio | Bg Ratio | pvalue | p.adjust | qvalue | Count |
| hsa05415 | Colorectum | AD | Diabetic cardiomyopathy | 114/2092 | 203/8465 | 3.65e-22 | 3.06e-20 | 1.95e-20 | 114 |
| hsa01200 | Colorectum | AD | Carbon metabolism | 55/2092 | 115/8465 | 5.53e-08 | 8.42e-07 | 5.37e-07 | 55 |
| hsa00620 | Colorectum | AD | Pyruvate metabolism | 28/2092 | 47/8465 | 3.71e-07 | 5.41e-06 | 3.45e-06 | 28 |
| hsa00020 | Colorectum | AD | Citrate cycle (TCA cycle) | 20/2092 | 30/8465 | 1.43e-06 | 1.77e-05 | 1.13e-05 | 20 |
| hsa00010 | Colorectum | AD | Glycolysis / Gluconeogenesis | 34/2092 | 67/8465 | 3.63e-06 | 4.34e-05 | 2.77e-05 | 34 |
| hsa04066 | Colorectum | AD | HIF-1 signaling pathway | 48/2092 | 109/8465 | 7.25e-06 | 7.84e-05 | 5.00e-05 | 48 |
| hsa05230 | Colorectum | AD | Central carbon metabolism in cancer | 33/2092 | 70/8465 | 3.61e-05 | 3.19e-04 | 2.03e-04 | 33 |
| hsa054151 | Colorectum | AD | Diabetic cardiomyopathy | 114/2092 | 203/8465 | 3.65e-22 | 3.06e-20 | 1.95e-20 | 114 |
| hsa012001 | Colorectum | AD | Carbon metabolism | 55/2092 | 115/8465 | 5.53e-08 | 8.42e-07 | 5.37e-07 | 55 |
| hsa006201 | Colorectum | AD | Pyruvate metabolism | 28/2092 | 47/8465 | 3.71e-07 | 5.41e-06 | 3.45e-06 | 28 |
| hsa000201 | Colorectum | AD | Citrate cycle (TCA cycle) | 20/2092 | 30/8465 | 1.43e-06 | 1.77e-05 | 1.13e-05 | 20 |
| hsa000101 | Colorectum | AD | Glycolysis / Gluconeogenesis | 34/2092 | 67/8465 | 3.63e-06 | 4.34e-05 | 2.77e-05 | 34 |
| hsa040661 | Colorectum | AD | HIF-1 signaling pathway | 48/2092 | 109/8465 | 7.25e-06 | 7.84e-05 | 5.00e-05 | 48 |
| hsa052301 | Colorectum | AD | Central carbon metabolism in cancer | 33/2092 | 70/8465 | 3.61e-05 | 3.19e-04 | 2.03e-04 | 33 |
| hsa054152 | Colorectum | SER | Diabetic cardiomyopathy | 103/1580 | 203/8465 | 1.45e-25 | 1.61e-23 | 1.17e-23 | 103 |
| hsa006202 | Colorectum | SER | Pyruvate metabolism | 22/1580 | 47/8465 | 9.62e-06 | 1.33e-04 | 9.67e-05 | 22 |
| hsa000202 | Colorectum | SER | Citrate cycle (TCA cycle) | 16/1580 | 30/8465 | 2.06e-05 | 2.74e-04 | 1.99e-04 | 16 |
| hsa049222 | Colorectum | SER | Glucagon signaling pathway | 38/1580 | 107/8465 | 2.57e-05 | 3.28e-04 | 2.38e-04 | 38 |
| hsa012002 | Colorectum | SER | Carbon metabolism | 40/1580 | 115/8465 | 2.77e-05 | 3.41e-04 | 2.47e-04 | 40 |
| hsa040662 | Colorectum | SER | HIF-1 signaling pathway | 36/1580 | 109/8465 | 2.27e-04 | 2.15e-03 | 1.56e-03 | 36 |
| Page: 1 2 3 4 5 6 7 |
Top |
Cell-cell communication analysis |
| Identification of potential cell-cell interactions between two cell types and their ligand-receptor pairs for different disease states |
| Ligand | Receptor | LRpair | Pathway | Tissue | Disease Stage |
| Page: 1 |
Top |
Single-cell gene regulatory network inference analysis |
| Find out the significant the regulons (TFs) and the target genes of each regulon across cell types for different disease states |
| TF | Cell Type | Tissue | Disease Stage | Target Gene | RSS | Regulon Activity |
| ∗The dot plots of a searched regulon are shown for all cell subpopulations in each disease state of each tissue based on the regulon specific score inferred using pySCENIC and by calculating the average expression. |
| Page: 1 |
Top |
Somatic mutation of malignant transformation related genes |
| Annotation of somatic variants for genes involved in malignant transformation |
| Hugo Symbol | Variant Class | Variant Classification | dbSNP RS | HGVSc | HGVSp | HGVSp Short | SWISSPROT | BIOTYPE | SIFT | PolyPhen | Tumor Sample Barcode | Tissue | Histology | Sex | Age | Stage | Therapy Types | Drugs | Outcome |
| PDHA1 | SNV | Missense_Mutation | c.904N>A | p.Glu302Lys | p.E302K | P08559 | protein_coding | deleterious(0.04) | probably_damaging(0.928) | TCGA-A2-A0EY-01 | Breast | breast invasive carcinoma | Female | <65 | I/II | Chemotherapy | adriamycin | SD | |
| PDHA1 | SNV | Missense_Mutation | c.914N>A | p.Arg305Lys | p.R305K | P08559 | protein_coding | tolerated(1) | benign(0.001) | TCGA-BH-A0W7-01 | Breast | breast invasive carcinoma | Female | <65 | I/II | Chemotherapy | taxotere | CR | |
| PDHA1 | insertion | Frame_Shift_Ins | novel | c.807_808insGCAAAACAATACAGACCCAT | p.Ser270AlafsTer28 | p.S270Afs*28 | P08559 | protein_coding | TCGA-AN-A0FF-01 | Breast | breast invasive carcinoma | Female | <65 | I/II | Unknown | Unknown | SD | ||
| PDHA1 | insertion | Frame_Shift_Ins | novel | c.282_283insTTTAAAAATTATTTTAGAATTAAAA | p.Thr95PhefsTer35 | p.T95Ffs*35 | P08559 | protein_coding | TCGA-B6-A0RS-01 | Breast | breast invasive carcinoma | Female | <65 | I/II | Unknown | Unknown | PD | ||
| PDHA1 | SNV | Missense_Mutation | novel | c.215N>T | p.Ala72Val | p.A72V | P08559 | protein_coding | tolerated(0.08) | benign(0.103) | TCGA-2W-A8YY-01 | Cervix | cervical & endocervical cancer | Female | <65 | I/II | Chemotherapy | cisplatin | CR |
| PDHA1 | SNV | Missense_Mutation | rs144967854 | c.248N>A | p.Arg83Gln | p.R83Q | P08559 | protein_coding | tolerated(0.15) | benign(0.063) | TCGA-2W-A8YY-01 | Cervix | cervical & endocervical cancer | Female | <65 | I/II | Chemotherapy | cisplatin | CR |
| PDHA1 | SNV | Missense_Mutation | novel | c.371N>G | p.Ile124Ser | p.I124S | P08559 | protein_coding | tolerated(0.17) | benign(0.083) | TCGA-2W-A8YY-01 | Cervix | cervical & endocervical cancer | Female | <65 | I/II | Chemotherapy | cisplatin | CR |
| PDHA1 | SNV | Missense_Mutation | c.707N>A | p.Ala236Asp | p.A236D | P08559 | protein_coding | deleterious(0) | probably_damaging(0.987) | TCGA-IR-A3LK-01 | Cervix | cervical & endocervical cancer | Female | >=65 | I/II | Chemotherapy | cisplatin | PD | |
| PDHA1 | SNV | Missense_Mutation | novel | c.700N>C | p.Asp234His | p.D234H | P08559 | protein_coding | deleterious(0) | probably_damaging(0.993) | TCGA-Q1-A5R2-01 | Cervix | cervical & endocervical cancer | Female | <65 | I/II | Chemotherapy | cisplatin | PR |
| PDHA1 | SNV | Missense_Mutation | rs794729213 | c.536N>A | p.Arg179Gln | p.R179Q | P08559 | protein_coding | deleterious(0) | possibly_damaging(0.9) | TCGA-VS-A8EL-01 | Cervix | cervical & endocervical cancer | Female | <65 | I/II | Chemotherapy | cisplatin | CR |
| Page: 1 2 3 4 5 6 |
Top |
Related drugs of malignant transformation related genes |
| Identification of chemicals and drugs interact with genes involved in malignant transfromation |
| (DGIdb 4.0) |
| Entrez ID | Symbol | Category | Interaction Types | Drug Claim Name | Drug Name | PMIDs |
| 5160 | PDHA1 | ENZYME | CPI-613 |
| Page: 1 |

Copyright 2023-Present -The University of Texas Health Science Center at Houston |