
|
|||||
|
 | |
| |
| |
| |
| |
| |
|
Gene: PDGFRL |
Gene summary for PDGFRL |
| Gene information | Species | Human | Gene symbol | PDGFRL | Gene ID | 5157 |
| Gene name | platelet derived growth factor receptor like | |
| Gene Alias | PDGRL | |
| Cytomap | 8p22 | |
| Gene Type | protein-coding | GO ID | GO:0007154 | UniProtAcc | Q15198 |
Top |
Malignant transformation analysis |
| Identification of the aberrant gene expression in precancerous and cancerous lesions by comparing the gene expression of stem-like cells in diseased tissues with normal stem cells |
| Entrez ID | Symbol | Replicates | Species | Organ | Tissue | Adj P-value | Log2FC | Malignancy |
| 5157 | PDGFRL | P2T-E | Human | Esophagus | ESCC | 5.23e-16 | 2.98e-01 | 0.1177 |
| 5157 | PDGFRL | P4T-E | Human | Esophagus | ESCC | 1.44e-06 | 1.49e-01 | 0.1323 |
| 5157 | PDGFRL | P8T-E | Human | Esophagus | ESCC | 8.85e-07 | 1.55e-01 | 0.0889 |
| 5157 | PDGFRL | P9T-E | Human | Esophagus | ESCC | 5.12e-06 | 5.82e-01 | 0.1131 |
| 5157 | PDGFRL | P16T-E | Human | Esophagus | ESCC | 2.02e-06 | 1.29e-01 | 0.1153 |
| 5157 | PDGFRL | P23T-E | Human | Esophagus | ESCC | 6.46e-03 | 8.40e-02 | 0.108 |
| 5157 | PDGFRL | P32T-E | Human | Esophagus | ESCC | 8.51e-08 | 1.65e-01 | 0.1666 |
| 5157 | PDGFRL | P44T-E | Human | Esophagus | ESCC | 2.69e-05 | 6.35e-01 | 0.1096 |
| 5157 | PDGFRL | P47T-E | Human | Esophagus | ESCC | 1.55e-03 | 2.80e-01 | 0.1067 |
| 5157 | PDGFRL | P52T-E | Human | Esophagus | ESCC | 3.97e-04 | 1.13e-01 | 0.1555 |
| 5157 | PDGFRL | P56T-E | Human | Esophagus | ESCC | 4.20e-02 | 3.80e-01 | 0.1613 |
| 5157 | PDGFRL | P61T-E | Human | Esophagus | ESCC | 6.15e-06 | 9.82e-02 | 0.099 |
| 5157 | PDGFRL | P76T-E | Human | Esophagus | ESCC | 1.66e-05 | 1.59e-01 | 0.1207 |
| 5157 | PDGFRL | P130T-E | Human | Esophagus | ESCC | 2.90e-04 | 1.81e-01 | 0.1676 |
| 5157 | PDGFRL | male-WTA | Human | Thyroid | PTC | 1.06e-26 | 1.70e-01 | 0.1037 |
| 5157 | PDGFRL | PTC01 | Human | Thyroid | PTC | 1.93e-08 | 2.73e-01 | 0.1899 |
| 5157 | PDGFRL | PTC04 | Human | Thyroid | PTC | 2.30e-08 | 1.96e-01 | 0.1927 |
| 5157 | PDGFRL | PTC05 | Human | Thyroid | PTC | 1.27e-15 | 8.03e-01 | 0.2065 |
| 5157 | PDGFRL | PTC06 | Human | Thyroid | PTC | 1.43e-22 | 8.03e-01 | 0.2057 |
| 5157 | PDGFRL | PTC07 | Human | Thyroid | PTC | 9.16e-36 | 7.76e-01 | 0.2044 |
| Page: 1 2 |
| Tissue | Expression Dynamics | Abbreviation |
| Esophagus | 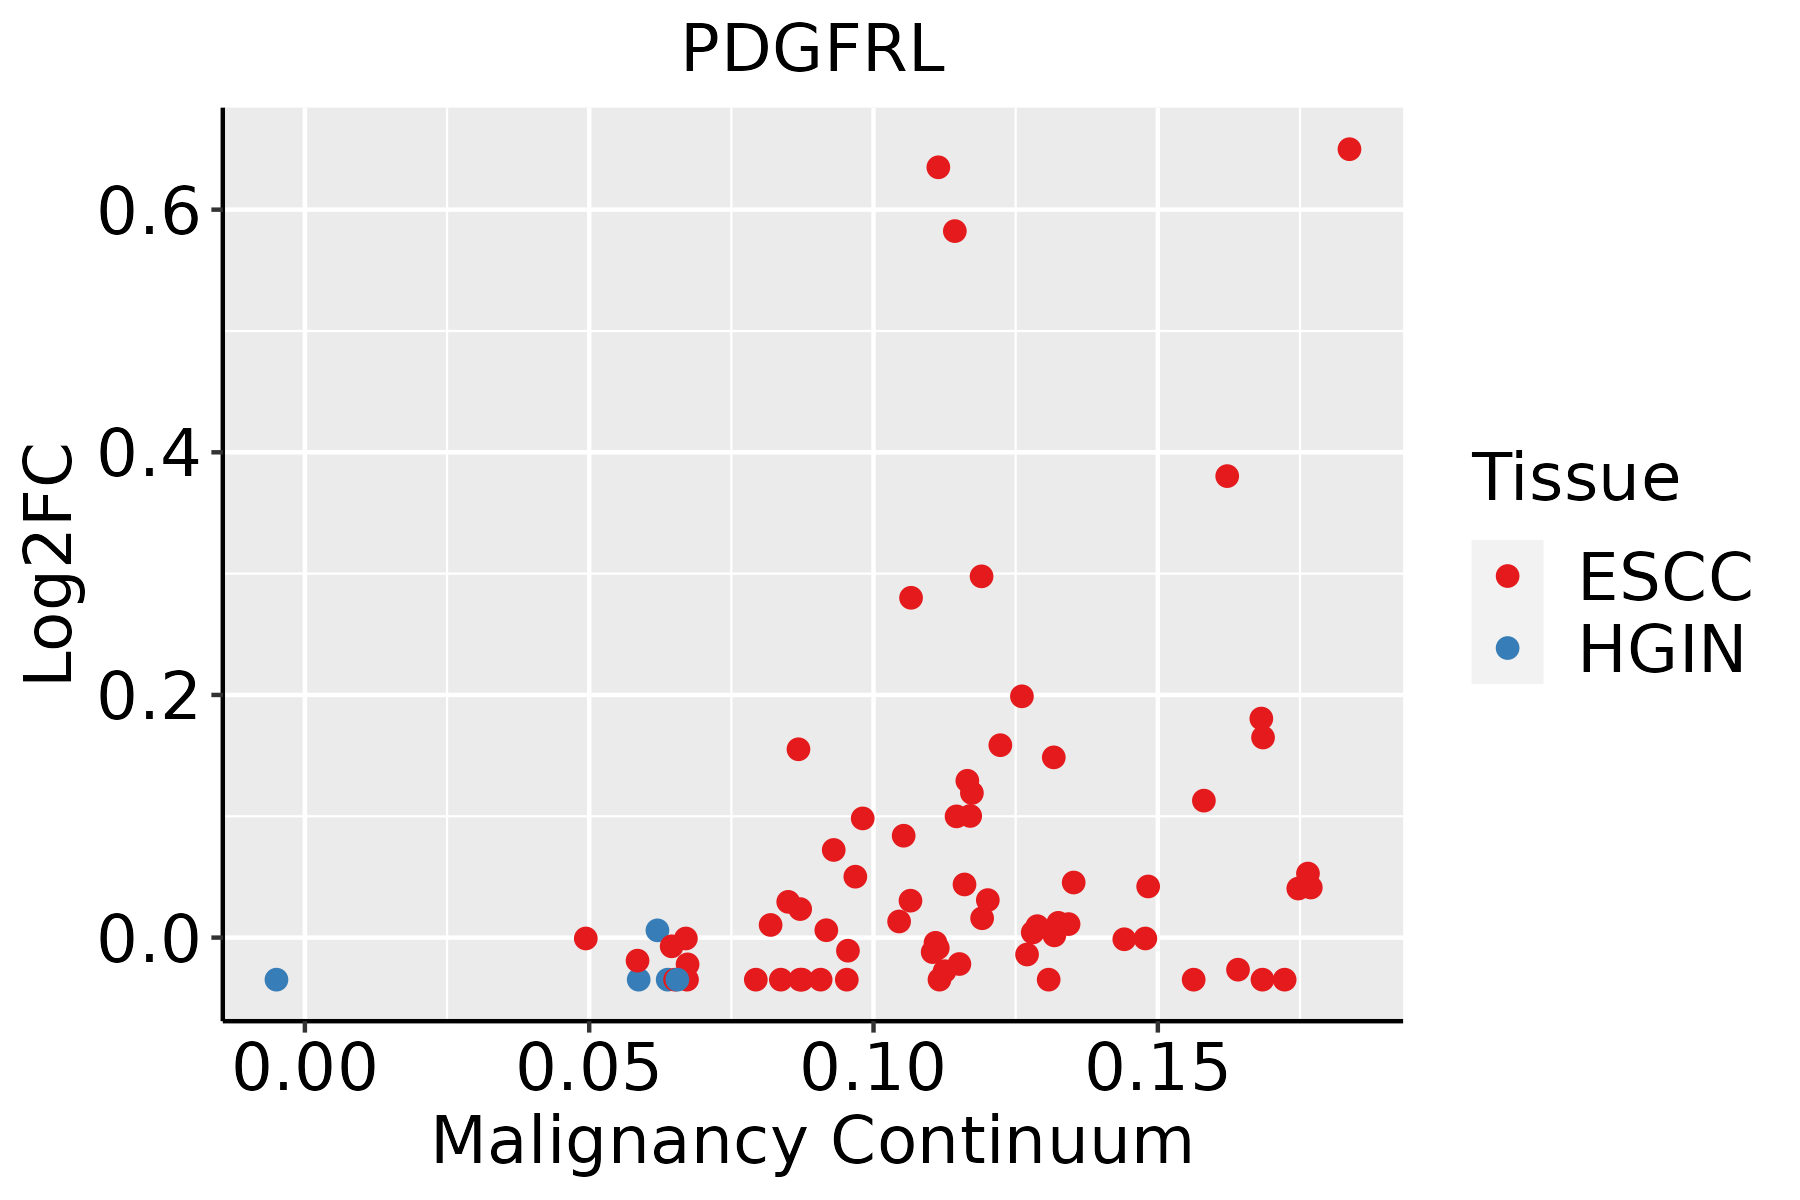 | ESCC: Esophageal squamous cell carcinoma |
| HGIN: High-grade intraepithelial neoplasias | ||
| LGIN: Low-grade intraepithelial neoplasias | ||
| Thyroid | 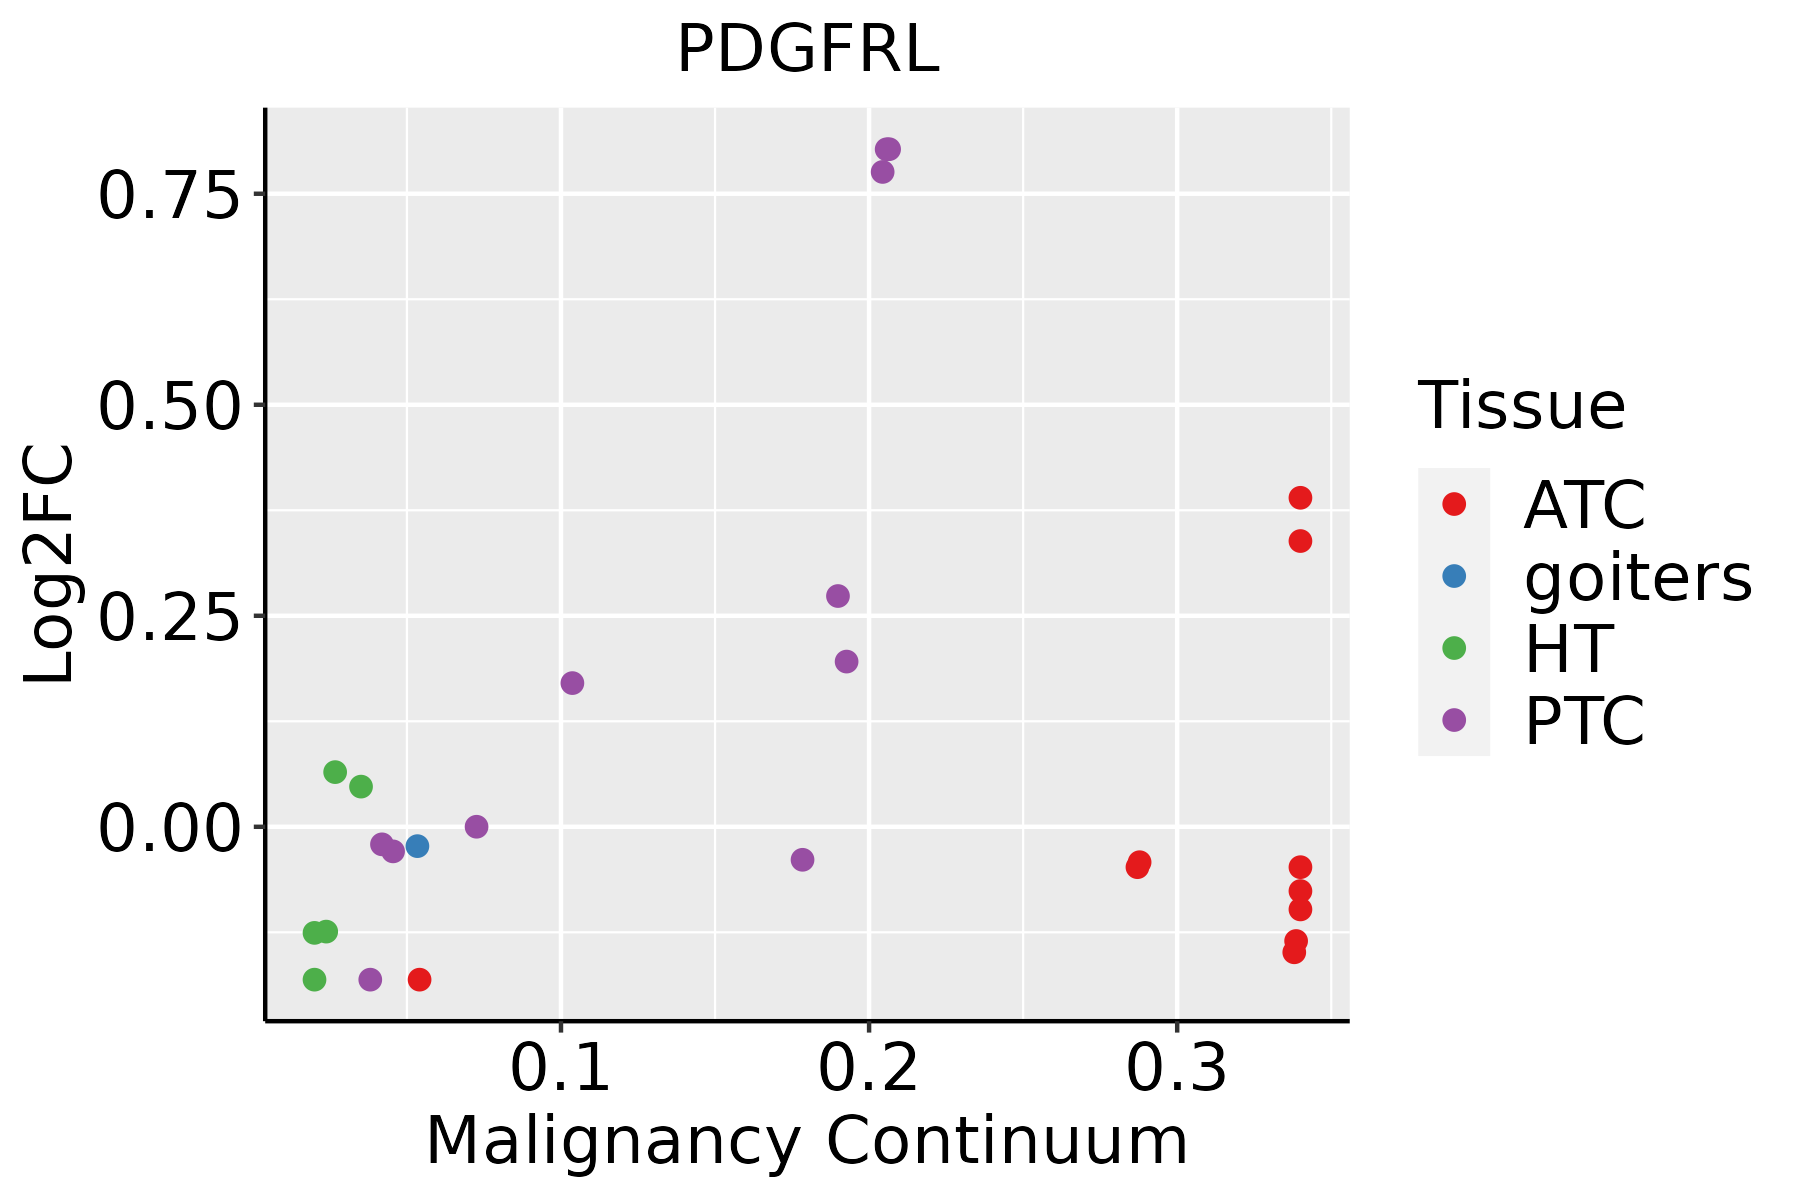 | ATC: Anaplastic thyroid cancer |
| HT: Hashimoto's thyroiditis | ||
| PTC: Papillary thyroid cancer |
| ∗log2FC in expression of this searched gene in stem-like cells from each diseased tissue sample relative to stem-like cells in normal samples in each tissue plotted against the malignancy continuum. Samples are colored based on if they are from different disease stage. |
Top |
Malignant transformation related pathway analysis |
| Find out the enriched GO biological processes and KEGG pathways involved in transition from healthy to precancer to cancer |
| Tissue | Disease Stage | Enriched GO biological Processes |
| Colorectum | AD |  |
| Colorectum | SER |  |
| Colorectum | MSS |  |
| Colorectum | MSI-H |  |
| Colorectum | FAP |  |
| ∗Top 15 enriched GO BP terms are showed in the bar plot of each disease state in each tissue. Each row represents a significant GO biological process which is colored according to the -log10(p.adjust). |
| Page: 1 2 3 4 5 6 7 8 9 |
| GO ID | Tissue | Disease Stage | Description | Gene Ratio | Bg Ratio | pvalue | p.adjust | Count |
| GO:00480087 | Esophagus | ESCC | platelet-derived growth factor receptor signaling pathway | 42/8552 | 56/18723 | 7.62e-06 | 7.54e-05 | 42 |
| GO:00480089 | Thyroid | PTC | platelet-derived growth factor receptor signaling pathway | 34/5968 | 56/18723 | 8.20e-06 | 9.42e-05 | 34 |
| GO:00357912 | Thyroid | PTC | platelet-derived growth factor receptor-beta signaling pathway | 9/5968 | 14/18723 | 1.27e-02 | 4.92e-02 | 9 |
| GO:004800815 | Thyroid | ATC | platelet-derived growth factor receptor signaling pathway | 36/6293 | 56/18723 | 2.57e-06 | 3.00e-05 | 36 |
| GO:00357911 | Thyroid | ATC | platelet-derived growth factor receptor-beta signaling pathway | 10/6293 | 14/18723 | 4.31e-03 | 1.80e-02 | 10 |
| Page: 1 |
| Pathway ID | Tissue | Disease Stage | Description | Gene Ratio | Bg Ratio | pvalue | p.adjust | qvalue | Count |
| Page: 1 |
Top |
Cell-cell communication analysis |
| Identification of potential cell-cell interactions between two cell types and their ligand-receptor pairs for different disease states |
| Ligand | Receptor | LRpair | Pathway | Tissue | Disease Stage |
| Page: 1 |
Top |
Single-cell gene regulatory network inference analysis |
| Find out the significant the regulons (TFs) and the target genes of each regulon across cell types for different disease states |
| TF | Cell Type | Tissue | Disease Stage | Target Gene | RSS | Regulon Activity |
| ∗The dot plots of a searched regulon are shown for all cell subpopulations in each disease state of each tissue based on the regulon specific score inferred using pySCENIC and by calculating the average expression. |
| Page: 1 |
Top |
Somatic mutation of malignant transformation related genes |
| Annotation of somatic variants for genes involved in malignant transformation |
| Hugo Symbol | Variant Class | Variant Classification | dbSNP RS | HGVSc | HGVSp | HGVSp Short | SWISSPROT | BIOTYPE | SIFT | PolyPhen | Tumor Sample Barcode | Tissue | Histology | Sex | Age | Stage | Therapy Types | Drugs | Outcome |
| PDGFRL | SNV | Missense_Mutation | rs766283620 | c.518N>C | p.Leu173Pro | p.L173P | Q15198 | protein_coding | deleterious(0) | probably_damaging(0.982) | TCGA-E2-A14W-01 | Breast | breast invasive carcinoma | Male | >=65 | I/II | Chemotherapy | cytoxan | SD |
| PDGFRL | SNV | Missense_Mutation | novel | c.632T>C | p.Phe211Ser | p.F211S | Q15198 | protein_coding | deleterious(0) | possibly_damaging(0.719) | TCGA-AA-A010-01 | Colorectum | colon adenocarcinoma | Female | <65 | I/II | Chemotherapy | folinic | CR |
| PDGFRL | SNV | Missense_Mutation | rs746979097 | c.755N>A | p.Gly252Asp | p.G252D | Q15198 | protein_coding | tolerated(0.09) | benign(0.02) | TCGA-AZ-4315-01 | Colorectum | colon adenocarcinoma | Male | <65 | I/II | Unknown | Unknown | SD |
| PDGFRL | SNV | Missense_Mutation | c.548T>C | p.Val183Ala | p.V183A | Q15198 | protein_coding | deleterious(0.04) | benign(0.23) | TCGA-A5-A0GP-01 | Endometrium | uterine corpus endometrioid carcinoma | Female | <65 | I/II | Unknown | Unknown | SD | |
| PDGFRL | SNV | Missense_Mutation | novel | c.937N>C | p.Lys313Gln | p.K313Q | Q15198 | protein_coding | tolerated(0.38) | benign(0.184) | TCGA-AJ-A3EL-01 | Endometrium | uterine corpus endometrioid carcinoma | Female | <65 | I/II | Unknown | Unknown | SD |
| PDGFRL | SNV | Missense_Mutation | c.542N>C | p.Phe181Ser | p.F181S | Q15198 | protein_coding | deleterious(0) | probably_damaging(0.972) | TCGA-AP-A051-01 | Endometrium | uterine corpus endometrioid carcinoma | Female | >=65 | I/II | Unknown | Unknown | SD | |
| PDGFRL | SNV | Missense_Mutation | c.499N>G | p.Phe167Val | p.F167V | Q15198 | protein_coding | tolerated(0.06) | benign(0.194) | TCGA-AP-A056-01 | Endometrium | uterine corpus endometrioid carcinoma | Female | <65 | I/II | Unknown | Unknown | SD | |
| PDGFRL | SNV | Missense_Mutation | rs754170291 | c.544N>A | p.Asp182Asn | p.D182N | Q15198 | protein_coding | deleterious(0) | benign(0.211) | TCGA-AX-A05Z-01 | Endometrium | uterine corpus endometrioid carcinoma | Female | <65 | III/IV | Chemotherapy | adriamycin | SD |
| PDGFRL | SNV | Missense_Mutation | novel | c.168N>A | p.Asp56Glu | p.D56E | Q15198 | protein_coding | tolerated(0.95) | benign(0.003) | TCGA-AX-A06F-01 | Endometrium | uterine corpus endometrioid carcinoma | Female | <65 | III/IV | Chemotherapy | carboplatin | SD |
| PDGFRL | SNV | Missense_Mutation | rs146087994 | c.1046N>T | p.Thr349Met | p.T349M | Q15198 | protein_coding | deleterious(0.04) | probably_damaging(0.939) | TCGA-AX-A0J1-01 | Endometrium | uterine corpus endometrioid carcinoma | Female | >=65 | I/II | Unknown | Unknown | SD |
| Page: 1 2 3 4 |
Top |
Related drugs of malignant transformation related genes |
| Identification of chemicals and drugs interact with genes involved in malignant transfromation |
| (DGIdb 4.0) |
| Entrez ID | Symbol | Category | Interaction Types | Drug Claim Name | Drug Name | PMIDs |
| Page: 1 |

Copyright 2023-Present -The University of Texas Health Science Center at Houston |