
|
|||||
|
 | |
| |
| |
| |
| |
| |
|
Gene: PDGFC |
Gene summary for PDGFC |
| Gene information | Species | Human | Gene symbol | PDGFC | Gene ID | 56034 |
| Gene name | platelet derived growth factor C | |
| Gene Alias | FALLOTEIN | |
| Cytomap | 4q32.1 | |
| Gene Type | protein-coding | GO ID | GO:0000165 | UniProtAcc | Q9NRA1 |
Top |
Malignant transformation analysis |
| Identification of the aberrant gene expression in precancerous and cancerous lesions by comparing the gene expression of stem-like cells in diseased tissues with normal stem cells |
| Entrez ID | Symbol | Replicates | Species | Organ | Tissue | Adj P-value | Log2FC | Malignancy |
| 56034 | PDGFC | P2T-E | Human | Esophagus | ESCC | 1.16e-19 | 6.23e-02 | 0.1177 |
| 56034 | PDGFC | P8T-E | Human | Esophagus | ESCC | 1.64e-16 | 5.05e-02 | 0.0889 |
| 56034 | PDGFC | P11T-E | Human | Esophagus | ESCC | 5.92e-07 | 4.96e-01 | 0.1426 |
| 56034 | PDGFC | P12T-E | Human | Esophagus | ESCC | 4.35e-09 | 5.34e-02 | 0.1122 |
| 56034 | PDGFC | P16T-E | Human | Esophagus | ESCC | 7.10e-07 | 7.55e-03 | 0.1153 |
| 56034 | PDGFC | P19T-E | Human | Esophagus | ESCC | 5.32e-05 | 3.52e-01 | 0.1662 |
| 56034 | PDGFC | P21T-E | Human | Esophagus | ESCC | 9.07e-12 | 9.10e-02 | 0.1617 |
| 56034 | PDGFC | P22T-E | Human | Esophagus | ESCC | 9.17e-04 | -6.59e-02 | 0.1236 |
| 56034 | PDGFC | P26T-E | Human | Esophagus | ESCC | 4.53e-14 | 3.96e-01 | 0.1276 |
| 56034 | PDGFC | P28T-E | Human | Esophagus | ESCC | 1.76e-02 | -8.13e-02 | 0.1149 |
| 56034 | PDGFC | P31T-E | Human | Esophagus | ESCC | 3.26e-04 | 3.83e-02 | 0.1251 |
| 56034 | PDGFC | P32T-E | Human | Esophagus | ESCC | 7.89e-22 | 5.01e-01 | 0.1666 |
| 56034 | PDGFC | P37T-E | Human | Esophagus | ESCC | 4.33e-26 | 5.38e-01 | 0.1371 |
| 56034 | PDGFC | P39T-E | Human | Esophagus | ESCC | 4.31e-04 | -6.45e-02 | 0.0894 |
| 56034 | PDGFC | P42T-E | Human | Esophagus | ESCC | 4.25e-02 | 5.76e-02 | 0.1175 |
| 56034 | PDGFC | P44T-E | Human | Esophagus | ESCC | 3.74e-05 | 7.90e-02 | 0.1096 |
| 56034 | PDGFC | P47T-E | Human | Esophagus | ESCC | 5.21e-05 | 2.79e-02 | 0.1067 |
| 56034 | PDGFC | P49T-E | Human | Esophagus | ESCC | 6.35e-07 | 8.89e-01 | 0.1768 |
| 56034 | PDGFC | P52T-E | Human | Esophagus | ESCC | 3.28e-09 | 1.40e-01 | 0.1555 |
| 56034 | PDGFC | P56T-E | Human | Esophagus | ESCC | 1.19e-03 | 8.89e-01 | 0.1613 |
| Page: 1 2 3 4 |
| Tissue | Expression Dynamics | Abbreviation |
| Esophagus |  | ESCC: Esophageal squamous cell carcinoma |
| HGIN: High-grade intraepithelial neoplasias | ||
| LGIN: Low-grade intraepithelial neoplasias | ||
| Lung | 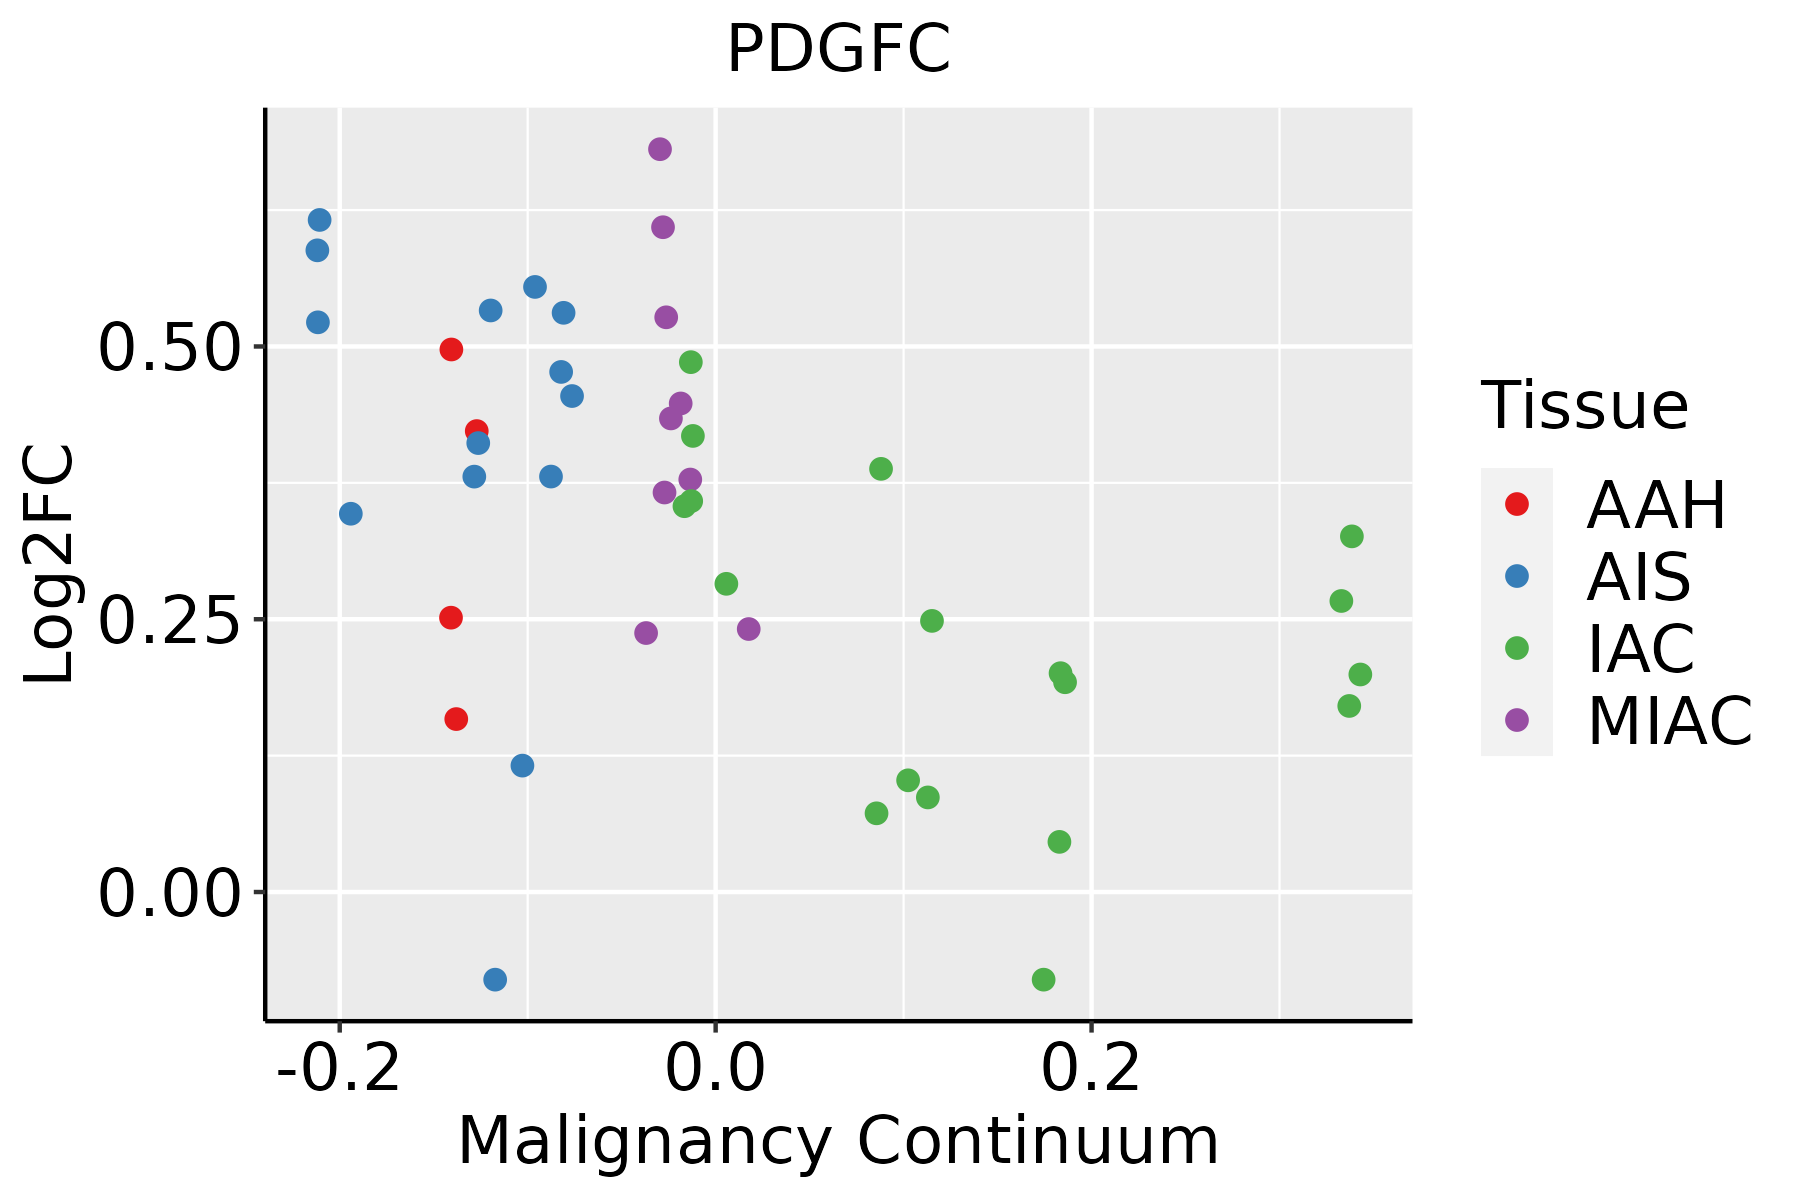 | AAH: Atypical adenomatous hyperplasia |
| AIS: Adenocarcinoma in situ | ||
| IAC: Invasive lung adenocarcinoma | ||
| MIA: Minimally invasive adenocarcinoma | ||
| Oral Cavity | 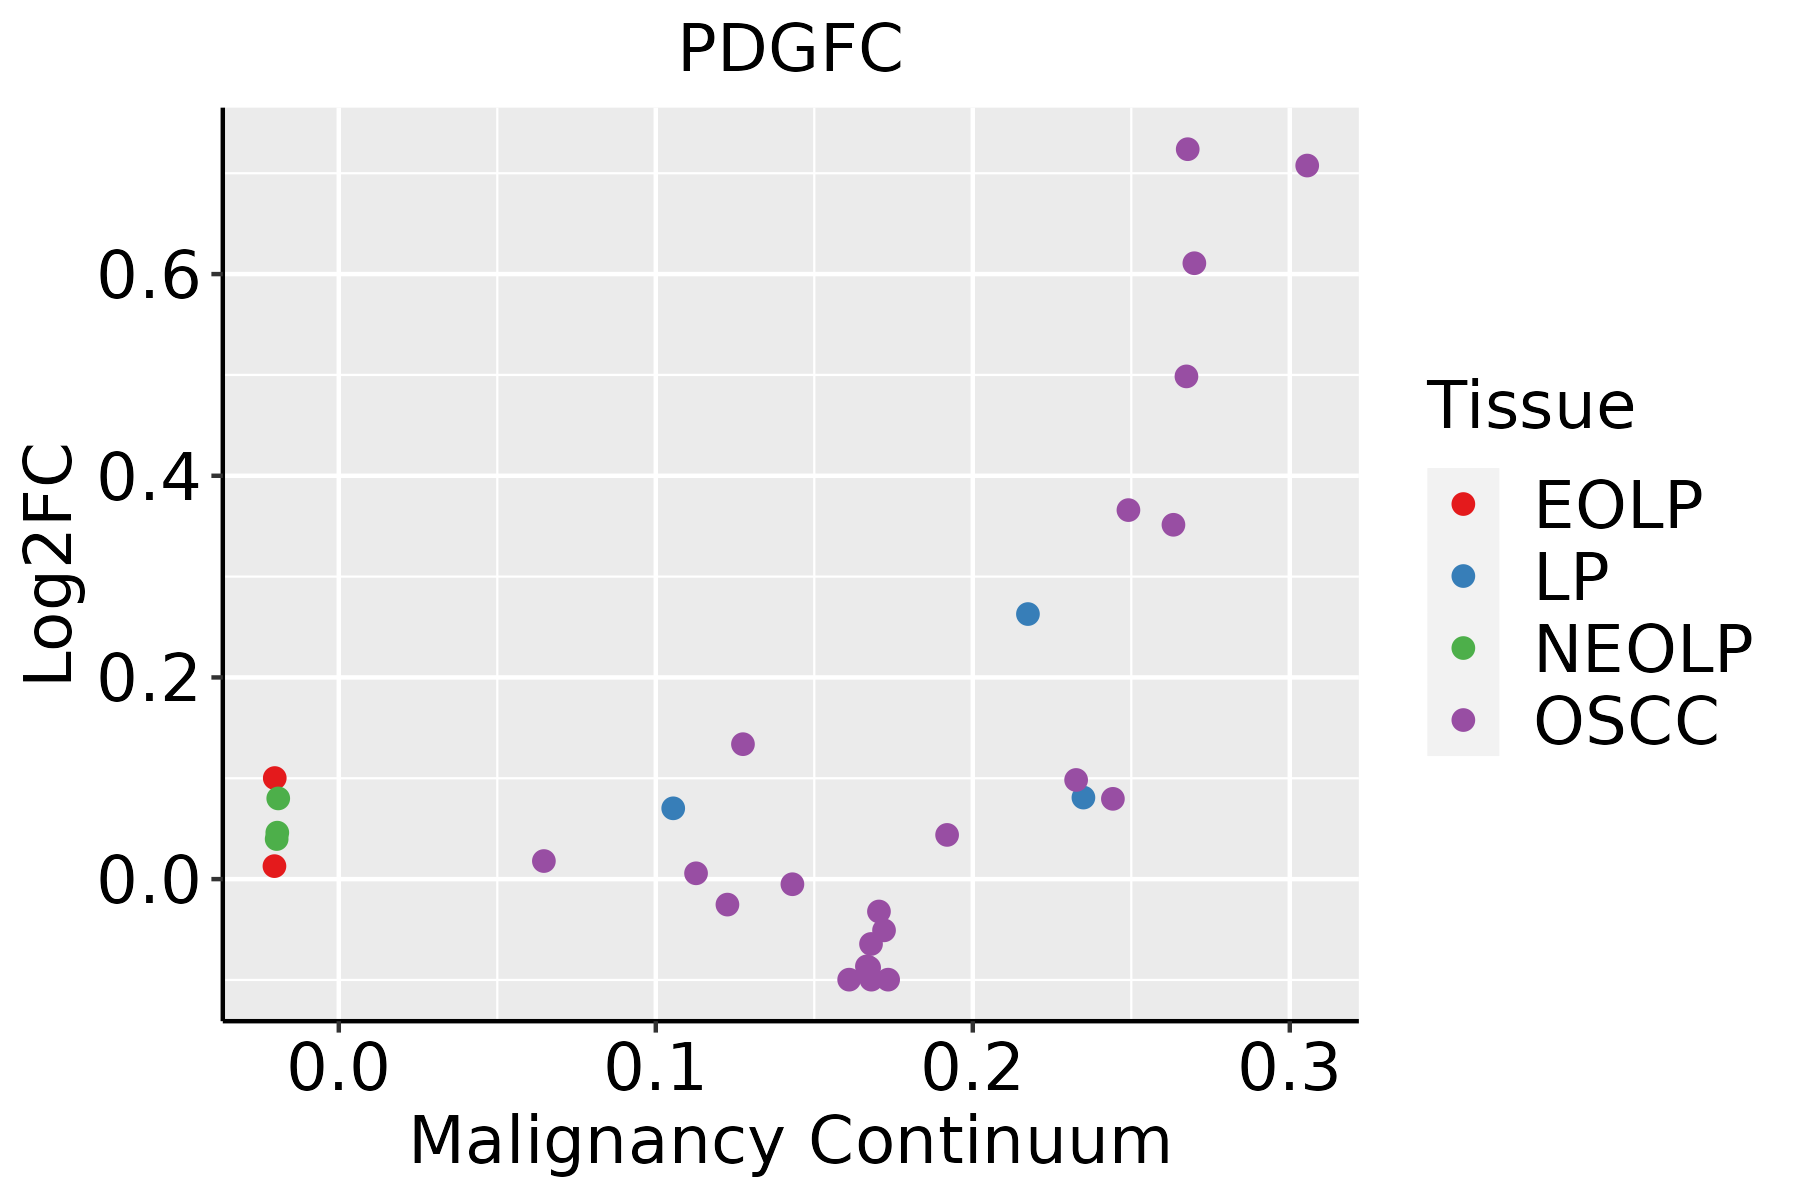 | EOLP: Erosive Oral lichen planus |
| LP: leukoplakia | ||
| NEOLP: Non-erosive oral lichen planus | ||
| OSCC: Oral squamous cell carcinoma | ||
| Prostate | 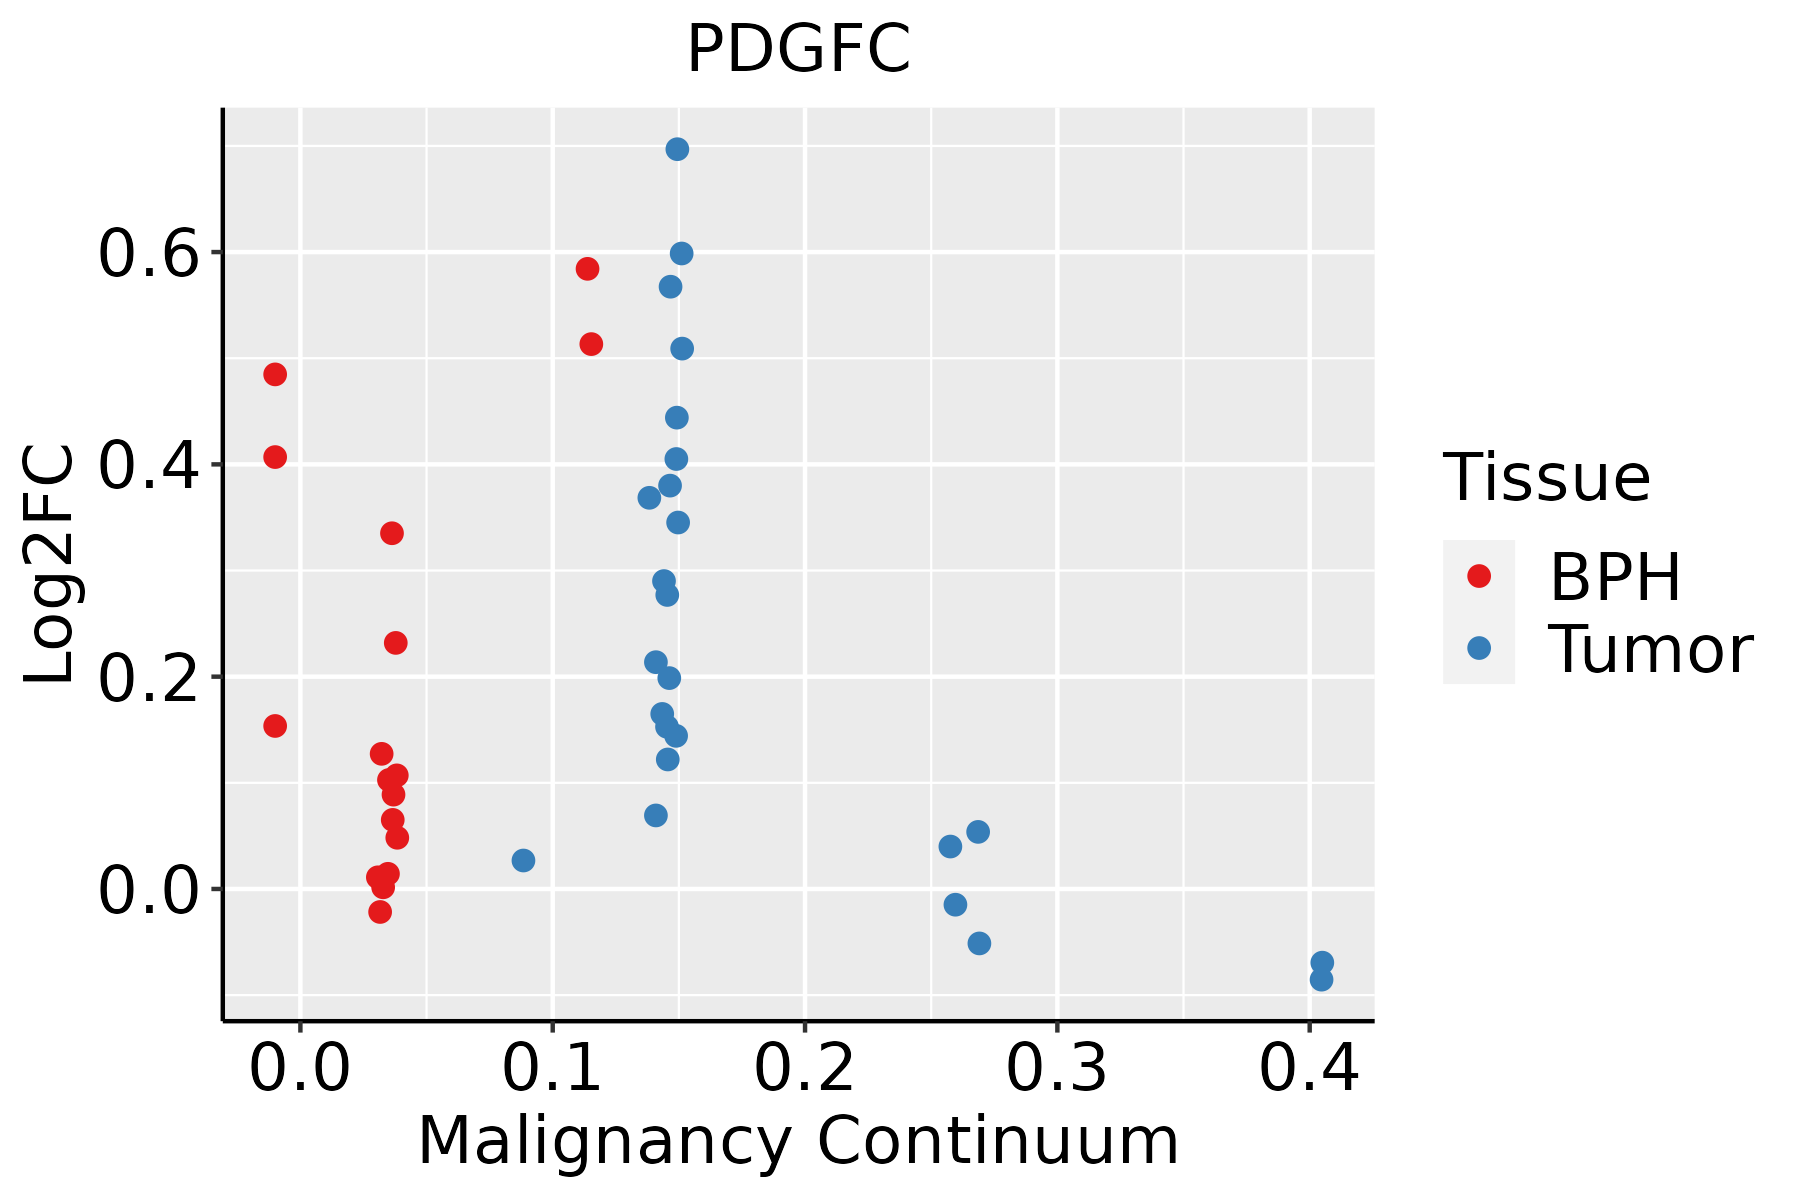 | BPH: Benign Prostatic Hyperplasia |
| Skin |  | AK: Actinic keratosis |
| cSCC: Cutaneous squamous cell carcinoma | ||
| SCCIS:squamous cell carcinoma in situ | ||
| Thyroid | 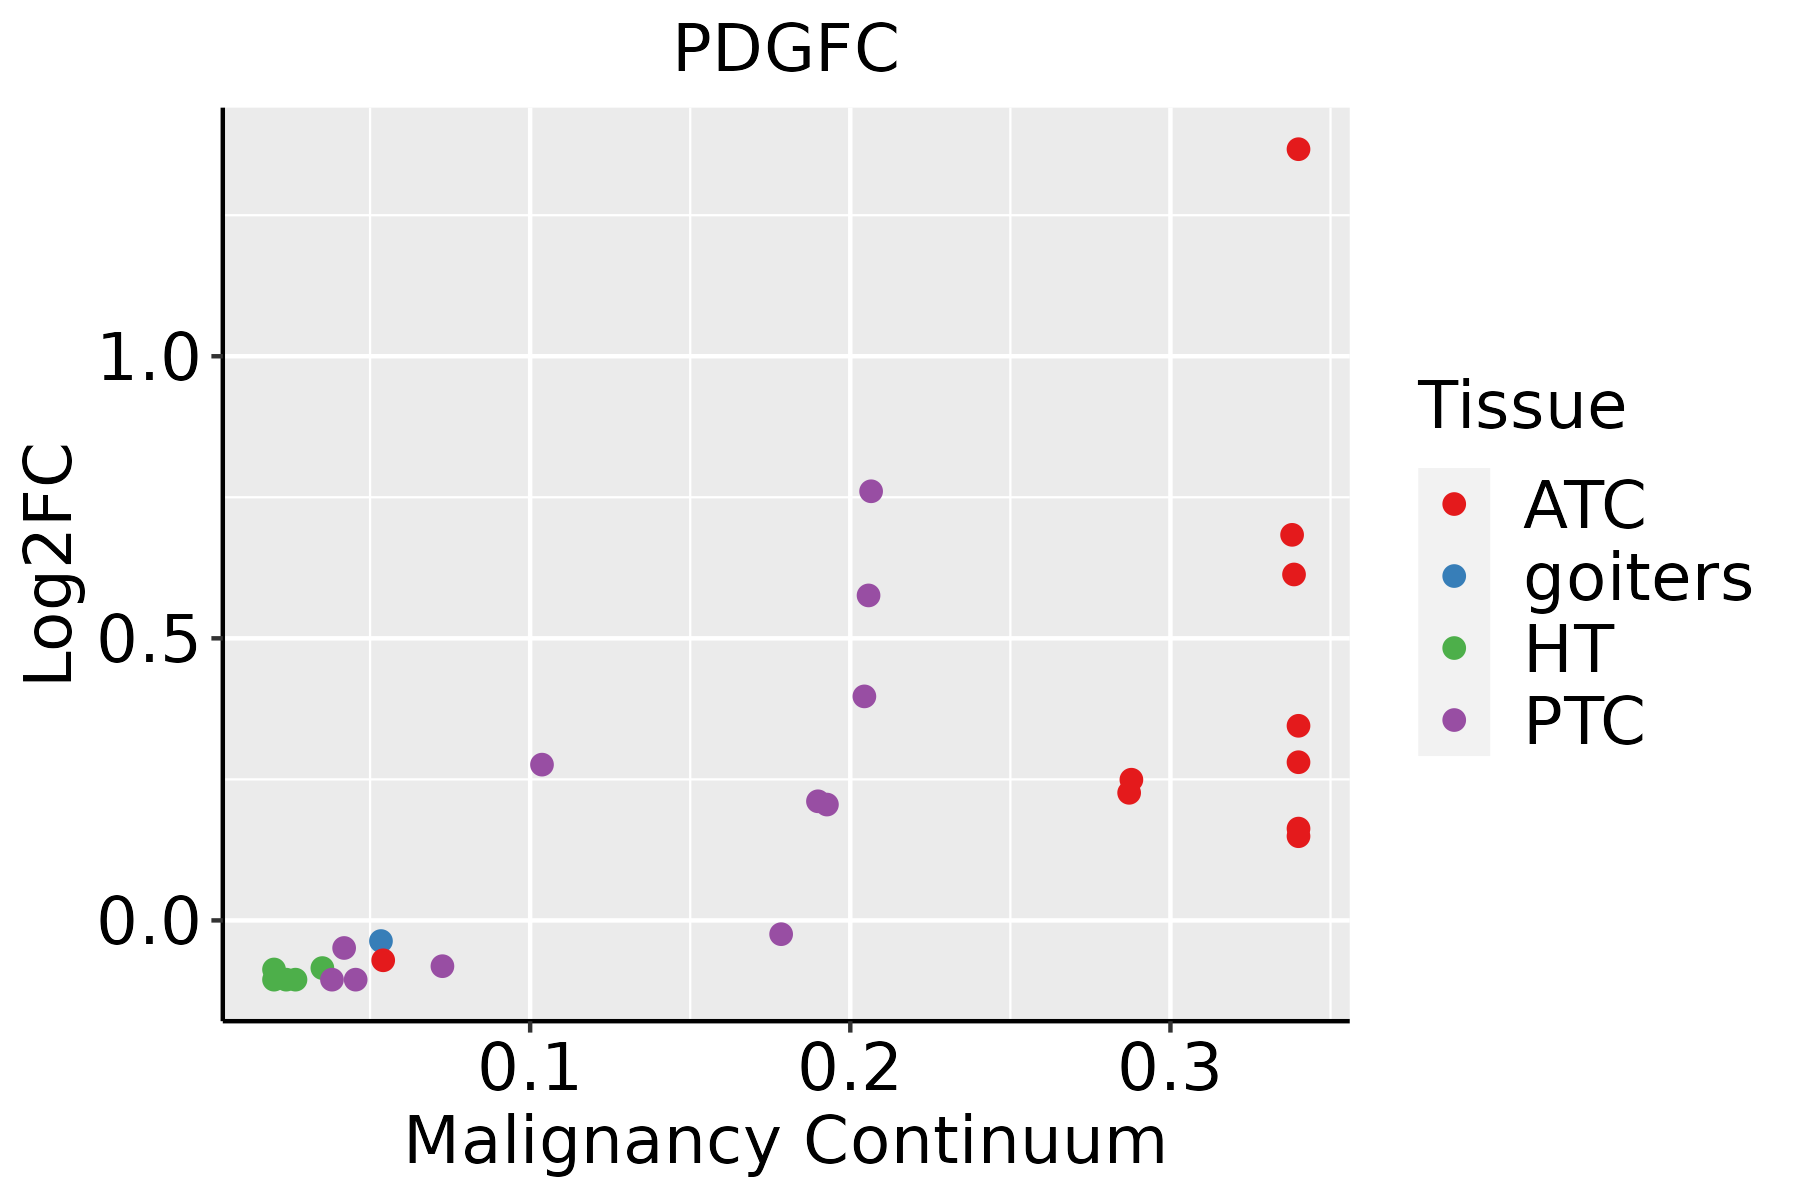 | ATC: Anaplastic thyroid cancer |
| HT: Hashimoto's thyroiditis | ||
| PTC: Papillary thyroid cancer |
| ∗log2FC in expression of this searched gene in stem-like cells from each diseased tissue sample relative to stem-like cells in normal samples in each tissue plotted against the malignancy continuum. Samples are colored based on if they are from different disease stage. |
Top |
Malignant transformation related pathway analysis |
| Find out the enriched GO biological processes and KEGG pathways involved in transition from healthy to precancer to cancer |
| Tissue | Disease Stage | Enriched GO biological Processes |
| Colorectum | AD |  |
| Colorectum | SER |  |
| Colorectum | MSS |  |
| Colorectum | MSI-H |  |
| Colorectum | FAP |  |
| ∗Top 15 enriched GO BP terms are showed in the bar plot of each disease state in each tissue. Each row represents a significant GO biological process which is colored according to the -log10(p.adjust). |
| Page: 1 2 3 4 5 6 7 8 9 |
| GO ID | Tissue | Disease Stage | Description | Gene Ratio | Bg Ratio | pvalue | p.adjust | Count |
| GO:007190016 | Esophagus | ESCC | regulation of protein serine/threonine kinase activity | 227/8552 | 359/18723 | 1.12e-11 | 4.10e-10 | 227 |
| GO:00719029 | Esophagus | ESCC | positive regulation of protein serine/threonine kinase activity | 124/8552 | 200/18723 | 2.27e-06 | 2.61e-05 | 124 |
| GO:004677710 | Esophagus | ESCC | protein autophosphorylation | 138/8552 | 227/18723 | 2.98e-06 | 3.38e-05 | 138 |
| GO:004814414 | Esophagus | ESCC | fibroblast proliferation | 57/8552 | 81/18723 | 5.83e-06 | 6.03e-05 | 57 |
| GO:004586018 | Esophagus | ESCC | positive regulation of protein kinase activity | 219/8552 | 386/18723 | 6.91e-06 | 6.97e-05 | 219 |
| GO:003367420 | Esophagus | ESCC | positive regulation of kinase activity | 260/8552 | 467/18723 | 7.26e-06 | 7.22e-05 | 260 |
| GO:00480087 | Esophagus | ESCC | platelet-derived growth factor receptor signaling pathway | 42/8552 | 56/18723 | 7.62e-06 | 7.54e-05 | 42 |
| GO:004814514 | Esophagus | ESCC | regulation of fibroblast proliferation | 56/8552 | 80/18723 | 9.08e-06 | 8.71e-05 | 56 |
| GO:00432007 | Esophagus | ESCC | response to amino acid | 74/8552 | 116/18723 | 6.23e-05 | 4.76e-04 | 74 |
| GO:000110110 | Esophagus | ESCC | response to acid chemical | 84/8552 | 135/18723 | 7.70e-05 | 5.74e-04 | 84 |
| GO:00712305 | Esophagus | ESCC | cellular response to amino acid stimulus | 48/8552 | 71/18723 | 1.55e-04 | 1.03e-03 | 48 |
| GO:00712296 | Esophagus | ESCC | cellular response to acid chemical | 52/8552 | 80/18723 | 3.79e-04 | 2.20e-03 | 52 |
| GO:00485687 | Esophagus | ESCC | embryonic organ development | 228/8552 | 427/18723 | 7.28e-04 | 3.79e-03 | 228 |
| GO:00434055 | Esophagus | ESCC | regulation of MAP kinase activity | 102/8552 | 177/18723 | 8.89e-04 | 4.55e-03 | 102 |
| GO:00182124 | Esophagus | ESCC | peptidyl-tyrosine modification | 202/8552 | 378/18723 | 1.34e-03 | 6.39e-03 | 202 |
| GO:00181084 | Esophagus | ESCC | peptidyl-tyrosine phosphorylation | 200/8552 | 375/18723 | 1.60e-03 | 7.45e-03 | 200 |
| GO:00603485 | Esophagus | ESCC | bone development | 115/8552 | 205/18723 | 1.67e-03 | 7.72e-03 | 115 |
| GO:00507303 | Esophagus | ESCC | regulation of peptidyl-tyrosine phosphorylation | 144/8552 | 264/18723 | 2.22e-03 | 9.78e-03 | 144 |
| GO:00481464 | Esophagus | ESCC | positive regulation of fibroblast proliferation | 32/8552 | 48/18723 | 2.70e-03 | 1.14e-02 | 32 |
| GO:00319521 | Esophagus | ESCC | regulation of protein autophosphorylation | 29/8552 | 43/18723 | 3.25e-03 | 1.35e-02 | 29 |
| Page: 1 2 3 4 5 6 7 8 9 10 |
| Pathway ID | Tissue | Disease Stage | Description | Gene Ratio | Bg Ratio | pvalue | p.adjust | qvalue | Count |
| hsa0521516 | Esophagus | ESCC | Prostate cancer | 72/4205 | 97/8465 | 6.12e-07 | 4.10e-06 | 2.10e-06 | 72 |
| hsa0451020 | Esophagus | ESCC | Focal adhesion | 127/4205 | 203/8465 | 1.25e-04 | 4.99e-04 | 2.56e-04 | 127 |
| hsa0152110 | Esophagus | ESCC | EGFR tyrosine kinase inhibitor resistance | 55/4205 | 79/8465 | 2.44e-04 | 8.78e-04 | 4.50e-04 | 55 |
| hsa0481028 | Esophagus | ESCC | Regulation of actin cytoskeleton | 133/4205 | 229/8465 | 5.94e-03 | 1.48e-02 | 7.56e-03 | 133 |
| hsa052319 | Esophagus | ESCC | Choline metabolism in cancer | 61/4205 | 98/8465 | 7.97e-03 | 1.92e-02 | 9.84e-03 | 61 |
| hsa041517 | Esophagus | ESCC | PI3K-Akt signaling pathway | 197/4205 | 354/8465 | 1.24e-02 | 2.83e-02 | 1.45e-02 | 197 |
| hsa0521517 | Esophagus | ESCC | Prostate cancer | 72/4205 | 97/8465 | 6.12e-07 | 4.10e-06 | 2.10e-06 | 72 |
| hsa04510111 | Esophagus | ESCC | Focal adhesion | 127/4205 | 203/8465 | 1.25e-04 | 4.99e-04 | 2.56e-04 | 127 |
| hsa0152115 | Esophagus | ESCC | EGFR tyrosine kinase inhibitor resistance | 55/4205 | 79/8465 | 2.44e-04 | 8.78e-04 | 4.50e-04 | 55 |
| hsa04810112 | Esophagus | ESCC | Regulation of actin cytoskeleton | 133/4205 | 229/8465 | 5.94e-03 | 1.48e-02 | 7.56e-03 | 133 |
| hsa0523114 | Esophagus | ESCC | Choline metabolism in cancer | 61/4205 | 98/8465 | 7.97e-03 | 1.92e-02 | 9.84e-03 | 61 |
| hsa0415114 | Esophagus | ESCC | PI3K-Akt signaling pathway | 197/4205 | 354/8465 | 1.24e-02 | 2.83e-02 | 1.45e-02 | 197 |
| hsa045108 | Lung | IAC | Focal adhesion | 59/1053 | 203/8465 | 1.31e-10 | 1.06e-08 | 7.06e-09 | 59 |
| hsa0481012 | Lung | IAC | Regulation of actin cytoskeleton | 49/1053 | 229/8465 | 7.94e-05 | 1.17e-03 | 7.79e-04 | 49 |
| hsa015217 | Lung | IAC | EGFR tyrosine kinase inhibitor resistance | 20/1053 | 79/8465 | 1.27e-03 | 8.24e-03 | 5.47e-03 | 20 |
| hsa052156 | Lung | IAC | Prostate cancer | 23/1053 | 97/8465 | 1.49e-03 | 9.23e-03 | 6.13e-03 | 23 |
| hsa052317 | Lung | IAC | Choline metabolism in cancer | 23/1053 | 98/8465 | 1.72e-03 | 9.66e-03 | 6.41e-03 | 23 |
| hsa041514 | Lung | IAC | PI3K-Akt signaling pathway | 60/1053 | 354/8465 | 7.03e-03 | 2.86e-02 | 1.90e-02 | 60 |
| hsa04072 | Lung | IAC | Phospholipase D signaling pathway | 28/1053 | 148/8465 | 1.46e-02 | 5.00e-02 | 3.32e-02 | 28 |
| hsa0451012 | Lung | IAC | Focal adhesion | 59/1053 | 203/8465 | 1.31e-10 | 1.06e-08 | 7.06e-09 | 59 |
| Page: 1 2 3 4 5 |
Top |
Cell-cell communication analysis |
| Identification of potential cell-cell interactions between two cell types and their ligand-receptor pairs for different disease states |
| Ligand | Receptor | LRpair | Pathway | Tissue | Disease Stage |
| PDGFC | PDGFRA | PDGFC_PDGFRA | PDGF | Breast | IDC |
| PDGFC | PDGFRA | PDGFC_PDGFRA | PDGF | Cervix | CC |
| PDGFC | PDGFRA | PDGFC_PDGFRA | PDGF | Cervix | Precancer |
| PDGFC | PDGFRA | PDGFC_PDGFRA | PDGF | CRC | AD |
| PDGFC | PDGFRA | PDGFC_PDGFRA | PDGF | CRC | ADJ |
| PDGFC | PDGFRA | PDGFC_PDGFRA | PDGF | CRC | CRC |
| PDGFC | PDGFRA | PDGFC_PDGFRA | PDGF | Endometrium | ADJ |
| PDGFC | PDGFRA | PDGFC_PDGFRA | PDGF | Endometrium | AEH |
| PDGFC | PDGFRA | PDGFC_PDGFRA | PDGF | Endometrium | EEC |
| PDGFC | PDGFRA | PDGFC_PDGFRA | PDGF | Esophagus | ESCC |
| PDGFC | PDGFRA | PDGFC_PDGFRA | PDGF | GC | ADJ |
| PDGFC | PDGFRA | PDGFC_PDGFRA | PDGF | HNSCC | OSCC |
| PDGFC | PDGFRA | PDGFC_PDGFRA | PDGF | Liver | Precancer |
| PDGFC | PDGFRA | PDGFC_PDGFRA | PDGF | Lung | ADJ |
| PDGFC | PDGFRA | PDGFC_PDGFRA | PDGF | Lung | AIS |
| PDGFC | PDGFRA | PDGFC_PDGFRA | PDGF | Lung | IAC |
| PDGFC | PDGFRA | PDGFC_PDGFRA | PDGF | Lung | MIAC |
| PDGFC | PDGFRA | PDGFC_PDGFRA | PDGF | Prostate | BPH |
| PDGFC | PDGFRA | PDGFC_PDGFRA | PDGF | Prostate | Tumor |
| PDGFC | PDGFRA | PDGFC_PDGFRA | PDGF | THCA | ADJ |
| Page: 1 2 |
Top |
Single-cell gene regulatory network inference analysis |
| Find out the significant the regulons (TFs) and the target genes of each regulon across cell types for different disease states |
| TF | Cell Type | Tissue | Disease Stage | Target Gene | RSS | Regulon Activity |
| ∗The dot plots of a searched regulon are shown for all cell subpopulations in each disease state of each tissue based on the regulon specific score inferred using pySCENIC and by calculating the average expression. |
| Page: 1 |
Top |
Somatic mutation of malignant transformation related genes |
| Annotation of somatic variants for genes involved in malignant transformation |
| Hugo Symbol | Variant Class | Variant Classification | dbSNP RS | HGVSc | HGVSp | HGVSp Short | SWISSPROT | BIOTYPE | SIFT | PolyPhen | Tumor Sample Barcode | Tissue | Histology | Sex | Age | Stage | Therapy Types | Drugs | Outcome |
| PDGFC | SNV | Missense_Mutation | novel | c.916C>T | p.His306Tyr | p.H306Y | Q9NRA1 | protein_coding | tolerated(0.05) | probably_damaging(0.996) | TCGA-3C-AALK-01 | Breast | breast invasive carcinoma | Female | <65 | I/II | Chemotherapy | docetaxel | SD |
| PDGFC | SNV | Missense_Mutation | c.592N>A | p.Asp198Asn | p.D198N | Q9NRA1 | protein_coding | deleterious(0.05) | benign(0.101) | TCGA-DS-A0VK-01 | Cervix | cervical & endocervical cancer | Female | <65 | I/II | Chemotherapy | carboplatin | PD | |
| PDGFC | SNV | Missense_Mutation | novel | c.126N>C | p.Gln42His | p.Q42H | Q9NRA1 | protein_coding | tolerated(0.19) | benign(0.007) | TCGA-VS-A9V4-01 | Cervix | cervical & endocervical cancer | Female | <65 | I/II | Chemotherapy | cisplatin | PD |
| PDGFC | SNV | Missense_Mutation | c.17N>G | p.Leu6Arg | p.L6R | Q9NRA1 | protein_coding | tolerated(0.08) | benign(0.293) | TCGA-A6-2686-01 | Colorectum | colon adenocarcinoma | Female | >=65 | I/II | Unknown | Unknown | SD | |
| PDGFC | SNV | Missense_Mutation | c.475C>A | p.His159Asn | p.H159N | Q9NRA1 | protein_coding | tolerated(0.14) | possibly_damaging(0.652) | TCGA-AA-3710-01 | Colorectum | colon adenocarcinoma | Female | >=65 | I/II | Unknown | Unknown | SD | |
| PDGFC | SNV | Missense_Mutation | c.765N>A | p.Phe255Leu | p.F255L | Q9NRA1 | protein_coding | tolerated(0.08) | probably_damaging(0.982) | TCGA-AA-A010-01 | Colorectum | colon adenocarcinoma | Female | <65 | I/II | Chemotherapy | folinic | CR | |
| PDGFC | SNV | Missense_Mutation | c.592N>A | p.Asp198Asn | p.D198N | Q9NRA1 | protein_coding | deleterious(0.05) | benign(0.101) | TCGA-AA-A02K-01 | Colorectum | colon adenocarcinoma | Male | <65 | III/IV | Chemotherapy | folinic | PD | |
| PDGFC | SNV | Missense_Mutation | novel | c.143N>A | p.Arg48Lys | p.R48K | Q9NRA1 | protein_coding | tolerated(0.63) | benign(0.003) | TCGA-AG-A002-01 | Colorectum | rectum adenocarcinoma | Male | <65 | I/II | Unknown | Unknown | SD |
| PDGFC | SNV | Missense_Mutation | novel | c.143G>T | p.Arg48Ile | p.R48I | Q9NRA1 | protein_coding | deleterious(0.01) | possibly_damaging(0.602) | TCGA-EI-6917-01 | Colorectum | rectum adenocarcinoma | Male | <65 | III/IV | Chemotherapy | 5fluorouracil+oxaciplatina+l-folinian | SD |
| PDGFC | SNV | Missense_Mutation | novel | c.698C>A | p.Ser233Tyr | p.S233Y | Q9NRA1 | protein_coding | tolerated(0.09) | possibly_damaging(0.459) | TCGA-F5-6814-01 | Colorectum | rectum adenocarcinoma | Male | <65 | I/II | Unknown | Unknown | SD |
| Page: 1 2 3 4 5 |
Top |
Related drugs of malignant transformation related genes |
| Identification of chemicals and drugs interact with genes involved in malignant transfromation |
| (DGIdb 4.0) |
| Entrez ID | Symbol | Category | Interaction Types | Drug Claim Name | Drug Name | PMIDs |
| 56034 | PDGFC | DRUGGABLE GENOME, CELL SURFACE, GROWTH FACTOR | inhibitor | SUNITINIB | SUNITINIB |
| Page: 1 |

Copyright 2023-Present -The University of Texas Health Science Center at Houston |