
|
|||||
|
 | |
| |
| |
| |
| |
| |
|
Gene: PDF |
Gene summary for PDF |
| Gene information | Species | Human | Gene symbol | Gene ID | 64146 |
| Gene name | peptide deformylase, mitochondrial | |
| Gene Alias | ||
| Cytomap | 16q22.1 | |
| Gene Type | protein-coding | GO ID | GO:0006412 | UniProtAcc | A0A024R6Y3 |
Top |
Malignant transformation analysis |
| Identification of the aberrant gene expression in precancerous and cancerous lesions by comparing the gene expression of stem-like cells in diseased tissues with normal stem cells |
| Entrez ID | Symbol | Replicates | Species | Organ | Tissue | Adj P-value | Log2FC | Malignancy |
| 64146 | LZE2T | Human | Esophagus | ESCC | 8.29e-03 | 4.00e-01 | 0.082 | |
| 64146 | LZE20T | Human | Esophagus | ESCC | 3.15e-03 | 1.16e-01 | 0.0662 | |
| 64146 | LZE24T | Human | Esophagus | ESCC | 3.04e-17 | 2.77e-01 | 0.0596 | |
| 64146 | LZE21T | Human | Esophagus | ESCC | 3.49e-02 | 1.67e-01 | 0.0655 | |
| 64146 | P1T-E | Human | Esophagus | ESCC | 4.66e-08 | 6.41e-01 | 0.0875 | |
| 64146 | P2T-E | Human | Esophagus | ESCC | 6.31e-08 | 1.88e-01 | 0.1177 | |
| 64146 | P4T-E | Human | Esophagus | ESCC | 7.60e-31 | 8.22e-01 | 0.1323 | |
| 64146 | P5T-E | Human | Esophagus | ESCC | 1.74e-15 | 4.57e-01 | 0.1327 | |
| 64146 | P8T-E | Human | Esophagus | ESCC | 4.47e-10 | 2.36e-01 | 0.0889 | |
| 64146 | P9T-E | Human | Esophagus | ESCC | 1.10e-08 | 2.51e-01 | 0.1131 | |
| 64146 | P10T-E | Human | Esophagus | ESCC | 9.36e-04 | 1.15e-01 | 0.116 | |
| 64146 | P11T-E | Human | Esophagus | ESCC | 4.29e-14 | 4.88e-01 | 0.1426 | |
| 64146 | P12T-E | Human | Esophagus | ESCC | 3.39e-09 | 1.88e-01 | 0.1122 | |
| 64146 | P15T-E | Human | Esophagus | ESCC | 2.03e-12 | 2.32e-01 | 0.1149 | |
| 64146 | P16T-E | Human | Esophagus | ESCC | 8.43e-10 | 2.70e-01 | 0.1153 | |
| 64146 | P17T-E | Human | Esophagus | ESCC | 1.03e-12 | 5.33e-01 | 0.1278 | |
| 64146 | P19T-E | Human | Esophagus | ESCC | 4.67e-06 | 4.48e-01 | 0.1662 | |
| 64146 | P20T-E | Human | Esophagus | ESCC | 5.75e-10 | 2.59e-01 | 0.1124 | |
| 64146 | P21T-E | Human | Esophagus | ESCC | 3.28e-34 | 6.89e-01 | 0.1617 | |
| 64146 | P22T-E | Human | Esophagus | ESCC | 1.01e-22 | 4.13e-01 | 0.1236 |
| Page: 1 2 3 4 |
| Tissue | Expression Dynamics | Abbreviation |
| Esophagus | 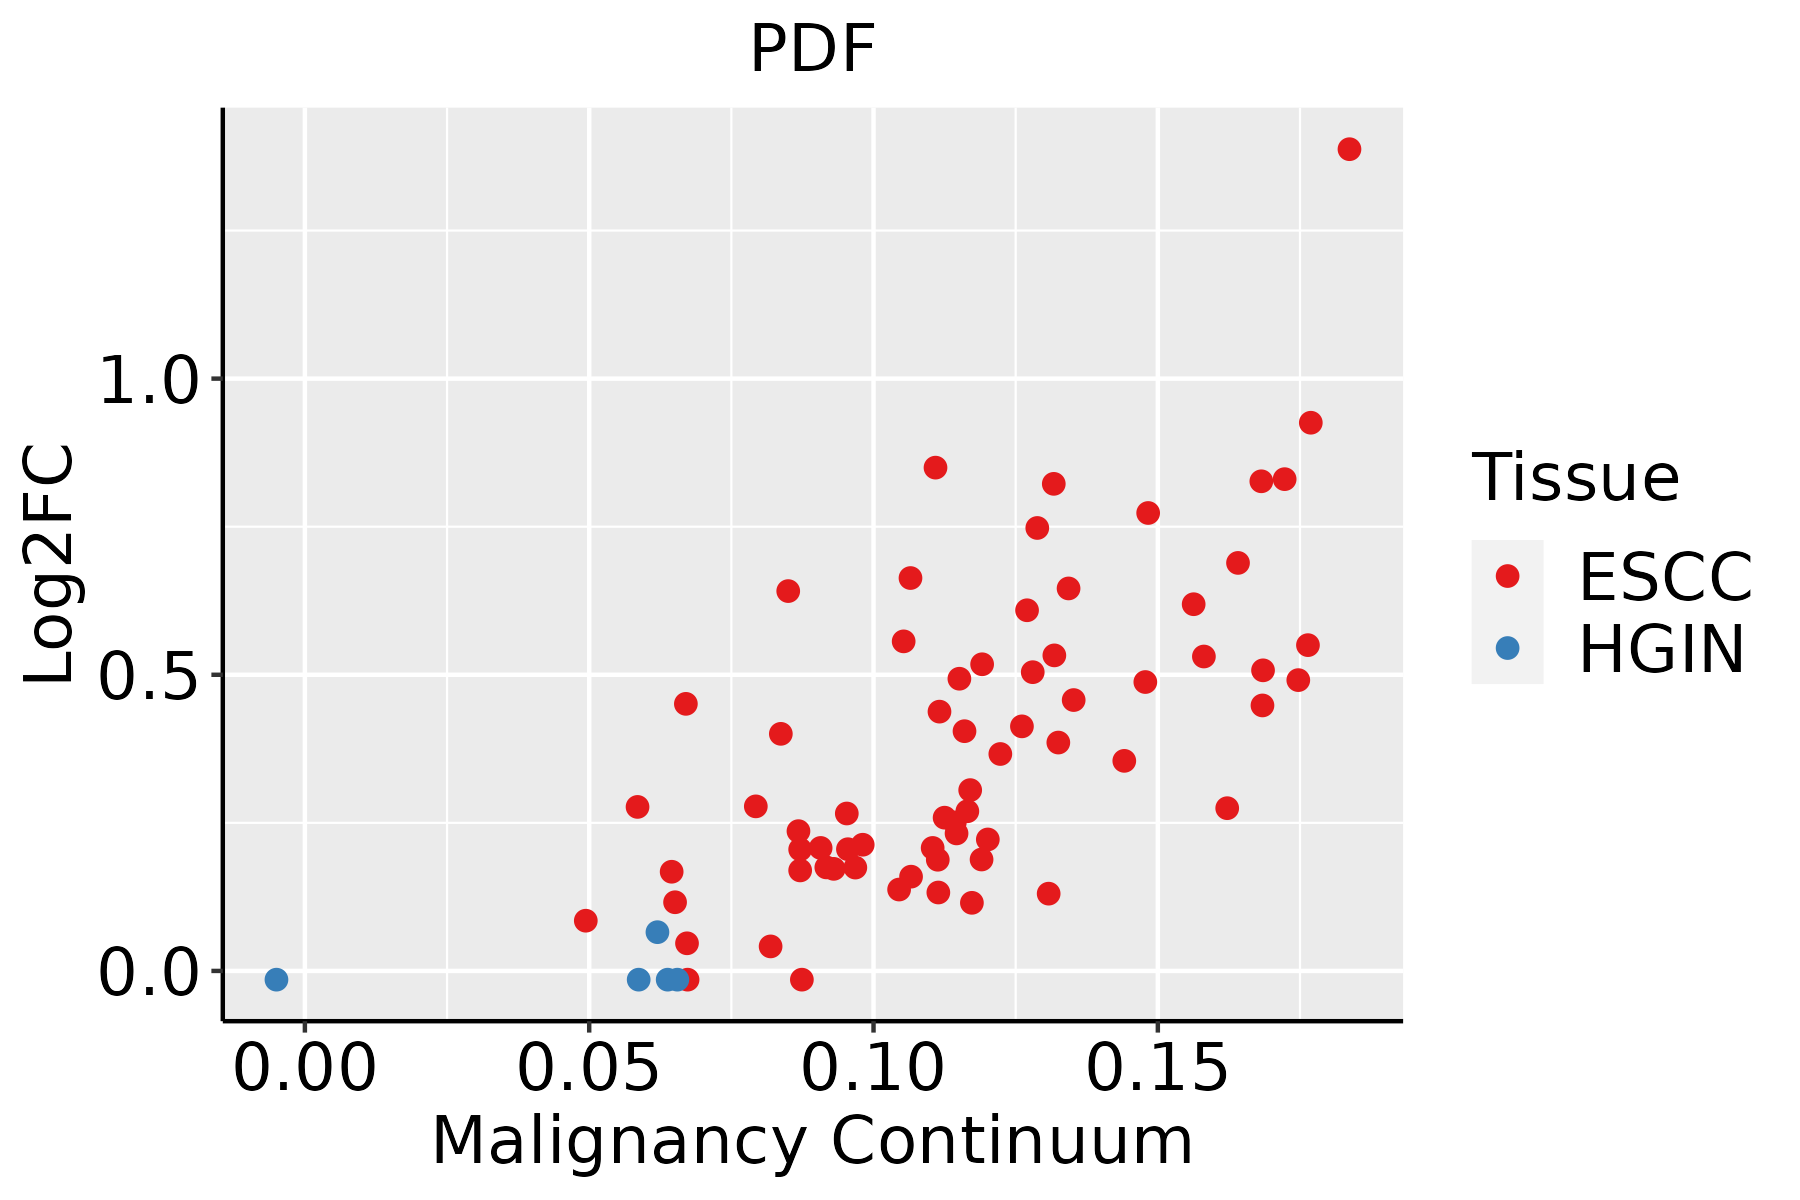 | ESCC: Esophageal squamous cell carcinoma |
| HGIN: High-grade intraepithelial neoplasias | ||
| LGIN: Low-grade intraepithelial neoplasias | ||
| Liver | 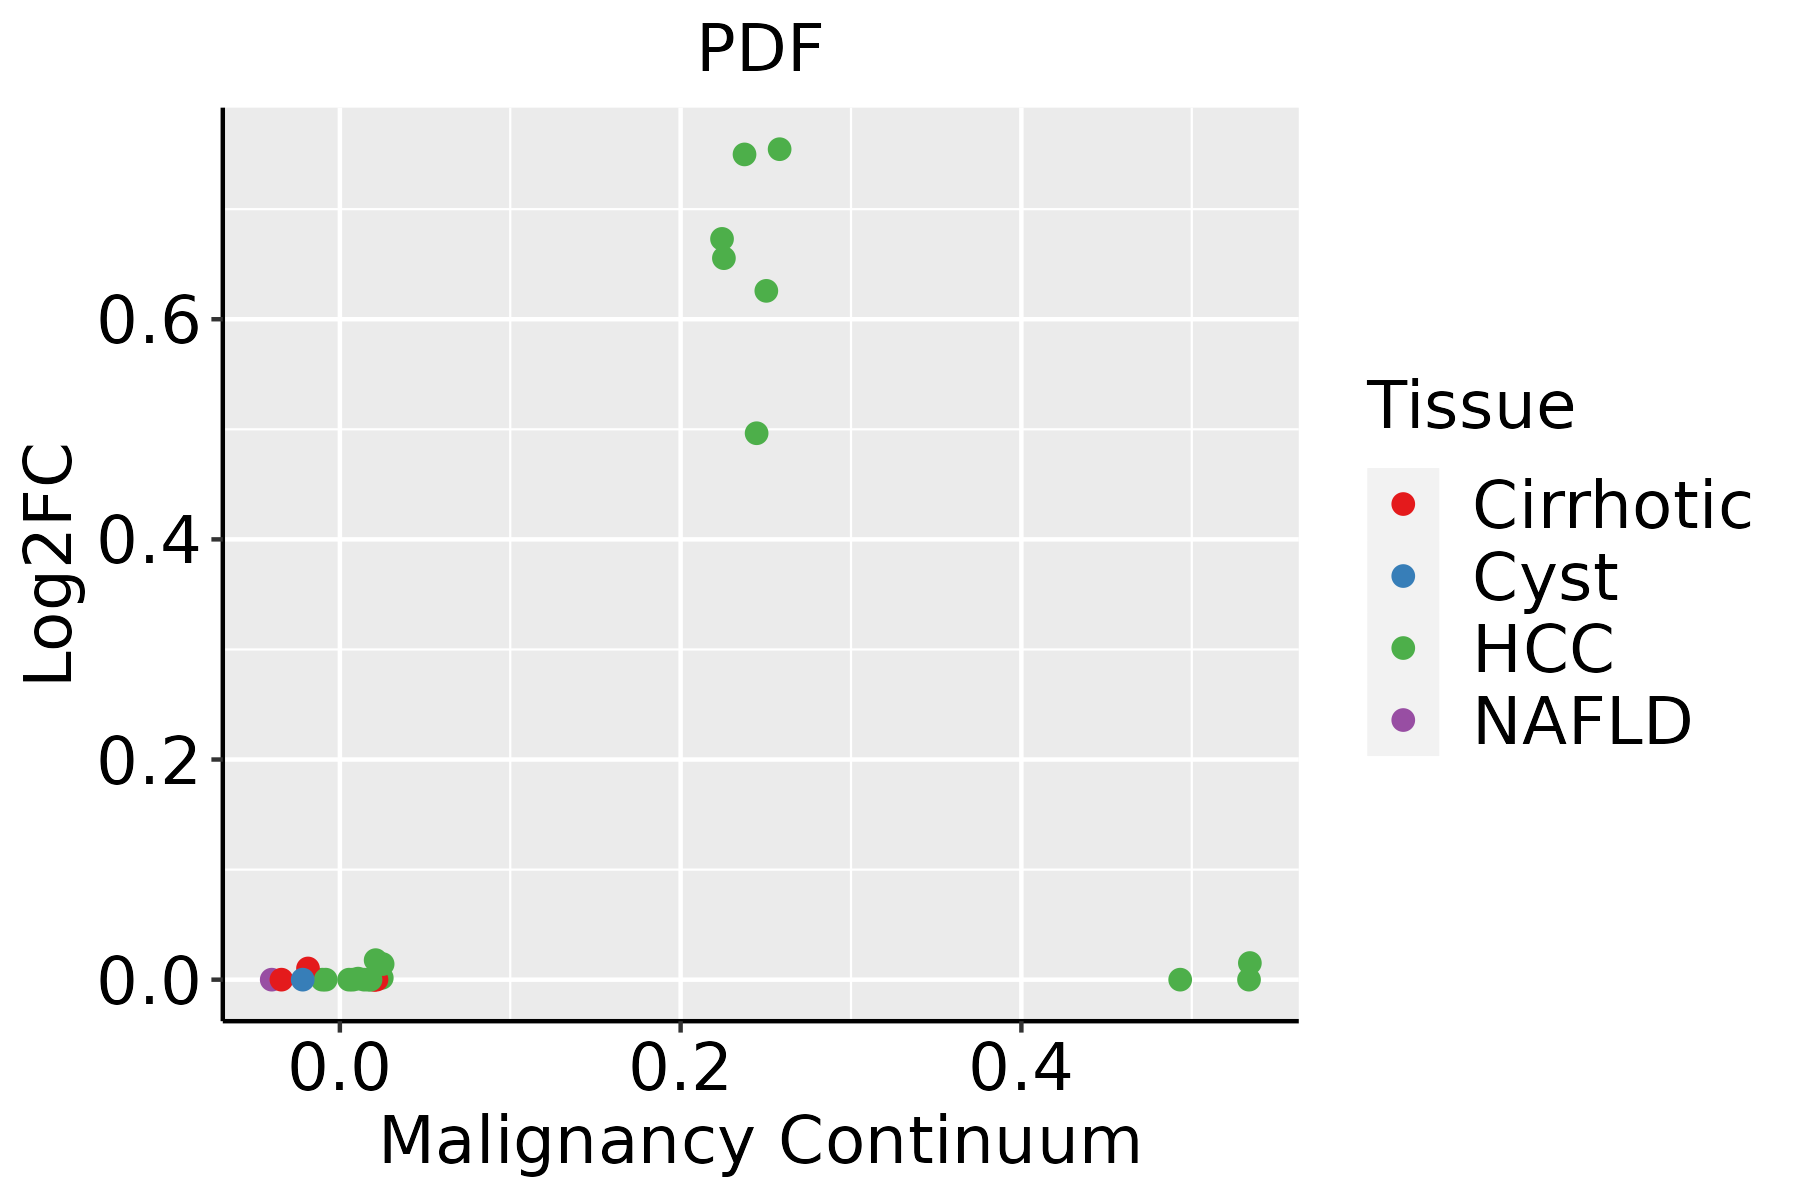 | HCC: Hepatocellular carcinoma |
| NAFLD: Non-alcoholic fatty liver disease |
| ∗log2FC in expression of this searched gene in stem-like cells from each diseased tissue sample relative to stem-like cells in normal samples in each tissue plotted against the malignancy continuum. Samples are colored based on if they are from different disease stage. |
Top |
Malignant transformation related pathway analysis |
| Find out the enriched GO biological processes and KEGG pathways involved in transition from healthy to precancer to cancer |
| Tissue | Disease Stage | Enriched GO biological Processes |
| Colorectum | AD |  |
| Colorectum | SER |  |
| Colorectum | MSS |  |
| Colorectum | MSI-H |  |
| Colorectum | FAP |  |
| ∗Top 15 enriched GO BP terms are showed in the bar plot of each disease state in each tissue. Each row represents a significant GO biological process which is colored according to the -log10(p.adjust). |
| Page: 1 2 3 4 5 6 7 8 9 |
| GO ID | Tissue | Disease Stage | Description | Gene Ratio | Bg Ratio | pvalue | p.adjust | Count |
| GO:00182061 | Esophagus | ESCC | peptidyl-methionine modification | 12/8552 | 13/18723 | 6.18e-04 | 3.32e-03 | 12 |
| GO:0031365 | Esophagus | ESCC | N-terminal protein amino acid modification | 21/8552 | 30/18723 | 6.17e-03 | 2.27e-02 | 21 |
| GO:0018206 | Liver | HCC | peptidyl-methionine modification | 10/7958 | 13/18723 | 1.28e-02 | 4.61e-02 | 10 |
| Page: 1 |
| Pathway ID | Tissue | Disease Stage | Description | Gene Ratio | Bg Ratio | pvalue | p.adjust | qvalue | Count |
| Page: 1 |
Top |
Cell-cell communication analysis |
| Identification of potential cell-cell interactions between two cell types and their ligand-receptor pairs for different disease states |
| Ligand | Receptor | LRpair | Pathway | Tissue | Disease Stage |
| Page: 1 |
Top |
Single-cell gene regulatory network inference analysis |
| Find out the significant the regulons (TFs) and the target genes of each regulon across cell types for different disease states |
| TF | Cell Type | Tissue | Disease Stage | Target Gene | RSS | Regulon Activity |
| ∗The dot plots of a searched regulon are shown for all cell subpopulations in each disease state of each tissue based on the regulon specific score inferred using pySCENIC and by calculating the average expression. |
| Page: 1 |
Top |
Somatic mutation of malignant transformation related genes |
| Annotation of somatic variants for genes involved in malignant transformation |
| Hugo Symbol | Variant Class | Variant Classification | dbSNP RS | HGVSc | HGVSp | HGVSp Short | SWISSPROT | BIOTYPE | SIFT | PolyPhen | Tumor Sample Barcode | Tissue | Histology | Sex | Age | Stage | Therapy Types | Drugs | Outcome |
| SNV | Missense_Mutation | novel | c.629N>A | p.Arg210His | p.R210H | Q9HBH1 | protein_coding | deleterious(0) | probably_damaging(1) | TCGA-B5-A1MR-01 | Endometrium | uterine corpus endometrioid carcinoma | Female | >=65 | III/IV | Unknown | Unknown | SD | |
| SNV | Missense_Mutation | rs577894071 | c.689N>A | p.Ser230Asn | p.S230N | Q9HBH1 | protein_coding | tolerated(0.17) | benign(0.172) | TCGA-EO-A3KX-01 | Endometrium | uterine corpus endometrioid carcinoma | Female | >=65 | I/II | Unknown | Unknown | SD | |
| SNV | Missense_Mutation | c.652C>A | p.His218Asn | p.H218N | Q9HBH1 | protein_coding | deleterious(0) | probably_damaging(1) | TCGA-DD-A39V-01 | Liver | liver hepatocellular carcinoma | Male | >=65 | I/II | Unknown | Unknown | PD | ||
| insertion | Frame_Shift_Ins | novel | c.701dupC | p.Asn235LysfsTer9 | p.N235Kfs*9 | Q9HBH1 | protein_coding | TCGA-CV-A45V-01 | Oral cavity | head & neck squamous cell carcinoma | Female | >=65 | I/II | Unknown | Unknown | SD | |||
| deletion | Frame_Shift_Del | novel | c.674_681delTTGACAAA | p.Ile225AsnfsTer16 | p.I225Nfs*16 | Q9HBH1 | protein_coding | TCGA-BR-A4J9-01 | Stomach | stomach adenocarcinoma | Male | <65 | I/II | Unknown | Unknown | SD |
| Page: 1 |
Top |
Related drugs of malignant transformation related genes |
| Identification of chemicals and drugs interact with genes involved in malignant transfromation |
| (DGIdb 4.0) |
| Entrez ID | Symbol | Category | Interaction Types | Drug Claim Name | Drug Name | PMIDs |
| 64146 | DRUGGABLE GENOME | Ustekinumab | USTEKINUMAB | |||
| 64146 | DRUGGABLE GENOME | PREMETREXED | ||||
| 64146 | DRUGGABLE GENOME | Proguanil | CHLOROGUANIDE | |||
| 64146 | DRUGGABLE GENOME | Chlorproguanil | CHLORPROGUANIL | |||
| 64146 | DRUGGABLE GENOME | Meprobamate | MEPROBAMATE | |||
| 64146 | DRUGGABLE GENOME | MCB-3837 | ||||
| 64146 | DRUGGABLE GENOME | Trimetrexate | TRIMETREXATE | |||
| 64146 | DRUGGABLE GENOME | Pralatrexate | PRALATREXATE | |||
| 64146 | DRUGGABLE GENOME | Metoprine | METOPRINE | |||
| 64146 | DRUGGABLE GENOME | LY333531 |
| Page: 1 |

Copyright 2023-Present -The University of Texas Health Science Center at Houston |