
|
|||||
|
 | |
| |
| |
| |
| |
| |
|
Gene: PDE9A |
Gene summary for PDE9A |
| Gene information | Species | Human | Gene symbol | PDE9A | Gene ID | 5152 |
| Gene name | phosphodiesterase 9A | |
| Gene Alias | HSPDE9A2 | |
| Cytomap | 21q22.3 | |
| Gene Type | protein-coding | GO ID | GO:0003008 | UniProtAcc | A0A0S2Z4A3 |
Top |
Malignant transformation analysis |
| Identification of the aberrant gene expression in precancerous and cancerous lesions by comparing the gene expression of stem-like cells in diseased tissues with normal stem cells |
| Entrez ID | Symbol | Replicates | Species | Organ | Tissue | Adj P-value | Log2FC | Malignancy |
| 5152 | PDE9A | HTA11_3410_2000001011 | Human | Colorectum | AD | 2.30e-18 | -6.84e-01 | 0.0155 |
| 5152 | PDE9A | HTA11_2112_2000001011 | Human | Colorectum | SER | 2.95e-07 | -5.51e-02 | -0.2196 |
| 5152 | PDE9A | HTA11_6818_2000001021 | Human | Colorectum | AD | 1.50e-03 | -5.29e-01 | 0.0588 |
| 5152 | PDE9A | HTA11_99999970781_79442 | Human | Colorectum | MSS | 4.98e-25 | -7.03e-01 | 0.294 |
| 5152 | PDE9A | HTA11_99999965104_69814 | Human | Colorectum | MSS | 3.90e-12 | -7.93e-01 | 0.281 |
| 5152 | PDE9A | HTA11_99999971662_82457 | Human | Colorectum | MSS | 8.21e-14 | -5.48e-01 | 0.3859 |
| 5152 | PDE9A | HTA11_99999973899_84307 | Human | Colorectum | MSS | 1.85e-12 | -8.67e-01 | 0.2585 |
| 5152 | PDE9A | HTA11_99999974143_84620 | Human | Colorectum | MSS | 1.45e-22 | -7.02e-01 | 0.3005 |
| 5152 | PDE9A | F007 | Human | Colorectum | FAP | 2.06e-20 | -8.16e-01 | 0.1176 |
| 5152 | PDE9A | A002-C-010 | Human | Colorectum | FAP | 1.29e-17 | -5.72e-01 | 0.242 |
| 5152 | PDE9A | A001-C-207 | Human | Colorectum | FAP | 5.45e-15 | -6.03e-01 | 0.1278 |
| 5152 | PDE9A | A015-C-203 | Human | Colorectum | FAP | 1.88e-31 | -5.42e-01 | -0.1294 |
| 5152 | PDE9A | A015-C-204 | Human | Colorectum | FAP | 4.08e-15 | -5.97e-01 | -0.0228 |
| 5152 | PDE9A | A014-C-040 | Human | Colorectum | FAP | 1.37e-07 | -5.77e-01 | -0.1184 |
| 5152 | PDE9A | A002-C-201 | Human | Colorectum | FAP | 4.94e-27 | -6.71e-01 | 0.0324 |
| 5152 | PDE9A | A002-C-203 | Human | Colorectum | FAP | 2.13e-11 | -4.75e-01 | 0.2786 |
| 5152 | PDE9A | A001-C-119 | Human | Colorectum | FAP | 6.35e-09 | -4.88e-01 | -0.1557 |
| 5152 | PDE9A | A001-C-108 | Human | Colorectum | FAP | 4.73e-18 | -4.42e-01 | -0.0272 |
| 5152 | PDE9A | A002-C-205 | Human | Colorectum | FAP | 4.87e-33 | -7.18e-01 | -0.1236 |
| 5152 | PDE9A | A001-C-104 | Human | Colorectum | FAP | 1.10e-05 | -2.83e-01 | 0.0184 |
| Page: 1 2 |
| Tissue | Expression Dynamics | Abbreviation |
| Colorectum (GSE201348) |  | FAP: Familial adenomatous polyposis |
| CRC: Colorectal cancer | ||
| Colorectum (HTA11) |  | AD: Adenomas |
| SER: Sessile serrated lesions | ||
| MSI-H: Microsatellite-high colorectal cancer | ||
| MSS: Microsatellite stable colorectal cancer | ||
| Prostate | 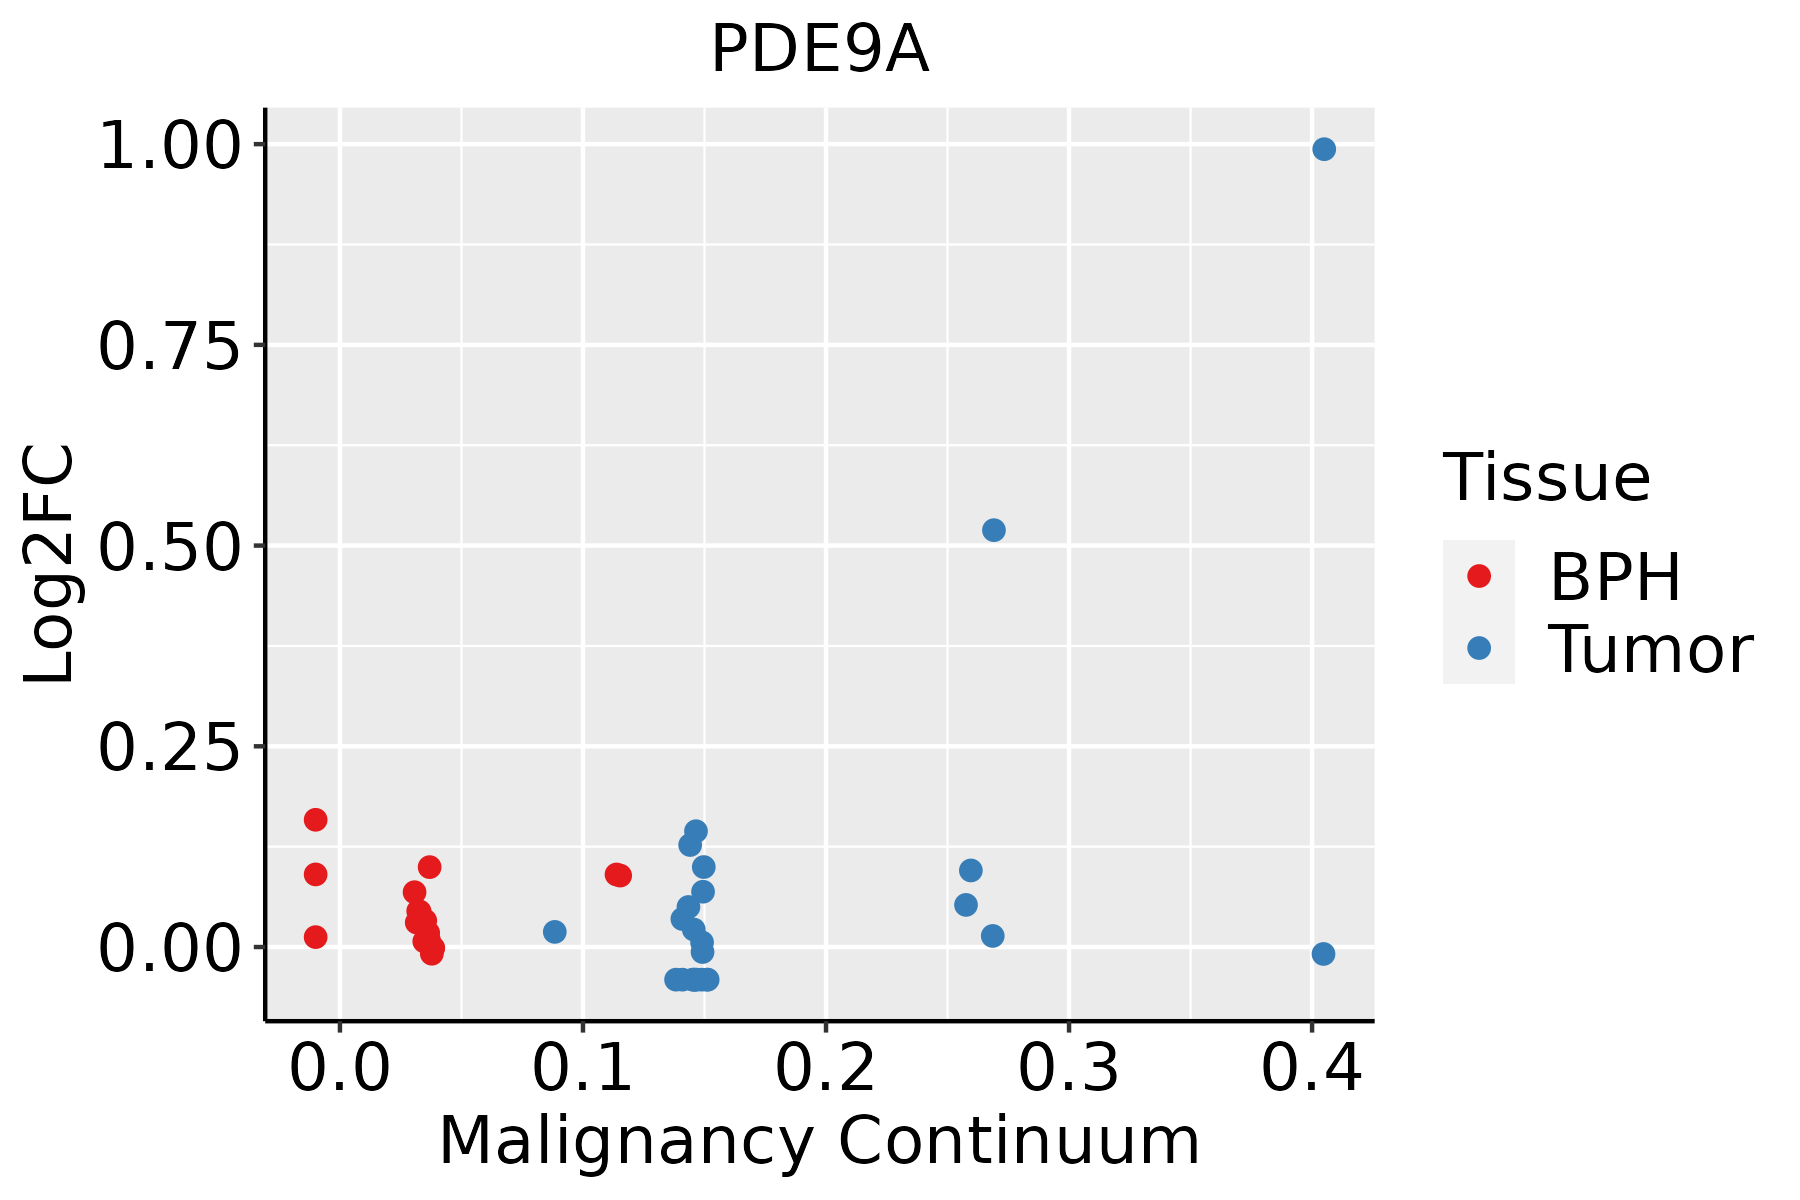 | BPH: Benign Prostatic Hyperplasia |
| ∗log2FC in expression of this searched gene in stem-like cells from each diseased tissue sample relative to stem-like cells in normal samples in each tissue plotted against the malignancy continuum. Samples are colored based on if they are from different disease stage. |
Top |
Malignant transformation related pathway analysis |
| Find out the enriched GO biological processes and KEGG pathways involved in transition from healthy to precancer to cancer |
| Tissue | Disease Stage | Enriched GO biological Processes |
| Colorectum | AD |  |
| Colorectum | SER |  |
| Colorectum | MSS |  |
| Colorectum | MSI-H |  |
| Colorectum | FAP |  |
| ∗Top 15 enriched GO BP terms are showed in the bar plot of each disease state in each tissue. Each row represents a significant GO biological process which is colored according to the -log10(p.adjust). |
| Page: 1 2 3 4 5 6 7 8 9 |
| GO ID | Tissue | Disease Stage | Description | Gene Ratio | Bg Ratio | pvalue | p.adjust | Count |
| GO:0009150 | Colorectum | AD | purine ribonucleotide metabolic process | 142/3918 | 368/18723 | 4.29e-15 | 1.17e-12 | 142 |
| GO:0006163 | Colorectum | AD | purine nucleotide metabolic process | 149/3918 | 396/18723 | 1.08e-14 | 2.80e-12 | 149 |
| GO:0072521 | Colorectum | AD | purine-containing compound metabolic process | 153/3918 | 416/18723 | 4.34e-14 | 1.01e-11 | 153 |
| GO:0009259 | Colorectum | AD | ribonucleotide metabolic process | 144/3918 | 385/18723 | 5.25e-14 | 1.13e-11 | 144 |
| GO:0019693 | Colorectum | AD | ribose phosphate metabolic process | 145/3918 | 396/18723 | 3.01e-13 | 5.71e-11 | 145 |
| GO:0009117 | Colorectum | AD | nucleotide metabolic process | 168/3918 | 489/18723 | 2.20e-12 | 3.36e-10 | 168 |
| GO:0006753 | Colorectum | AD | nucleoside phosphate metabolic process | 169/3918 | 497/18723 | 4.99e-12 | 6.98e-10 | 169 |
| GO:0044270 | Colorectum | AD | cellular nitrogen compound catabolic process | 147/3918 | 451/18723 | 3.35e-09 | 2.23e-07 | 147 |
| GO:0046700 | Colorectum | AD | heterocycle catabolic process | 145/3918 | 445/18723 | 4.37e-09 | 2.84e-07 | 145 |
| GO:0034655 | Colorectum | AD | nucleobase-containing compound catabolic process | 133/3918 | 407/18723 | 1.56e-08 | 9.12e-07 | 133 |
| GO:0019439 | Colorectum | AD | aromatic compound catabolic process | 146/3918 | 467/18723 | 7.48e-08 | 3.84e-06 | 146 |
| GO:1901361 | Colorectum | AD | organic cyclic compound catabolic process | 153/3918 | 495/18723 | 8.23e-08 | 4.18e-06 | 153 |
| GO:0090257 | Colorectum | AD | regulation of muscle system process | 73/3918 | 252/18723 | 1.46e-03 | 1.24e-02 | 73 |
| GO:0006195 | Colorectum | AD | purine nucleotide catabolic process | 18/3918 | 46/18723 | 3.67e-03 | 2.60e-02 | 18 |
| GO:0072523 | Colorectum | AD | purine-containing compound catabolic process | 19/3918 | 52/18723 | 6.92e-03 | 4.26e-02 | 19 |
| GO:0043502 | Colorectum | AD | regulation of muscle adaptation | 31/3918 | 98/18723 | 8.45e-03 | 4.94e-02 | 31 |
| GO:00061631 | Colorectum | SER | purine nucleotide metabolic process | 109/2897 | 396/18723 | 4.26e-10 | 5.44e-08 | 109 |
| GO:00091501 | Colorectum | SER | purine ribonucleotide metabolic process | 103/2897 | 368/18723 | 4.69e-10 | 5.68e-08 | 103 |
| GO:00725211 | Colorectum | SER | purine-containing compound metabolic process | 113/2897 | 416/18723 | 4.80e-10 | 5.68e-08 | 113 |
| GO:00092591 | Colorectum | SER | ribonucleotide metabolic process | 104/2897 | 385/18723 | 3.27e-09 | 3.04e-07 | 104 |
| Page: 1 2 3 4 5 6 |
| Pathway ID | Tissue | Disease Stage | Description | Gene Ratio | Bg Ratio | pvalue | p.adjust | qvalue | Count |
| Page: 1 |
Top |
Cell-cell communication analysis |
| Identification of potential cell-cell interactions between two cell types and their ligand-receptor pairs for different disease states |
| Ligand | Receptor | LRpair | Pathway | Tissue | Disease Stage |
| Page: 1 |
Top |
Single-cell gene regulatory network inference analysis |
| Find out the significant the regulons (TFs) and the target genes of each regulon across cell types for different disease states |
| TF | Cell Type | Tissue | Disease Stage | Target Gene | RSS | Regulon Activity |
| ∗The dot plots of a searched regulon are shown for all cell subpopulations in each disease state of each tissue based on the regulon specific score inferred using pySCENIC and by calculating the average expression. |
| Page: 1 |
Top |
Somatic mutation of malignant transformation related genes |
| Annotation of somatic variants for genes involved in malignant transformation |
| Hugo Symbol | Variant Class | Variant Classification | dbSNP RS | HGVSc | HGVSp | HGVSp Short | SWISSPROT | BIOTYPE | SIFT | PolyPhen | Tumor Sample Barcode | Tissue | Histology | Sex | Age | Stage | Therapy Types | Drugs | Outcome |
| PDE9A | SNV | Missense_Mutation | novel | c.926N>C | p.Asn309Thr | p.N309T | O76083 | protein_coding | tolerated(0.41) | possibly_damaging(0.662) | TCGA-AC-A23E-01 | Breast | breast invasive carcinoma | Female | <65 | I/II | Hormone Therapy | tamoxiphen | SD |
| PDE9A | SNV | Missense_Mutation | rs765570911 | c.1127N>G | p.Asn376Ser | p.N376S | O76083 | protein_coding | deleterious(0.02) | probably_damaging(0.932) | TCGA-BH-A1EU-01 | Breast | breast invasive carcinoma | Female | >=65 | I/II | Unknown | Unknown | SD |
| PDE9A | SNV | Missense_Mutation | rs188819062 | c.787G>A | p.Val263Ile | p.V263I | O76083 | protein_coding | tolerated(0.35) | benign(0.003) | TCGA-LL-A50Y-01 | Breast | breast invasive carcinoma | Female | >=65 | I/II | Hormone Therapy | arimidex | CR |
| PDE9A | deletion | Frame_Shift_Del | c.240delN | p.Val81TrpfsTer26 | p.V81Wfs*26 | O76083 | protein_coding | TCGA-A8-A09K-01 | Breast | breast invasive carcinoma | Female | >=65 | I/II | Unknown | Unknown | SD | |||
| PDE9A | SNV | Missense_Mutation | rs770883595 | c.205N>A | p.Ala69Thr | p.A69T | O76083 | protein_coding | tolerated(0.32) | benign(0.015) | TCGA-EA-A410-01 | Cervix | cervical & endocervical cancer | Female | <65 | I/II | Unknown | Unknown | SD |
| PDE9A | SNV | Missense_Mutation | rs781169820 | c.1280G>T | p.Arg427Ile | p.R427I | O76083 | protein_coding | deleterious(0) | benign(0.1) | TCGA-JX-A3Q0-01 | Cervix | cervical & endocervical cancer | Female | <65 | III/IV | Unknown | Unknown | SD |
| PDE9A | SNV | Missense_Mutation | novel | c.1136N>T | p.Ser379Leu | p.S379L | O76083 | protein_coding | deleterious(0) | probably_damaging(0.999) | TCGA-MA-AA43-01 | Cervix | cervical & endocervical cancer | Female | <65 | III/IV | Unknown | Unknown | SD |
| PDE9A | SNV | Missense_Mutation | rs766492657 | c.712N>T | p.Arg238Cys | p.R238C | O76083 | protein_coding | deleterious(0.02) | benign(0.037) | TCGA-5M-AAT6-01 | Colorectum | colon adenocarcinoma | Female | <65 | III/IV | Unknown | Unknown | PD |
| PDE9A | SNV | Missense_Mutation | rs139833833 | c.431N>A | p.Arg144His | p.R144H | O76083 | protein_coding | tolerated(0.26) | benign(0.031) | TCGA-AA-3663-01 | Colorectum | colon adenocarcinoma | Male | <65 | I/II | Unknown | Unknown | SD |
| PDE9A | SNV | Missense_Mutation | c.1518A>C | p.Lys506Asn | p.K506N | O76083 | protein_coding | deleterious(0) | probably_damaging(0.998) | TCGA-AA-3864-01 | Colorectum | colon adenocarcinoma | Male | >=65 | I/II | Unknown | Unknown | SD |
| Page: 1 2 3 4 5 6 7 8 |
Top |
Related drugs of malignant transformation related genes |
| Identification of chemicals and drugs interact with genes involved in malignant transfromation |
| (DGIdb 4.0) |
| Entrez ID | Symbol | Category | Interaction Types | Drug Claim Name | Drug Name | PMIDs |
| 5152 | PDE9A | DRUGGABLE GENOME, ENZYME | inhibitor | CHEMBL628 | PENTOXIFYLLINE | |
| 5152 | PDE9A | DRUGGABLE GENOME, ENZYME | inhibitor | 135651355 | ZAPRINAST | |
| 5152 | PDE9A | DRUGGABLE GENOME, ENZYME | inhibitor | CHEMBL932 | DIPYRIDAMOLE | |
| 5152 | PDE9A | DRUGGABLE GENOME, ENZYME | inhibitor | 178101953 |
| Page: 1 |

Copyright 2023-Present -The University of Texas Health Science Center at Houston |