
|
|||||
|
 | |
| |
| |
| |
| |
| |
|
Gene: PDE8A |
Gene summary for PDE8A |
| Gene information | Species | Human | Gene symbol | PDE8A | Gene ID | 5151 |
| Gene name | phosphodiesterase 8A | |
| Gene Alias | HsT19550 | |
| Cytomap | 15q25.3 | |
| Gene Type | protein-coding | GO ID | GO:0000165 | UniProtAcc | O60658 |
Top |
Malignant transformation analysis |
| Identification of the aberrant gene expression in precancerous and cancerous lesions by comparing the gene expression of stem-like cells in diseased tissues with normal stem cells |
| Entrez ID | Symbol | Replicates | Species | Organ | Tissue | Adj P-value | Log2FC | Malignancy |
| 5151 | PDE8A | CCI_1 | Human | Cervix | CC | 2.75e-11 | 1.17e+00 | 0.528 |
| 5151 | PDE8A | CCI_3 | Human | Cervix | CC | 3.33e-08 | 4.78e-01 | 0.516 |
| 5151 | PDE8A | HTA11_3410_2000001011 | Human | Colorectum | AD | 1.53e-50 | -1.02e+00 | 0.0155 |
| 5151 | PDE8A | HTA11_2951_2000001011 | Human | Colorectum | AD | 4.24e-14 | -9.97e-01 | 0.0216 |
| 5151 | PDE8A | HTA11_347_2000001011 | Human | Colorectum | AD | 3.14e-15 | 7.83e-01 | -0.1954 |
| 5151 | PDE8A | HTA11_3361_2000001011 | Human | Colorectum | AD | 1.08e-05 | -5.55e-01 | -0.1207 |
| 5151 | PDE8A | HTA11_696_2000001011 | Human | Colorectum | AD | 1.86e-05 | -2.95e-01 | -0.1464 |
| 5151 | PDE8A | HTA11_5212_2000001011 | Human | Colorectum | AD | 2.88e-03 | -4.38e-01 | -0.2061 |
| 5151 | PDE8A | HTA11_866_3004761011 | Human | Colorectum | AD | 1.55e-39 | -9.13e-01 | 0.096 |
| 5151 | PDE8A | HTA11_9408_2000001011 | Human | Colorectum | AD | 3.33e-09 | -9.96e-01 | 0.0451 |
| 5151 | PDE8A | HTA11_8622_2000001021 | Human | Colorectum | SER | 8.58e-15 | -9.36e-01 | 0.0528 |
| 5151 | PDE8A | HTA11_10711_2000001011 | Human | Colorectum | AD | 8.87e-20 | -8.25e-01 | 0.0338 |
| 5151 | PDE8A | HTA11_7696_3000711011 | Human | Colorectum | AD | 5.92e-33 | -7.40e-01 | 0.0674 |
| 5151 | PDE8A | HTA11_11156_2000001011 | Human | Colorectum | AD | 6.01e-03 | -8.62e-01 | 0.0397 |
| 5151 | PDE8A | HTA11_6818_2000001021 | Human | Colorectum | AD | 1.02e-22 | -8.24e-01 | 0.0588 |
| 5151 | PDE8A | HTA11_99999970781_79442 | Human | Colorectum | MSS | 4.76e-52 | -9.66e-01 | 0.294 |
| 5151 | PDE8A | HTA11_99999971662_82457 | Human | Colorectum | MSS | 8.48e-42 | -8.39e-01 | 0.3859 |
| 5151 | PDE8A | HTA11_99999973899_84307 | Human | Colorectum | MSS | 9.93e-10 | -7.73e-01 | 0.2585 |
| 5151 | PDE8A | HTA11_99999974143_84620 | Human | Colorectum | MSS | 5.79e-43 | -9.15e-01 | 0.3005 |
| 5151 | PDE8A | F007 | Human | Colorectum | FAP | 2.35e-15 | -7.62e-01 | 0.1176 |
| Page: 1 2 3 4 5 |
| Tissue | Expression Dynamics | Abbreviation |
| Cervix | 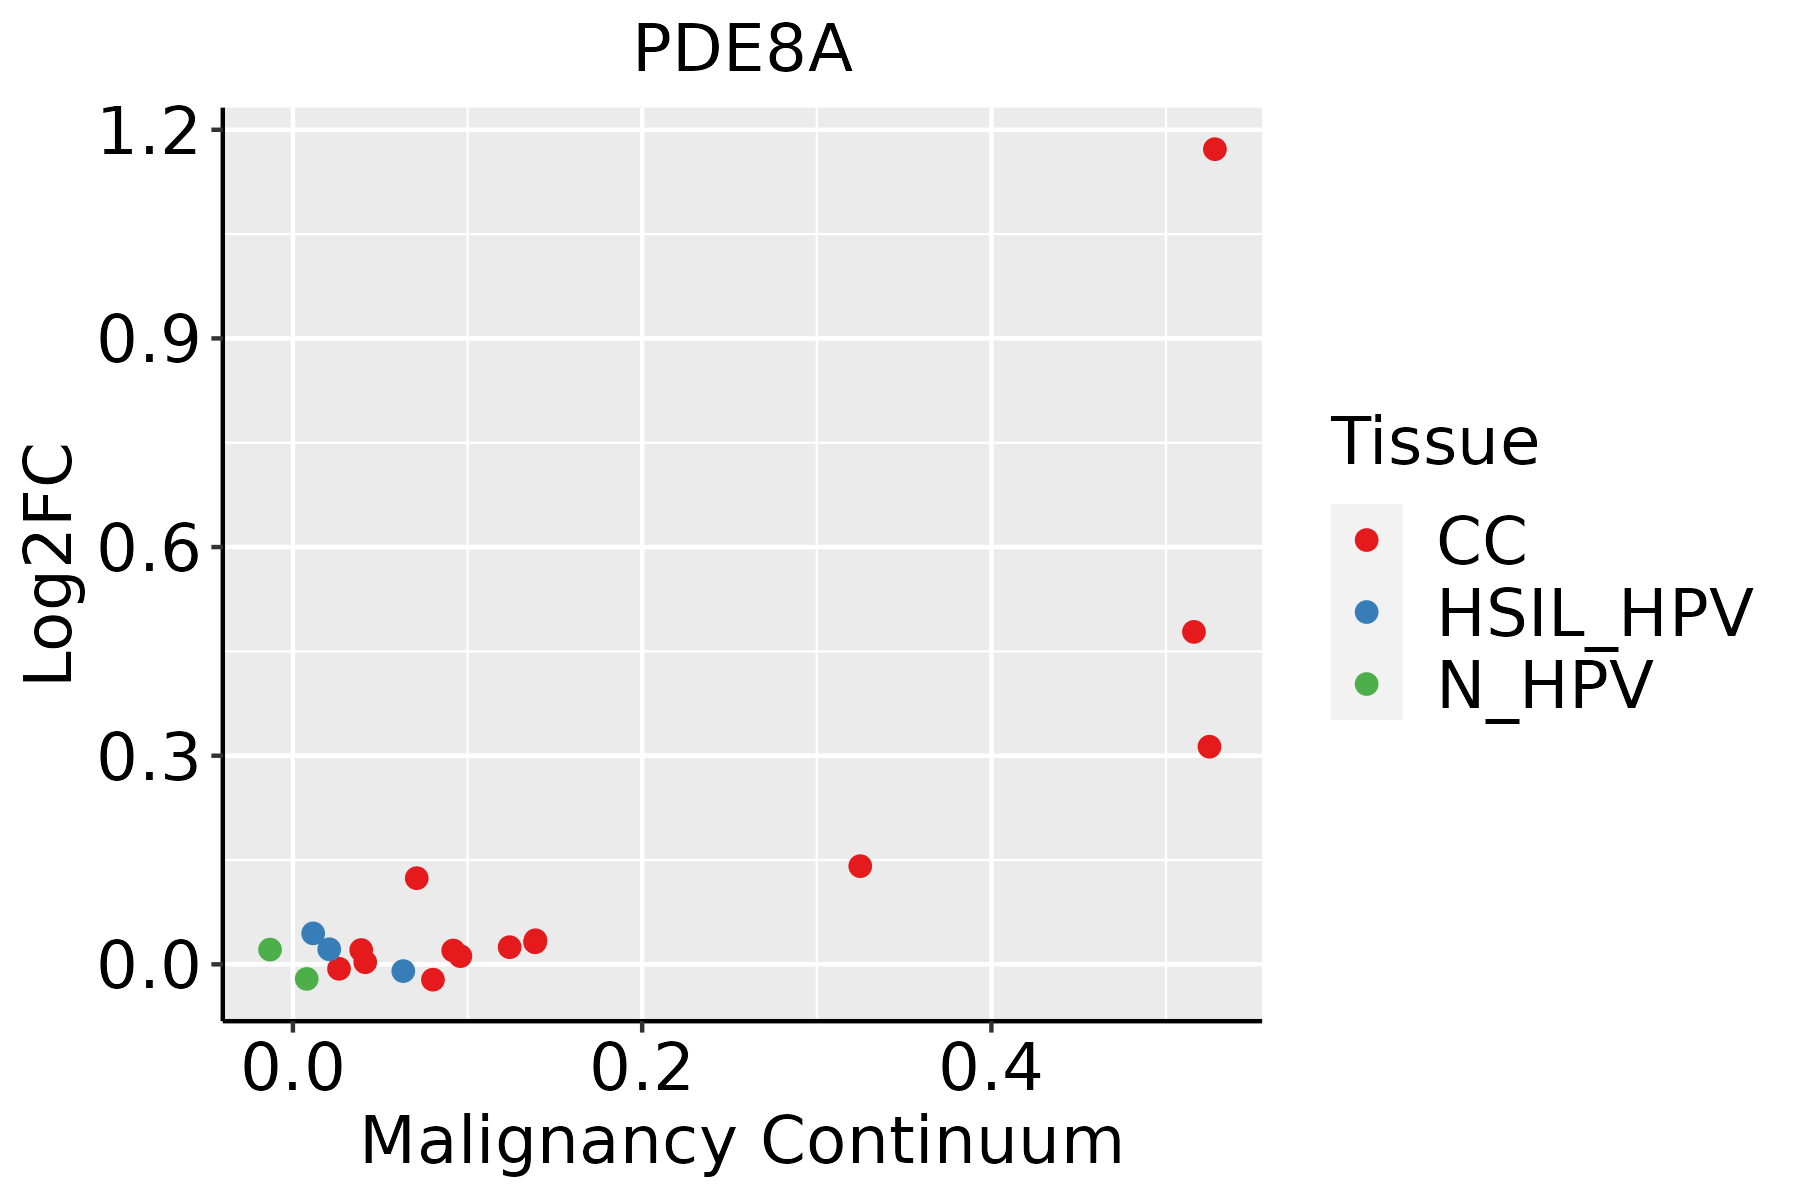 | CC: Cervix cancer |
| HSIL_HPV: HPV-infected high-grade squamous intraepithelial lesions | ||
| N_HPV: HPV-infected normal cervix | ||
| Colorectum (GSE201348) |  | FAP: Familial adenomatous polyposis |
| CRC: Colorectal cancer | ||
| Colorectum (HTA11) |  | AD: Adenomas |
| SER: Sessile serrated lesions | ||
| MSI-H: Microsatellite-high colorectal cancer | ||
| MSS: Microsatellite stable colorectal cancer | ||
| Lung | 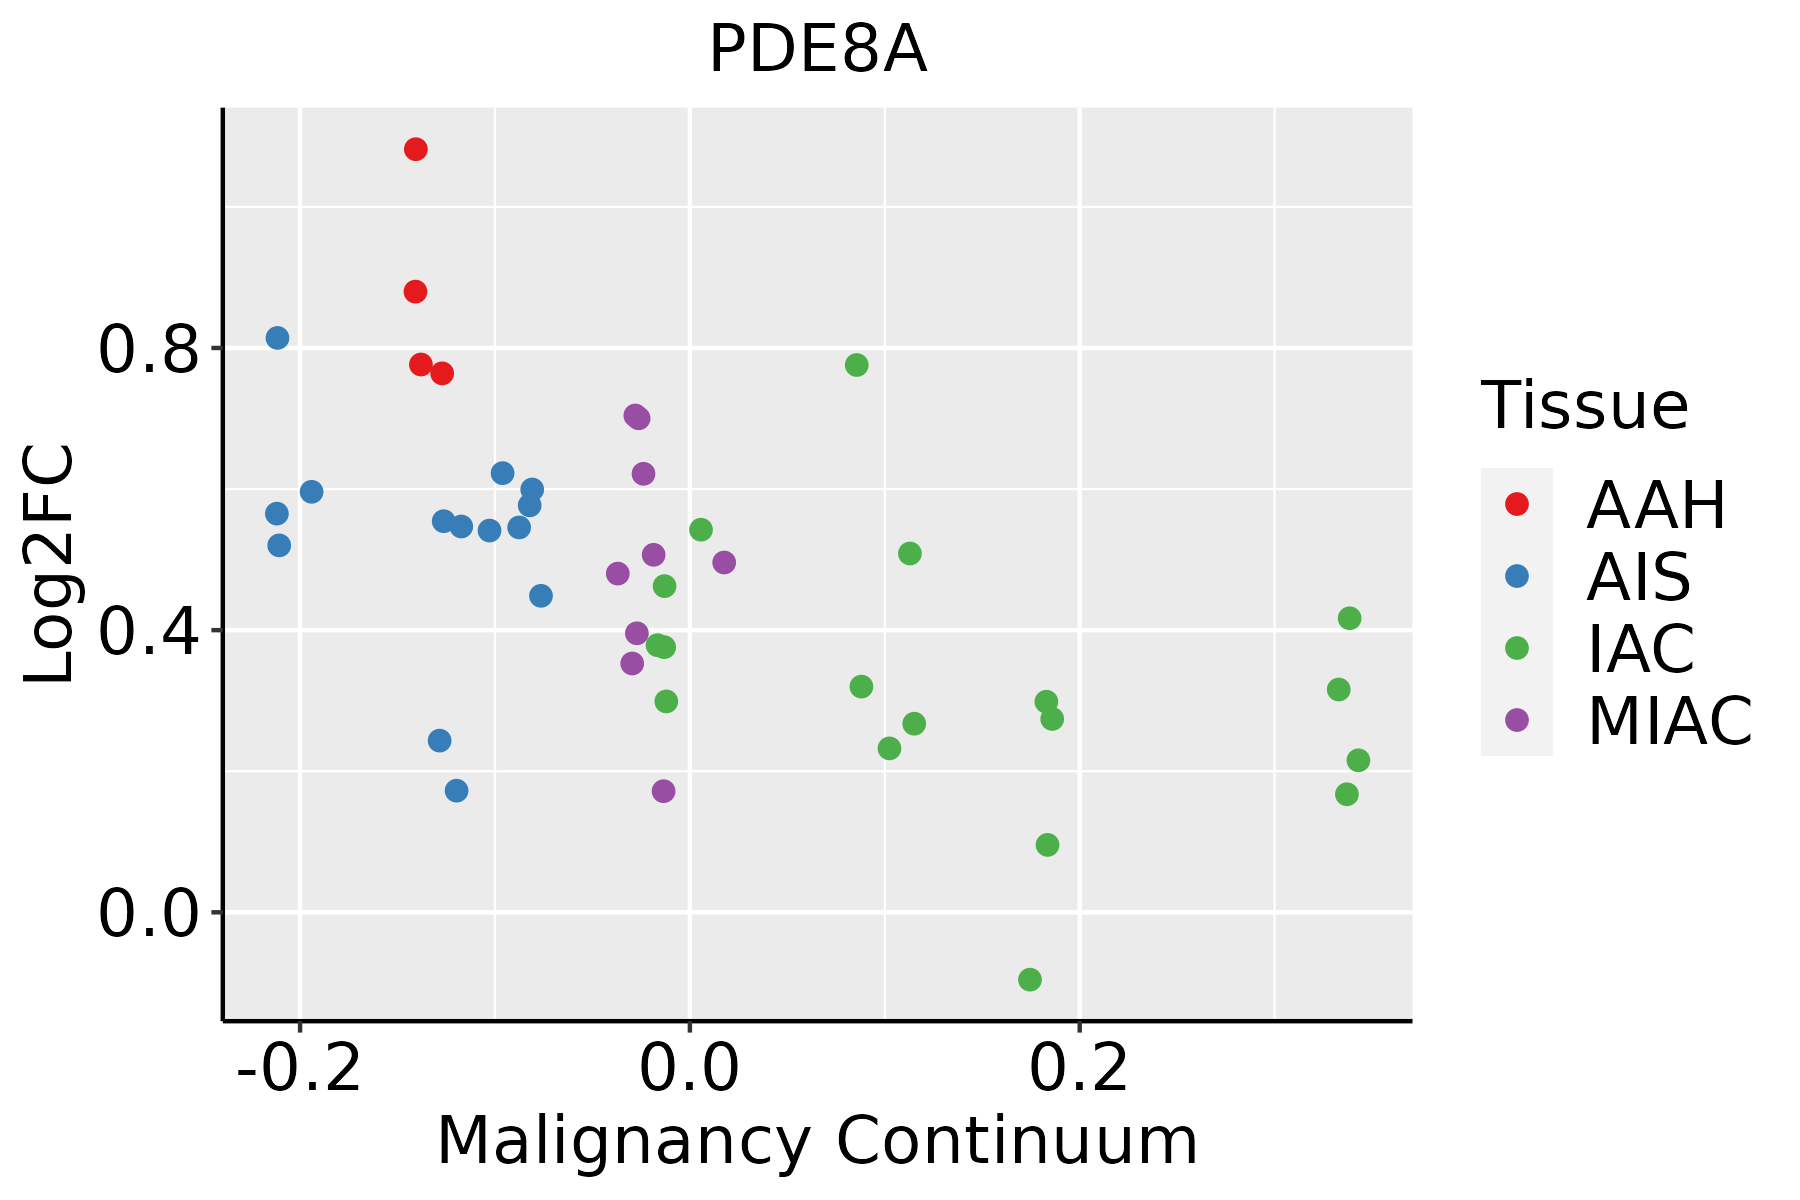 | AAH: Atypical adenomatous hyperplasia |
| AIS: Adenocarcinoma in situ | ||
| IAC: Invasive lung adenocarcinoma | ||
| MIA: Minimally invasive adenocarcinoma | ||
| Prostate | 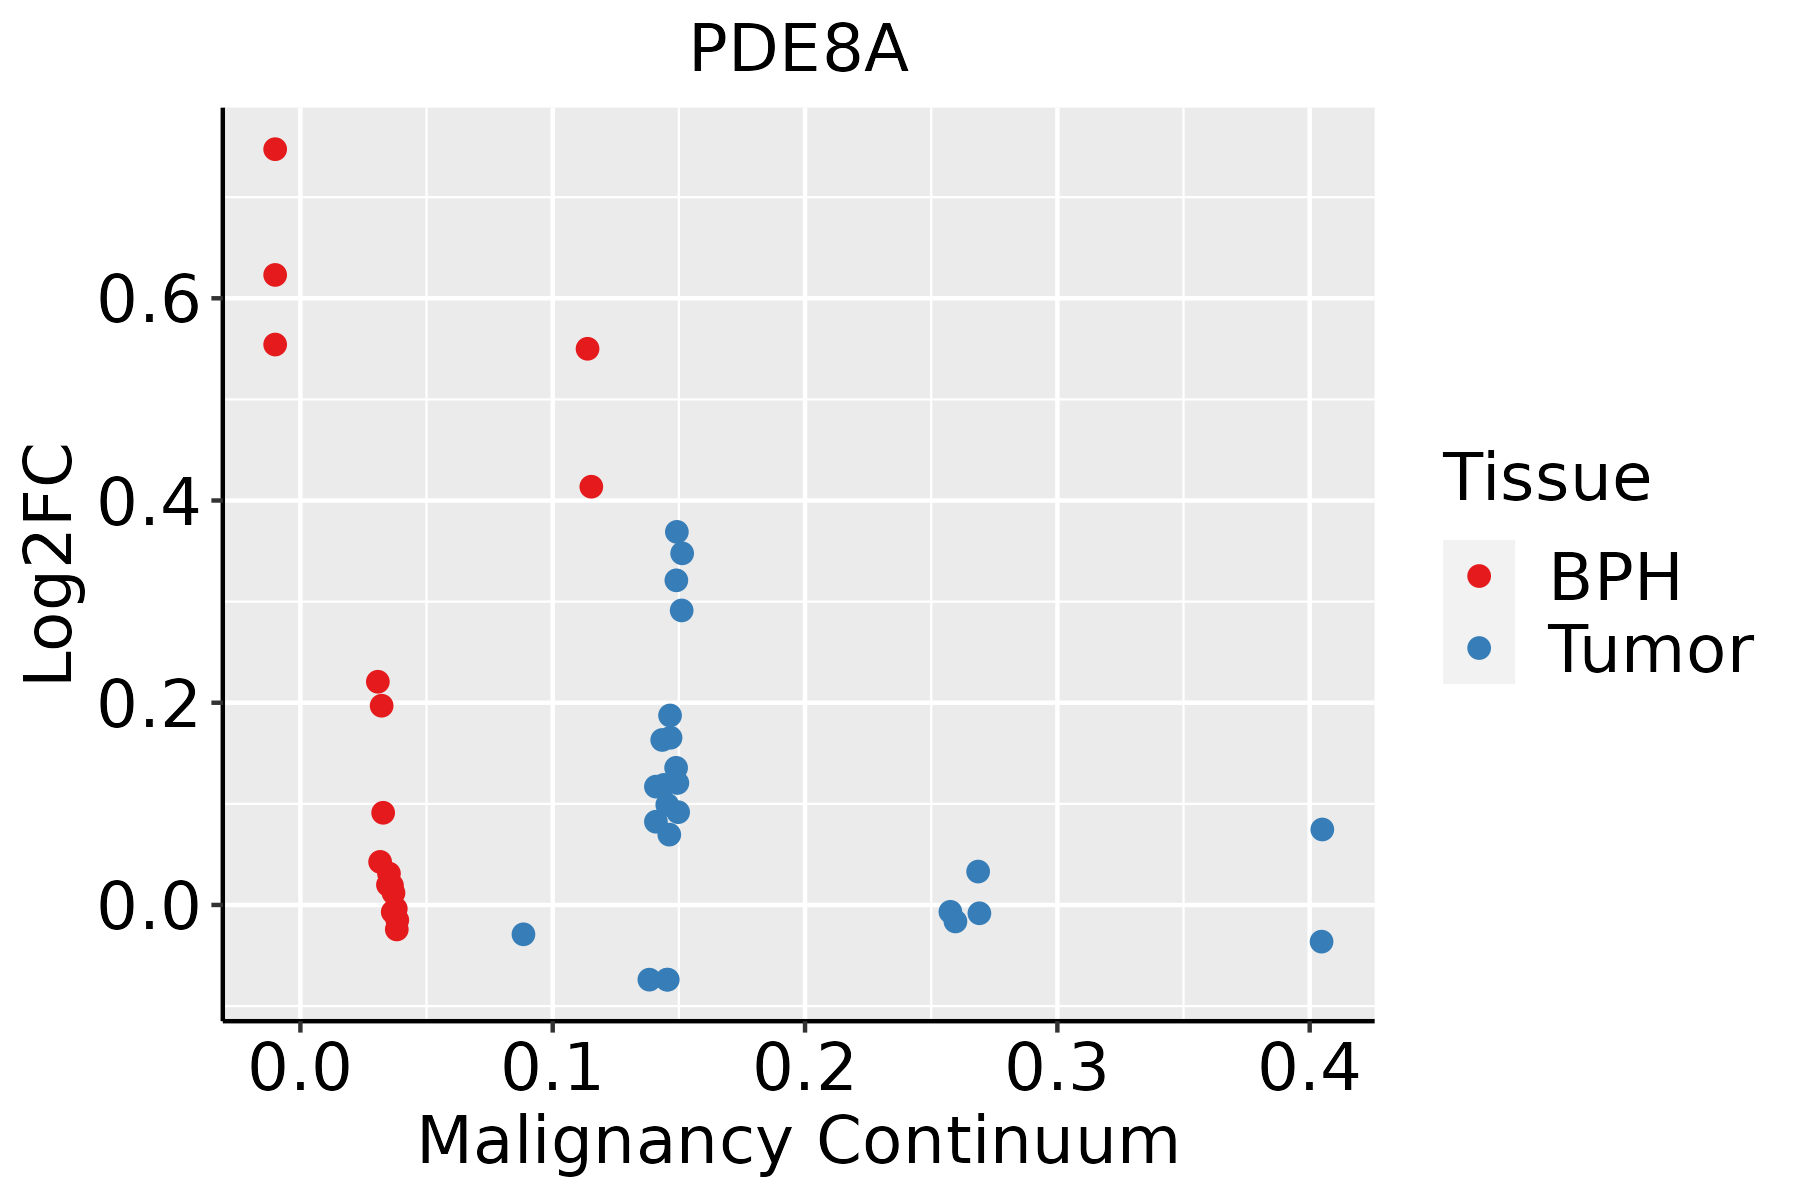 | BPH: Benign Prostatic Hyperplasia |
| ∗log2FC in expression of this searched gene in stem-like cells from each diseased tissue sample relative to stem-like cells in normal samples in each tissue plotted against the malignancy continuum. Samples are colored based on if they are from different disease stage. |
Top |
Malignant transformation related pathway analysis |
| Find out the enriched GO biological processes and KEGG pathways involved in transition from healthy to precancer to cancer |
| Tissue | Disease Stage | Enriched GO biological Processes |
| Colorectum | AD |  |
| Colorectum | SER |  |
| Colorectum | MSS |  |
| Colorectum | MSI-H |  |
| Colorectum | FAP |  |
| ∗Top 15 enriched GO BP terms are showed in the bar plot of each disease state in each tissue. Each row represents a significant GO biological process which is colored according to the -log10(p.adjust). |
| Page: 1 2 3 4 5 6 7 8 9 |
| GO ID | Tissue | Disease Stage | Description | Gene Ratio | Bg Ratio | pvalue | p.adjust | Count |
| GO:000697910 | Cervix | CC | response to oxidative stress | 102/2311 | 446/18723 | 2.99e-10 | 4.36e-08 | 102 |
| GO:000030210 | Cervix | CC | response to reactive oxygen species | 56/2311 | 222/18723 | 1.00e-07 | 5.25e-06 | 56 |
| GO:006219710 | Cervix | CC | cellular response to chemical stress | 76/2311 | 337/18723 | 1.01e-07 | 5.25e-06 | 76 |
| GO:004254210 | Cervix | CC | response to hydrogen peroxide | 40/2311 | 146/18723 | 6.79e-07 | 2.46e-05 | 40 |
| GO:003459910 | Cervix | CC | cellular response to oxidative stress | 63/2311 | 288/18723 | 3.58e-06 | 9.50e-05 | 63 |
| GO:00434104 | Cervix | CC | positive regulation of MAPK cascade | 90/2311 | 480/18723 | 2.92e-05 | 4.83e-04 | 90 |
| GO:00713648 | Cervix | CC | cellular response to epidermal growth factor stimulus | 16/2311 | 45/18723 | 5.24e-05 | 7.83e-04 | 16 |
| GO:00708498 | Cervix | CC | response to epidermal growth factor | 16/2311 | 49/18723 | 1.67e-04 | 1.99e-03 | 16 |
| GO:003461410 | Cervix | CC | cellular response to reactive oxygen species | 35/2311 | 155/18723 | 2.59e-04 | 2.85e-03 | 35 |
| GO:00467008 | Cervix | CC | heterocycle catabolic process | 80/2311 | 445/18723 | 3.23e-04 | 3.42e-03 | 80 |
| GO:00346559 | Cervix | CC | nucleobase-containing compound catabolic process | 74/2311 | 407/18723 | 3.77e-04 | 3.88e-03 | 74 |
| GO:00196939 | Cervix | CC | ribose phosphate metabolic process | 72/2311 | 396/18723 | 4.49e-04 | 4.48e-03 | 72 |
| GO:00092599 | Cervix | CC | ribonucleotide metabolic process | 70/2311 | 385/18723 | 5.35e-04 | 5.18e-03 | 70 |
| GO:00442709 | Cervix | CC | cellular nitrogen compound catabolic process | 79/2311 | 451/18723 | 7.80e-04 | 6.91e-03 | 79 |
| GO:000915010 | Cervix | CC | purine ribonucleotide metabolic process | 66/2311 | 368/18723 | 1.09e-03 | 9.07e-03 | 66 |
| GO:00703714 | Cervix | CC | ERK1 and ERK2 cascade | 60/2311 | 330/18723 | 1.28e-03 | 1.02e-02 | 60 |
| GO:00194398 | Cervix | CC | aromatic compound catabolic process | 79/2311 | 467/18723 | 2.14e-03 | 1.54e-02 | 79 |
| GO:000616310 | Cervix | CC | purine nucleotide metabolic process | 67/2311 | 396/18723 | 4.41e-03 | 2.69e-02 | 67 |
| GO:00703723 | Cervix | CC | regulation of ERK1 and ERK2 cascade | 54/2311 | 309/18723 | 5.11e-03 | 3.02e-02 | 54 |
| GO:003647310 | Cervix | CC | cell death in response to oxidative stress | 21/2311 | 95/18723 | 5.32e-03 | 3.10e-02 | 21 |
| Page: 1 2 3 4 5 6 7 8 9 10 11 12 13 14 |
| Pathway ID | Tissue | Disease Stage | Description | Gene Ratio | Bg Ratio | pvalue | p.adjust | qvalue | Count |
| Page: 1 |
Top |
Cell-cell communication analysis |
| Identification of potential cell-cell interactions between two cell types and their ligand-receptor pairs for different disease states |
| Ligand | Receptor | LRpair | Pathway | Tissue | Disease Stage |
| Page: 1 |
Top |
Single-cell gene regulatory network inference analysis |
| Find out the significant the regulons (TFs) and the target genes of each regulon across cell types for different disease states |
| TF | Cell Type | Tissue | Disease Stage | Target Gene | RSS | Regulon Activity |
| ∗The dot plots of a searched regulon are shown for all cell subpopulations in each disease state of each tissue based on the regulon specific score inferred using pySCENIC and by calculating the average expression. |
| Page: 1 |
Top |
Somatic mutation of malignant transformation related genes |
| Annotation of somatic variants for genes involved in malignant transformation |
| Hugo Symbol | Variant Class | Variant Classification | dbSNP RS | HGVSc | HGVSp | HGVSp Short | SWISSPROT | BIOTYPE | SIFT | PolyPhen | Tumor Sample Barcode | Tissue | Histology | Sex | Age | Stage | Therapy Types | Drugs | Outcome |
| PDE8A | SNV | Missense_Mutation | c.1484A>T | p.Glu495Val | p.E495V | O60658 | protein_coding | tolerated(0.06) | benign(0.094) | TCGA-BH-A0GZ-01 | Breast | breast invasive carcinoma | Female | <65 | I/II | Hormone Therapy | arimidex | SD | |
| PDE8A | SNV | Missense_Mutation | c.476N>G | p.Val159Gly | p.V159G | O60658 | protein_coding | deleterious(0) | possibly_damaging(0.893) | TCGA-FU-A3HZ-01 | Cervix | cervical & endocervical cancer | Female | <65 | I/II | Chemotherapy | cisplatin | CR | |
| PDE8A | SNV | Missense_Mutation | rs192339320 | c.704N>A | p.Arg235His | p.R235H | O60658 | protein_coding | tolerated(1) | benign(0) | TCGA-AA-3950-01 | Colorectum | colon adenocarcinoma | Female | >=65 | I/II | Unknown | Unknown | SD |
| PDE8A | SNV | Missense_Mutation | novel | c.2039N>G | p.Phe680Cys | p.F680C | O60658 | protein_coding | deleterious(0) | probably_damaging(1) | TCGA-AA-A00N-01 | Colorectum | colon adenocarcinoma | Male | >=65 | I/II | Unknown | Unknown | PD |
| PDE8A | SNV | Missense_Mutation | c.2174C>T | p.Ala725Val | p.A725V | O60658 | protein_coding | deleterious(0) | probably_damaging(0.998) | TCGA-AA-A010-01 | Colorectum | colon adenocarcinoma | Female | <65 | I/II | Chemotherapy | folinic | CR | |
| PDE8A | SNV | Missense_Mutation | novel | c.1501N>T | p.Asp501Tyr | p.D501Y | O60658 | protein_coding | deleterious(0) | possibly_damaging(0.478) | TCGA-CA-6717-01 | Colorectum | colon adenocarcinoma | Male | <65 | I/II | Chemotherapy | oxaliplatin | CR |
| PDE8A | SNV | Missense_Mutation | c.1130N>T | p.Arg377Leu | p.R377L | O60658 | protein_coding | deleterious(0) | probably_damaging(0.997) | TCGA-CM-5863-01 | Colorectum | colon adenocarcinoma | Female | <65 | III/IV | Chemotherapy | oxaliplatin | SD | |
| PDE8A | SNV | Missense_Mutation | novel | c.1672N>C | p.Ser558Pro | p.S558P | O60658 | protein_coding | deleterious(0) | probably_damaging(0.955) | TCGA-F5-6814-01 | Colorectum | rectum adenocarcinoma | Male | <65 | I/II | Unknown | Unknown | SD |
| PDE8A | deletion | Frame_Shift_Del | c.800delN | p.Lys269ArgfsTer8 | p.K269Rfs*8 | O60658 | protein_coding | TCGA-AA-3966-01 | Colorectum | colon adenocarcinoma | Female | >=65 | I/II | Unknown | Unknown | SD | |||
| PDE8A | deletion | Frame_Shift_Del | c.800delN | p.Lys269ArgfsTer8 | p.K269Rfs*8 | O60658 | protein_coding | TCGA-AA-A02R-01 | Colorectum | colon adenocarcinoma | Female | >=65 | I/II | Unknown | Unknown | PD |
| Page: 1 2 3 4 5 6 7 |
Top |
Related drugs of malignant transformation related genes |
| Identification of chemicals and drugs interact with genes involved in malignant transfromation |
| (DGIdb 4.0) |
| Entrez ID | Symbol | Category | Interaction Types | Drug Claim Name | Drug Name | PMIDs |
| 5151 | PDE8A | DRUGGABLE GENOME, ENZYME | inhibitor | 178101509 | DIPYRIDAMOLE | |
| 5151 | PDE8A | DRUGGABLE GENOME, ENZYME | inhibitor | CHEMBL932 | DIPYRIDAMOLE | |
| 5151 | PDE8A | DRUGGABLE GENOME, ENZYME | inhibitor | CHEMBL628 | PENTOXIFYLLINE | |
| 5151 | PDE8A | DRUGGABLE GENOME, ENZYME | inhibitor | CHEMBL1200875 | FLAVOXATE HYDROCHLORIDE | |
| 5151 | PDE8A | DRUGGABLE GENOME, ENZYME | inhibitor | 348353618 |
| Page: 1 |

Copyright 2023-Present -The University of Texas Health Science Center at Houston |