
|
|||||
|
 | |
| |
| |
| |
| |
| |
|
Gene: PDE7B |
Gene summary for PDE7B |
| Gene information | Species | Human | Gene symbol | PDE7B | Gene ID | 27115 |
| Gene name | phosphodiesterase 7B | |
| Gene Alias | bA472E5.1 | |
| Cytomap | 6q23.3 | |
| Gene Type | protein-coding | GO ID | GO:0006139 | UniProtAcc | Q9NP56 |
Top |
Malignant transformation analysis |
| Identification of the aberrant gene expression in precancerous and cancerous lesions by comparing the gene expression of stem-like cells in diseased tissues with normal stem cells |
| Entrez ID | Symbol | Replicates | Species | Organ | Tissue | Adj P-value | Log2FC | Malignancy |
| 27115 | PDE7B | NAFLD1 | Human | Liver | NAFLD | 5.34e-12 | 1.22e+00 | -0.04 |
| 27115 | PDE7B | S43 | Human | Liver | Cirrhotic | 9.71e-03 | -1.41e-01 | -0.0187 |
| 27115 | PDE7B | HCC1_Meng | Human | Liver | HCC | 1.12e-05 | -2.05e-01 | 0.0246 |
| 27115 | PDE7B | HCC2_Meng | Human | Liver | HCC | 4.13e-04 | -1.98e-01 | 0.0107 |
| 27115 | PDE7B | HCC2 | Human | Liver | HCC | 7.32e-06 | 8.75e-01 | 0.5341 |
| 27115 | PDE7B | Pt13.a | Human | Liver | HCC | 2.64e-03 | -1.88e-01 | 0.021 |
| 27115 | PDE7B | Pt14.d | Human | Liver | HCC | 1.30e-03 | -1.90e-01 | 0.0143 |
| 27115 | PDE7B | HTA12-26-1 | Human | Pancreas | PDAC | 9.79e-17 | 8.21e-01 | 0.3728 |
| 27115 | PDE7B | HTA12-29-1 | Human | Pancreas | PDAC | 1.40e-31 | 7.14e-01 | 0.3722 |
| 27115 | PDE7B | HTA12-30-1 | Human | Pancreas | PDAC | 1.14e-02 | 9.19e-01 | 0.3671 |
| 27115 | PDE7B | PTC07 | Human | Thyroid | PTC | 1.45e-07 | 4.32e-02 | 0.2044 |
| 27115 | PDE7B | ATC12 | Human | Thyroid | ATC | 8.48e-15 | 3.11e-01 | 0.34 |
| 27115 | PDE7B | ATC13 | Human | Thyroid | ATC | 1.61e-39 | 6.45e-01 | 0.34 |
| 27115 | PDE7B | ATC4 | Human | Thyroid | ATC | 1.23e-16 | 3.48e-01 | 0.34 |
| 27115 | PDE7B | ATC5 | Human | Thyroid | ATC | 8.04e-38 | 6.86e-01 | 0.34 |
| Page: 1 |
| Tissue | Expression Dynamics | Abbreviation |
| Liver | 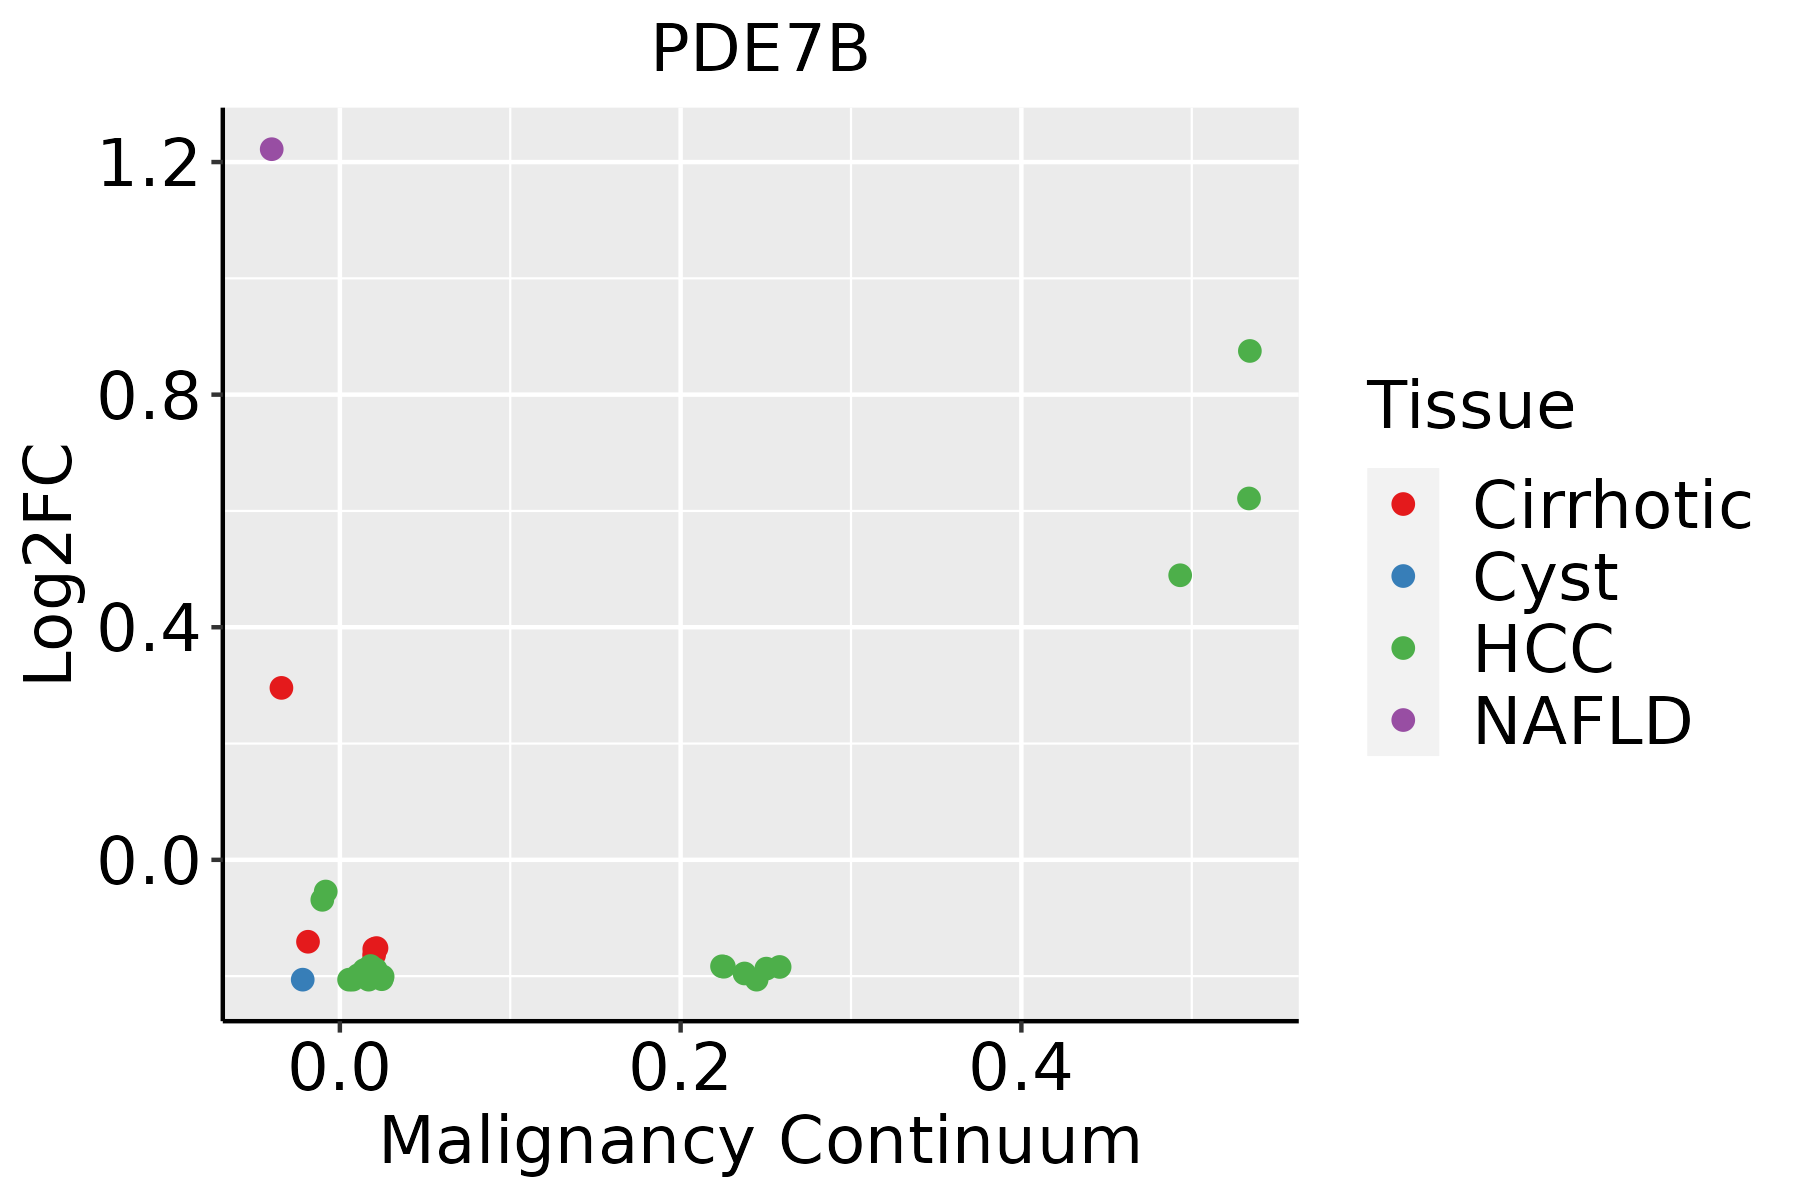 | HCC: Hepatocellular carcinoma |
| NAFLD: Non-alcoholic fatty liver disease | ||
| Thyroid | 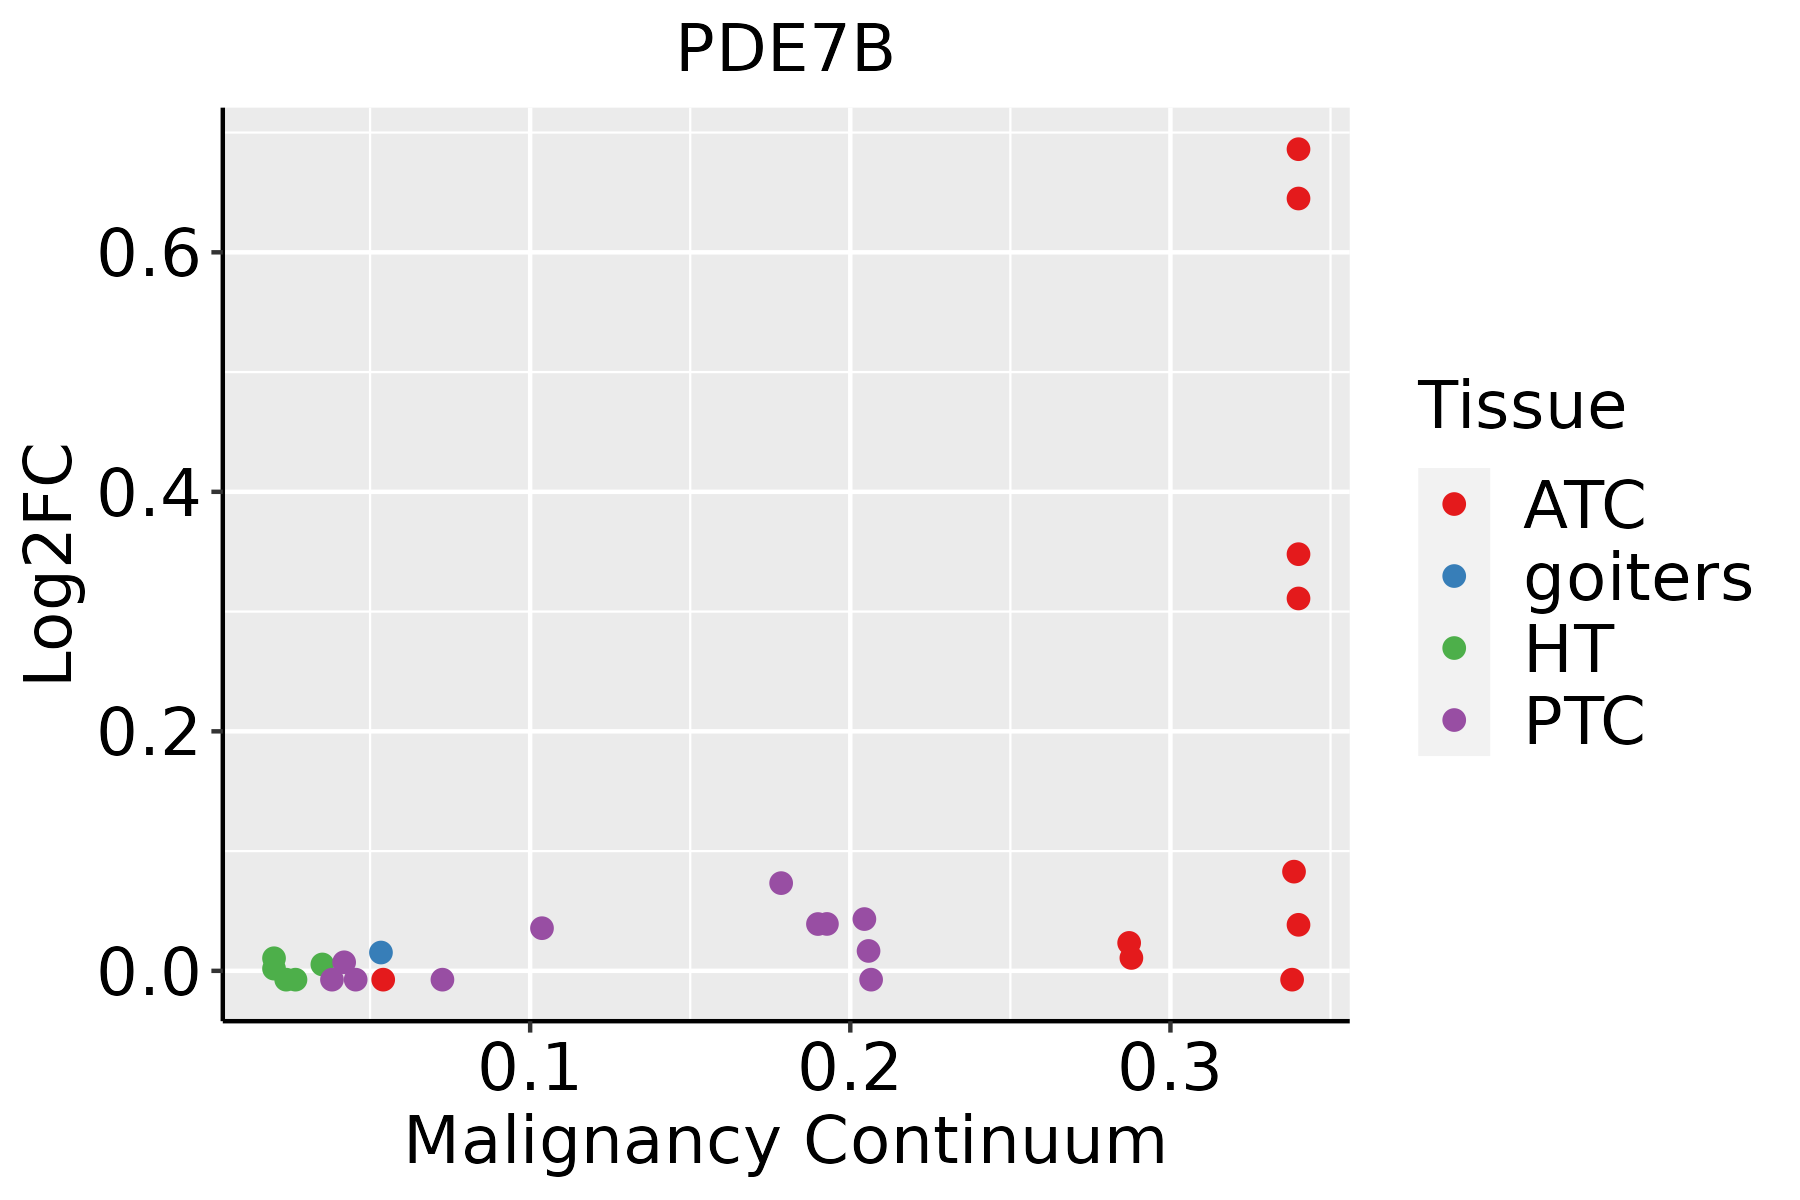 | ATC: Anaplastic thyroid cancer |
| HT: Hashimoto's thyroiditis | ||
| PTC: Papillary thyroid cancer |
| ∗log2FC in expression of this searched gene in stem-like cells from each diseased tissue sample relative to stem-like cells in normal samples in each tissue plotted against the malignancy continuum. Samples are colored based on if they are from different disease stage. |
Top |
Malignant transformation related pathway analysis |
| Find out the enriched GO biological processes and KEGG pathways involved in transition from healthy to precancer to cancer |
| Tissue | Disease Stage | Enriched GO biological Processes |
| Colorectum | AD |  |
| Colorectum | SER |  |
| Colorectum | MSS |  |
| Colorectum | MSI-H |  |
| Colorectum | FAP |  |
| ∗Top 15 enriched GO BP terms are showed in the bar plot of each disease state in each tissue. Each row represents a significant GO biological process which is colored according to the -log10(p.adjust). |
| Page: 1 2 3 4 5 6 7 8 9 |
| GO ID | Tissue | Disease Stage | Description | Gene Ratio | Bg Ratio | pvalue | p.adjust | Count |
| GO:00194396 | Liver | NAFLD | aromatic compound catabolic process | 102/1882 | 467/18723 | 2.29e-14 | 1.91e-11 | 102 |
| GO:19013616 | Liver | NAFLD | organic cyclic compound catabolic process | 105/1882 | 495/18723 | 7.04e-14 | 5.15e-11 | 105 |
| GO:00442707 | Liver | NAFLD | cellular nitrogen compound catabolic process | 93/1882 | 451/18723 | 1.04e-11 | 4.34e-09 | 93 |
| GO:00467006 | Liver | NAFLD | heterocycle catabolic process | 92/1882 | 445/18723 | 1.16e-11 | 4.52e-09 | 92 |
| GO:00346556 | Liver | NAFLD | nucleobase-containing compound catabolic process | 80/1882 | 407/18723 | 3.07e-09 | 4.61e-07 | 80 |
| GO:00092596 | Liver | NAFLD | ribonucleotide metabolic process | 72/1882 | 385/18723 | 1.51e-07 | 1.09e-05 | 72 |
| GO:00196936 | Liver | NAFLD | ribose phosphate metabolic process | 73/1882 | 396/18723 | 2.23e-07 | 1.53e-05 | 73 |
| GO:00091177 | Liver | NAFLD | nucleotide metabolic process | 85/1882 | 489/18723 | 3.31e-07 | 2.18e-05 | 85 |
| GO:00067537 | Liver | NAFLD | nucleoside phosphate metabolic process | 85/1882 | 497/18723 | 6.69e-07 | 3.83e-05 | 85 |
| GO:00725217 | Liver | NAFLD | purine-containing compound metabolic process | 74/1882 | 416/18723 | 7.73e-07 | 4.27e-05 | 74 |
| GO:00091507 | Liver | NAFLD | purine ribonucleotide metabolic process | 67/1882 | 368/18723 | 1.10e-06 | 5.44e-05 | 67 |
| GO:00061637 | Liver | NAFLD | purine nucleotide metabolic process | 70/1882 | 396/18723 | 1.93e-06 | 8.23e-05 | 70 |
| GO:0046434 | Liver | NAFLD | organophosphate catabolic process | 27/1882 | 155/18723 | 3.21e-03 | 2.86e-02 | 27 |
| GO:190136111 | Liver | Cirrhotic | organic cyclic compound catabolic process | 213/4634 | 495/18723 | 1.58e-19 | 3.67e-17 | 213 |
| GO:001943911 | Liver | Cirrhotic | aromatic compound catabolic process | 202/4634 | 467/18723 | 6.93e-19 | 1.28e-16 | 202 |
| GO:004427011 | Liver | Cirrhotic | cellular nitrogen compound catabolic process | 195/4634 | 451/18723 | 2.99e-18 | 4.94e-16 | 195 |
| GO:004670011 | Liver | Cirrhotic | heterocycle catabolic process | 192/4634 | 445/18723 | 7.17e-18 | 1.12e-15 | 192 |
| GO:003465511 | Liver | Cirrhotic | nucleobase-containing compound catabolic process | 171/4634 | 407/18723 | 9.07e-15 | 9.33e-13 | 171 |
| GO:000675312 | Liver | Cirrhotic | nucleoside phosphate metabolic process | 190/4634 | 497/18723 | 1.10e-11 | 6.96e-10 | 190 |
| GO:000911712 | Liver | Cirrhotic | nucleotide metabolic process | 187/4634 | 489/18723 | 1.55e-11 | 9.63e-10 | 187 |
| Page: 1 2 3 4 |
| Pathway ID | Tissue | Disease Stage | Description | Gene Ratio | Bg Ratio | pvalue | p.adjust | qvalue | Count |
| Page: 1 |
Top |
Cell-cell communication analysis |
| Identification of potential cell-cell interactions between two cell types and their ligand-receptor pairs for different disease states |
| Ligand | Receptor | LRpair | Pathway | Tissue | Disease Stage |
| Page: 1 |
Top |
Single-cell gene regulatory network inference analysis |
| Find out the significant the regulons (TFs) and the target genes of each regulon across cell types for different disease states |
| TF | Cell Type | Tissue | Disease Stage | Target Gene | RSS | Regulon Activity |
| ∗The dot plots of a searched regulon are shown for all cell subpopulations in each disease state of each tissue based on the regulon specific score inferred using pySCENIC and by calculating the average expression. |
| Page: 1 |
Top |
Somatic mutation of malignant transformation related genes |
| Annotation of somatic variants for genes involved in malignant transformation |
| Hugo Symbol | Variant Class | Variant Classification | dbSNP RS | HGVSc | HGVSp | HGVSp Short | SWISSPROT | BIOTYPE | SIFT | PolyPhen | Tumor Sample Barcode | Tissue | Histology | Sex | Age | Stage | Therapy Types | Drugs | Outcome |
| PDE7B | SNV | Missense_Mutation | c.1229N>T | p.Lys410Met | p.K410M | Q9NP56 | protein_coding | deleterious(0.01) | probably_damaging(0.96) | TCGA-AR-A251-01 | Breast | breast invasive carcinoma | Female | <65 | III/IV | Chemotherapy | doxorubicin | SD | |
| PDE7B | SNV | Missense_Mutation | rs377744382 | c.52G>A | p.Asp18Asn | p.D18N | Q9NP56 | protein_coding | deleterious_low_confidence(0.03) | possibly_damaging(0.517) | TCGA-2W-A8YY-01 | Cervix | cervical & endocervical cancer | Female | <65 | I/II | Chemotherapy | cisplatin | CR |
| PDE7B | SNV | Missense_Mutation | c.601N>G | p.Leu201Val | p.L201V | Q9NP56 | protein_coding | tolerated(0.21) | possibly_damaging(0.497) | TCGA-JW-A5VJ-01 | Cervix | cervical & endocervical cancer | Female | <65 | I/II | Unknown | Unknown | PD | |
| PDE7B | SNV | Missense_Mutation | c.253N>T | p.Leu85Phe | p.L85F | Q9NP56 | protein_coding | tolerated(0.57) | benign(0.014) | TCGA-AA-3844-01 | Colorectum | colon adenocarcinoma | Female | >=65 | III/IV | Chemotherapy | capecitabine | PD | |
| PDE7B | SNV | Missense_Mutation | novel | c.149N>G | p.Asp50Gly | p.D50G | Q9NP56 | protein_coding | deleterious(0.01) | possibly_damaging(0.493) | TCGA-AA-3984-01 | Colorectum | colon adenocarcinoma | Female | <65 | I/II | Unknown | Unknown | SD |
| PDE7B | SNV | Missense_Mutation | rs574015160 | c.31G>A | p.Glu11Lys | p.E11K | Q9NP56 | protein_coding | tolerated_low_confidence(0.09) | benign(0.054) | TCGA-AA-A00N-01 | Colorectum | colon adenocarcinoma | Male | >=65 | I/II | Unknown | Unknown | PD |
| PDE7B | SNV | Missense_Mutation | c.424C>T | p.His142Tyr | p.H142Y | Q9NP56 | protein_coding | tolerated(0.76) | benign(0.015) | TCGA-AZ-4615-01 | Colorectum | colon adenocarcinoma | Male | >=65 | III/IV | Chemotherapy | xeloda | PD | |
| PDE7B | SNV | Missense_Mutation | c.283C>T | p.His95Tyr | p.H95Y | Q9NP56 | protein_coding | tolerated(0.42) | benign(0.005) | TCGA-NH-A5IV-01 | Colorectum | colon adenocarcinoma | Female | >=65 | I/II | Unknown | Unknown | SD | |
| PDE7B | SNV | Missense_Mutation | rs201422143 | c.1219N>A | p.Ala407Thr | p.A407T | Q9NP56 | protein_coding | tolerated(0.55) | benign(0.005) | TCGA-WS-AB45-01 | Colorectum | colon adenocarcinoma | Female | <65 | I/II | Unknown | Unknown | SD |
| PDE7B | SNV | Missense_Mutation | c.85N>C | p.Asp29His | p.D29H | Q9NP56 | protein_coding | deleterious_low_confidence(0) | probably_damaging(0.928) | TCGA-AF-3913-01 | Colorectum | rectum adenocarcinoma | Male | <65 | III/IV | Chemotherapy | xeloda | PD |
| Page: 1 2 3 4 5 |
Top |
Related drugs of malignant transformation related genes |
| Identification of chemicals and drugs interact with genes involved in malignant transfromation |
| (DGIdb 4.0) |
| Entrez ID | Symbol | Category | Interaction Types | Drug Claim Name | Drug Name | PMIDs |
| 27115 | PDE7B | DRUGGABLE GENOME, ENZYME | DYPHYLLINE | DYPHYLLINE | ||
| 27115 | PDE7B | DRUGGABLE GENOME, ENZYME | inhibitor | CHEMBL628 | PENTOXIFYLLINE | |
| 27115 | PDE7B | DRUGGABLE GENOME, ENZYME | DYPHYLLINE | DYPHYLLINE | ||
| 27115 | PDE7B | DRUGGABLE GENOME, ENZYME | inhibitor | 178101846 | ||
| 27115 | PDE7B | DRUGGABLE GENOME, ENZYME | inhibitor | CHEMBL932 | DIPYRIDAMOLE | |
| 27115 | PDE7B | DRUGGABLE GENOME, ENZYME | inhibitor | 178101953 | ||
| 27115 | PDE7B | DRUGGABLE GENOME, ENZYME | inhibitor | CHEMBL1200875 | FLAVOXATE HYDROCHLORIDE | |
| 27115 | PDE7B | DRUGGABLE GENOME, ENZYME | inhibitor | 178101509 | DIPYRIDAMOLE |
| Page: 1 |

Copyright 2023-Present -The University of Texas Health Science Center at Houston |