
|
|||||
|
 | |
| |
| |
| |
| |
| |
|
Gene: PDE7A |
Gene summary for PDE7A |
| Gene information | Species | Human | Gene symbol | PDE7A | Gene ID | 5150 |
| Gene name | phosphodiesterase 7A | |
| Gene Alias | HCP1 | |
| Cytomap | 8q13.1 | |
| Gene Type | protein-coding | GO ID | GO:0006139 | UniProtAcc | Q13946 |
Top |
Malignant transformation analysis |
| Identification of the aberrant gene expression in precancerous and cancerous lesions by comparing the gene expression of stem-like cells in diseased tissues with normal stem cells |
| Entrez ID | Symbol | Replicates | Species | Organ | Tissue | Adj P-value | Log2FC | Malignancy |
| 5150 | PDE7A | CA_HPV_1 | Human | Cervix | CC | 4.05e-02 | -1.84e-02 | 0.0264 |
| 5150 | PDE7A | CCI_2 | Human | Cervix | CC | 2.05e-02 | 8.58e-01 | 0.5249 |
| 5150 | PDE7A | CCI_3 | Human | Cervix | CC | 2.37e-06 | 7.05e-01 | 0.516 |
| 5150 | PDE7A | LZE5T | Human | Esophagus | ESCC | 6.86e-04 | 1.99e-01 | 0.0514 |
| 5150 | PDE7A | LZE8T | Human | Esophagus | ESCC | 1.41e-03 | 1.26e-01 | 0.067 |
| 5150 | PDE7A | LZE20T | Human | Esophagus | ESCC | 3.69e-02 | 1.01e-01 | 0.0662 |
| 5150 | PDE7A | LZE24T | Human | Esophagus | ESCC | 1.35e-07 | 9.70e-02 | 0.0596 |
| 5150 | PDE7A | LZE6T | Human | Esophagus | ESCC | 1.64e-02 | 1.51e-01 | 0.0845 |
| 5150 | PDE7A | P1T-E | Human | Esophagus | ESCC | 4.98e-03 | 1.51e-01 | 0.0875 |
| 5150 | PDE7A | P2T-E | Human | Esophagus | ESCC | 1.78e-31 | 5.13e-01 | 0.1177 |
| 5150 | PDE7A | P4T-E | Human | Esophagus | ESCC | 9.35e-14 | 1.89e-01 | 0.1323 |
| 5150 | PDE7A | P5T-E | Human | Esophagus | ESCC | 6.28e-08 | 4.43e-02 | 0.1327 |
| 5150 | PDE7A | P8T-E | Human | Esophagus | ESCC | 1.82e-08 | 1.18e-01 | 0.0889 |
| 5150 | PDE7A | P9T-E | Human | Esophagus | ESCC | 8.64e-03 | 4.14e-02 | 0.1131 |
| 5150 | PDE7A | P10T-E | Human | Esophagus | ESCC | 2.46e-20 | 3.25e-01 | 0.116 |
| 5150 | PDE7A | P11T-E | Human | Esophagus | ESCC | 3.08e-10 | 4.13e-01 | 0.1426 |
| 5150 | PDE7A | P12T-E | Human | Esophagus | ESCC | 5.51e-16 | 3.05e-01 | 0.1122 |
| 5150 | PDE7A | P15T-E | Human | Esophagus | ESCC | 1.67e-03 | 1.34e-01 | 0.1149 |
| 5150 | PDE7A | P16T-E | Human | Esophagus | ESCC | 4.27e-25 | 4.54e-01 | 0.1153 |
| 5150 | PDE7A | P20T-E | Human | Esophagus | ESCC | 6.57e-08 | 8.74e-02 | 0.1124 |
| Page: 1 2 3 4 5 6 |
| Tissue | Expression Dynamics | Abbreviation |
| Cervix | 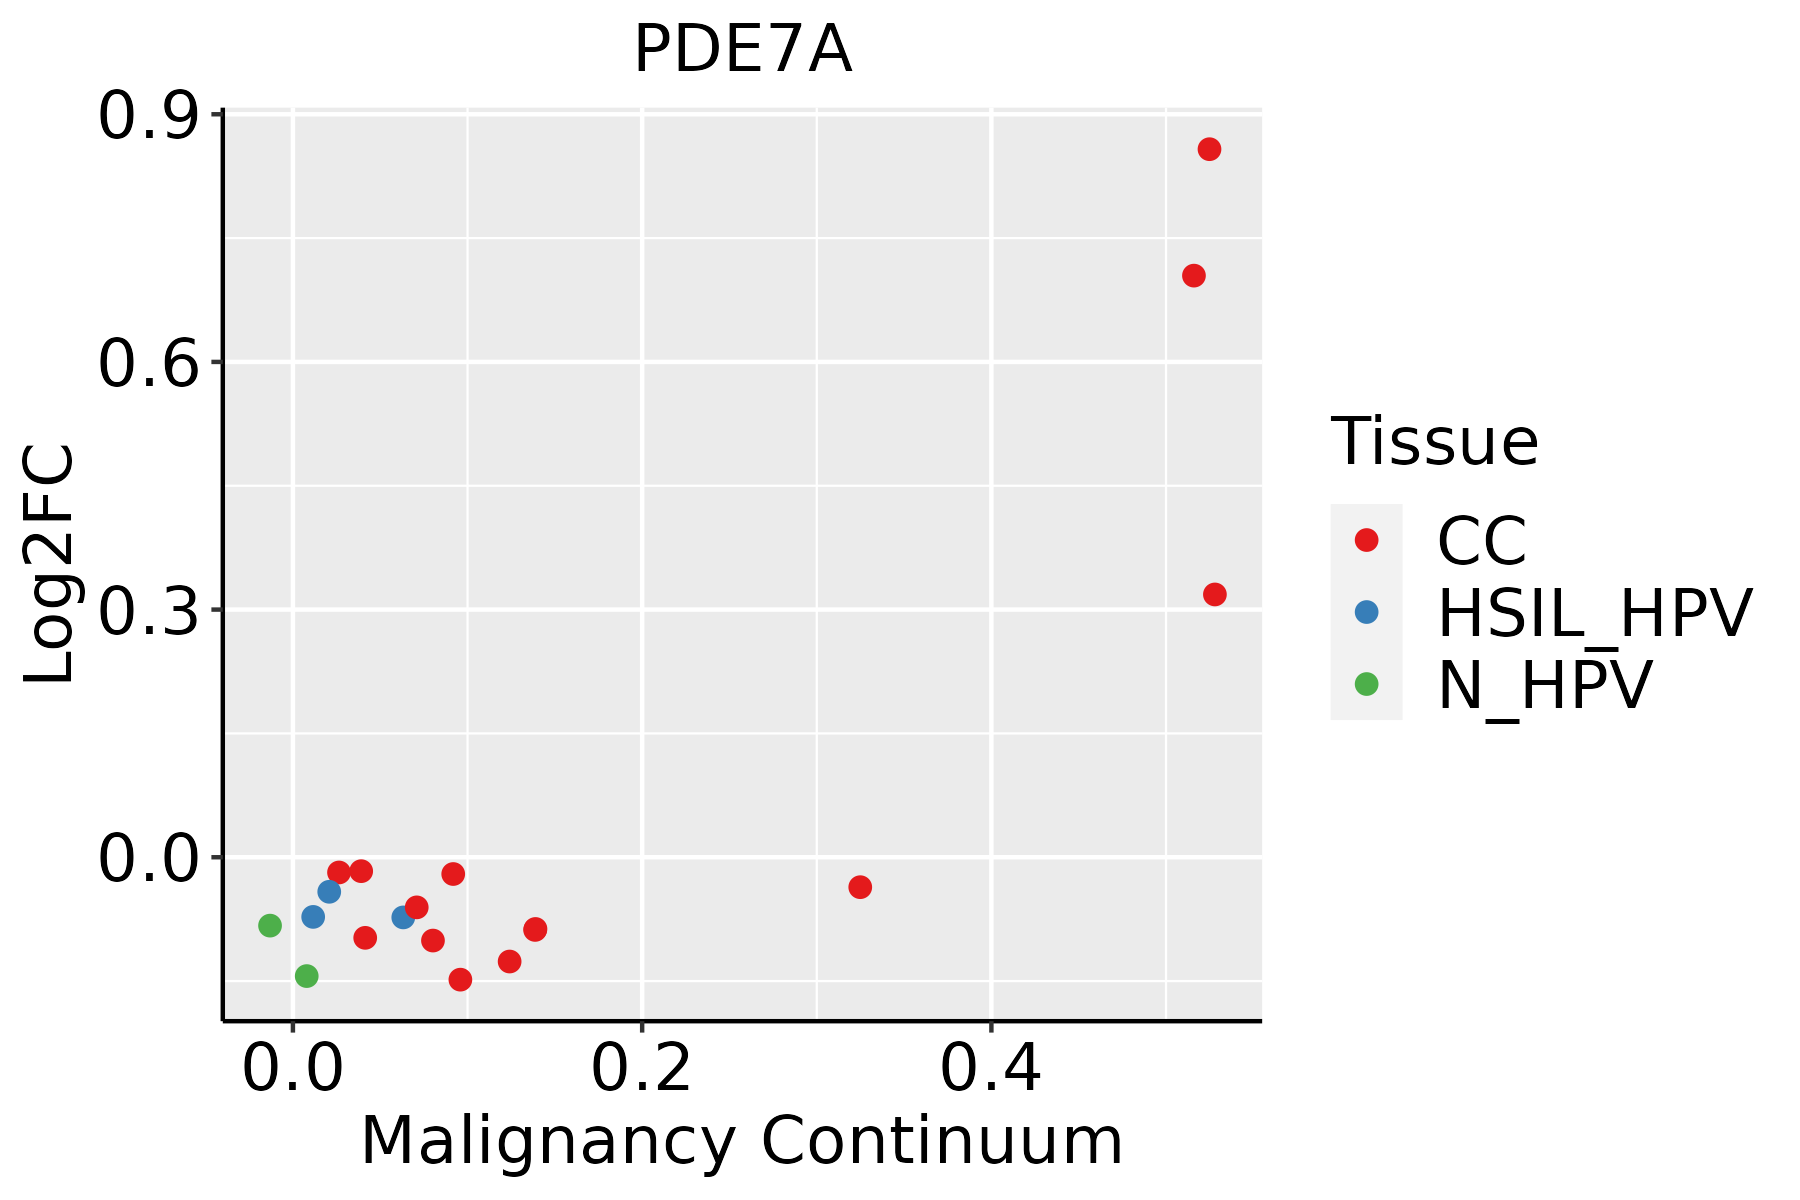 | CC: Cervix cancer |
| HSIL_HPV: HPV-infected high-grade squamous intraepithelial lesions | ||
| N_HPV: HPV-infected normal cervix | ||
| Esophagus |  | ESCC: Esophageal squamous cell carcinoma |
| HGIN: High-grade intraepithelial neoplasias | ||
| LGIN: Low-grade intraepithelial neoplasias | ||
| Liver | 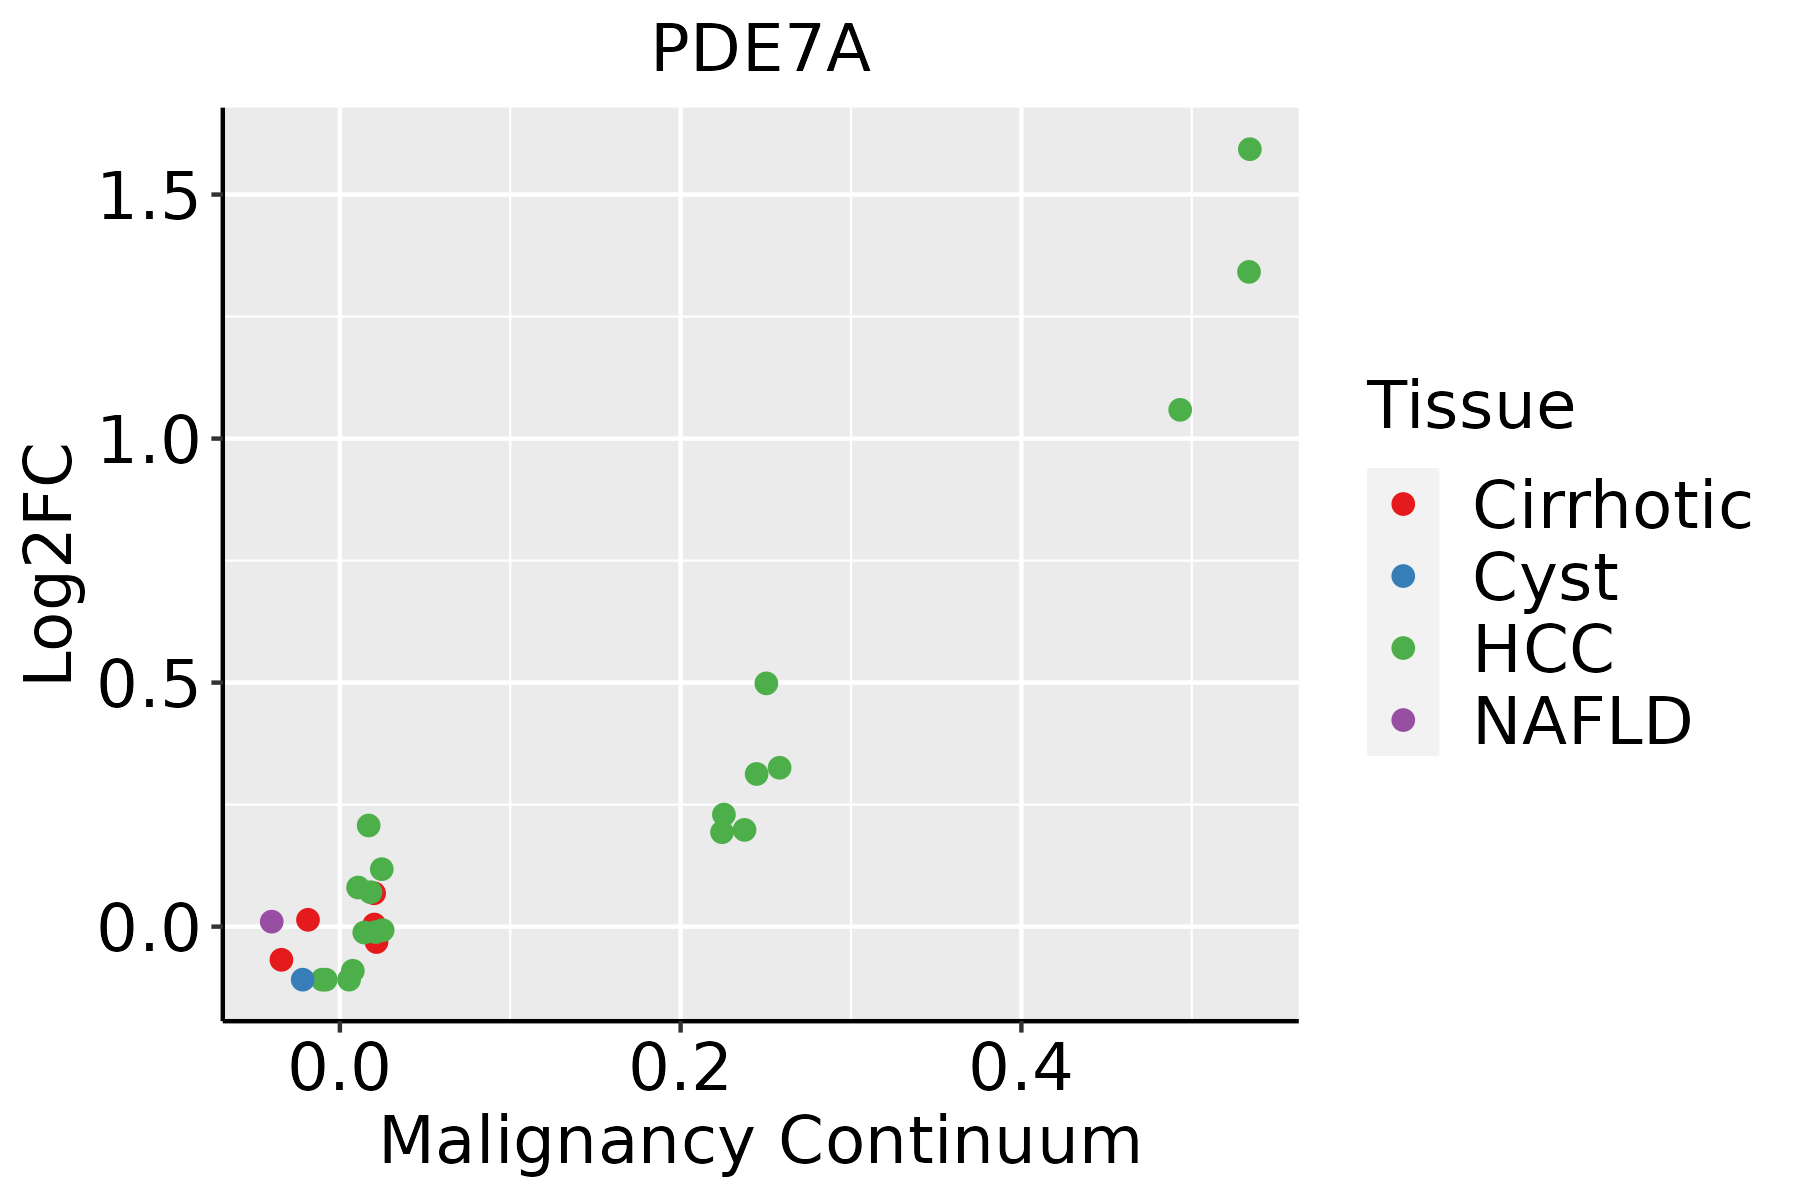 | HCC: Hepatocellular carcinoma |
| NAFLD: Non-alcoholic fatty liver disease | ||
| Lung | 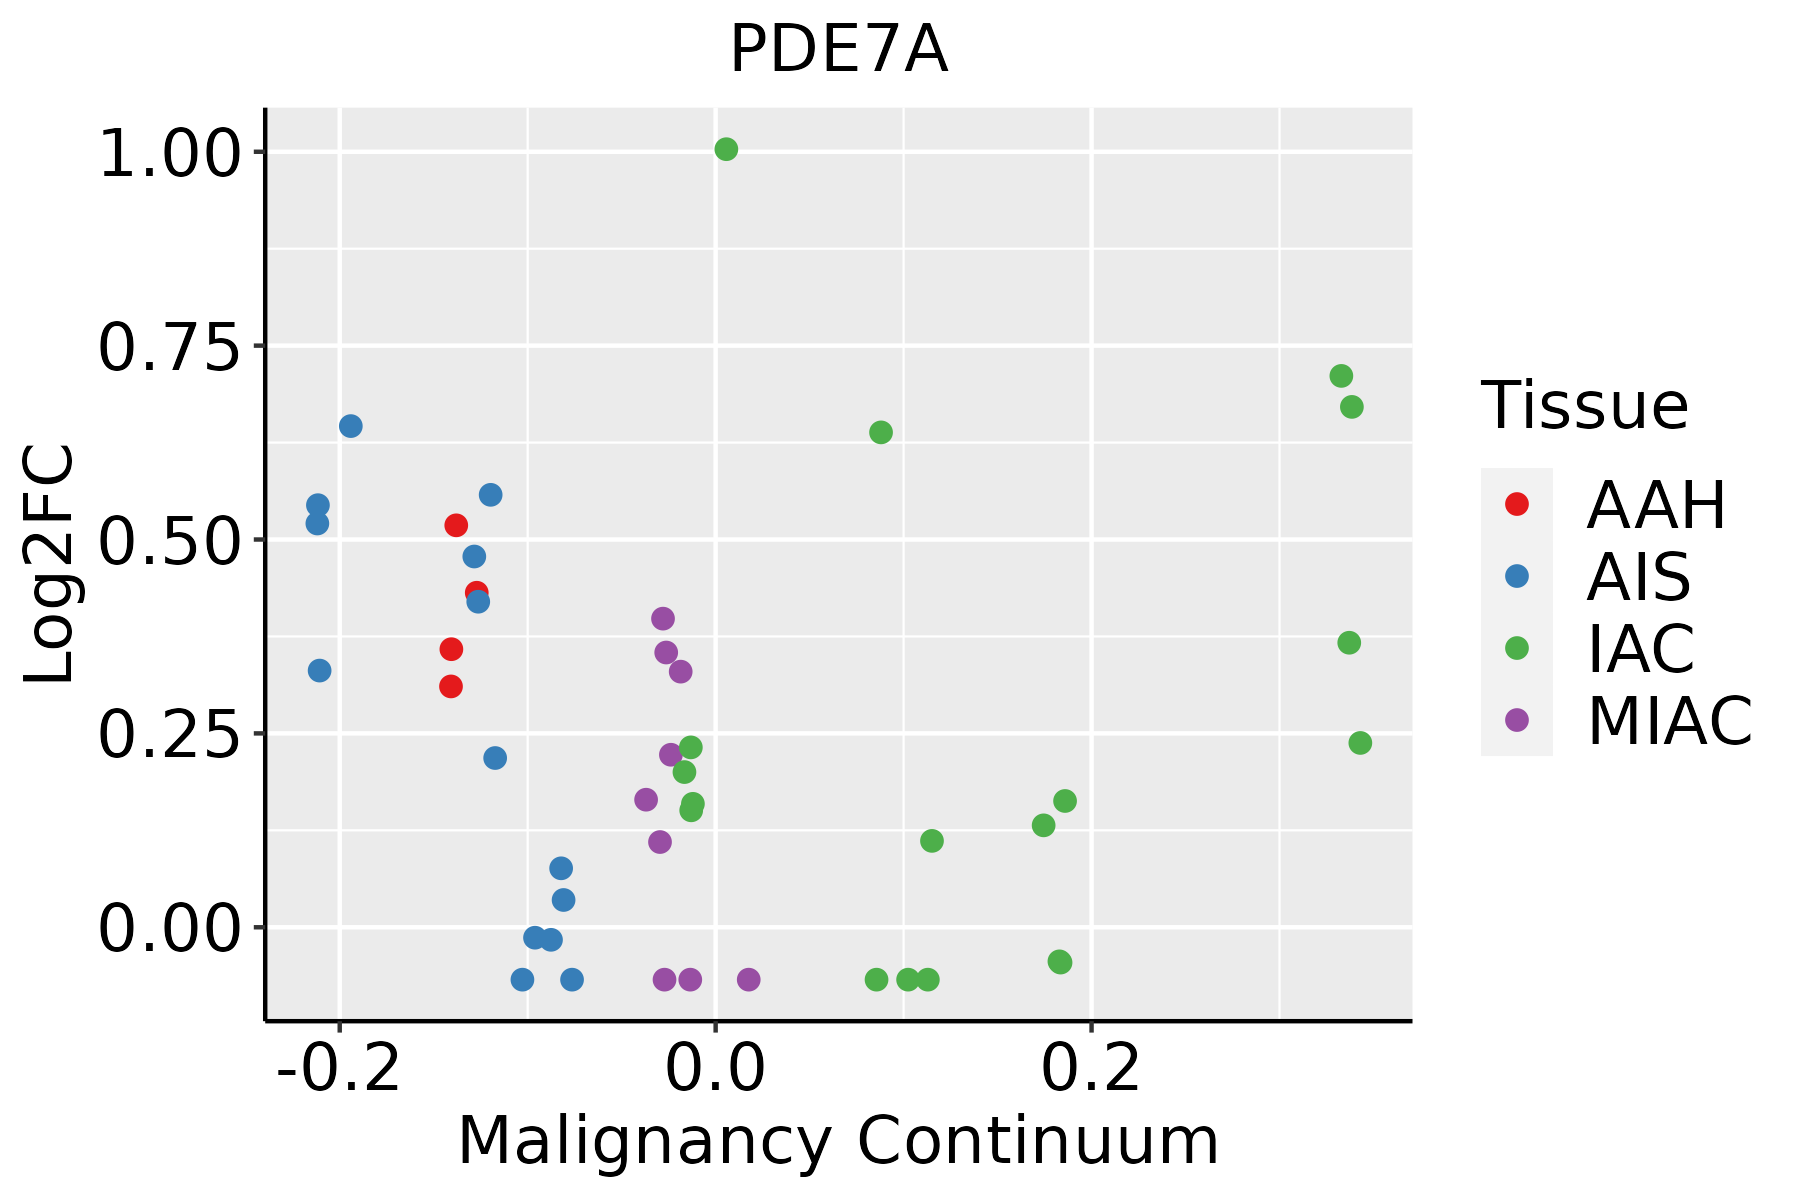 | AAH: Atypical adenomatous hyperplasia |
| AIS: Adenocarcinoma in situ | ||
| IAC: Invasive lung adenocarcinoma | ||
| MIA: Minimally invasive adenocarcinoma | ||
| Oral Cavity | 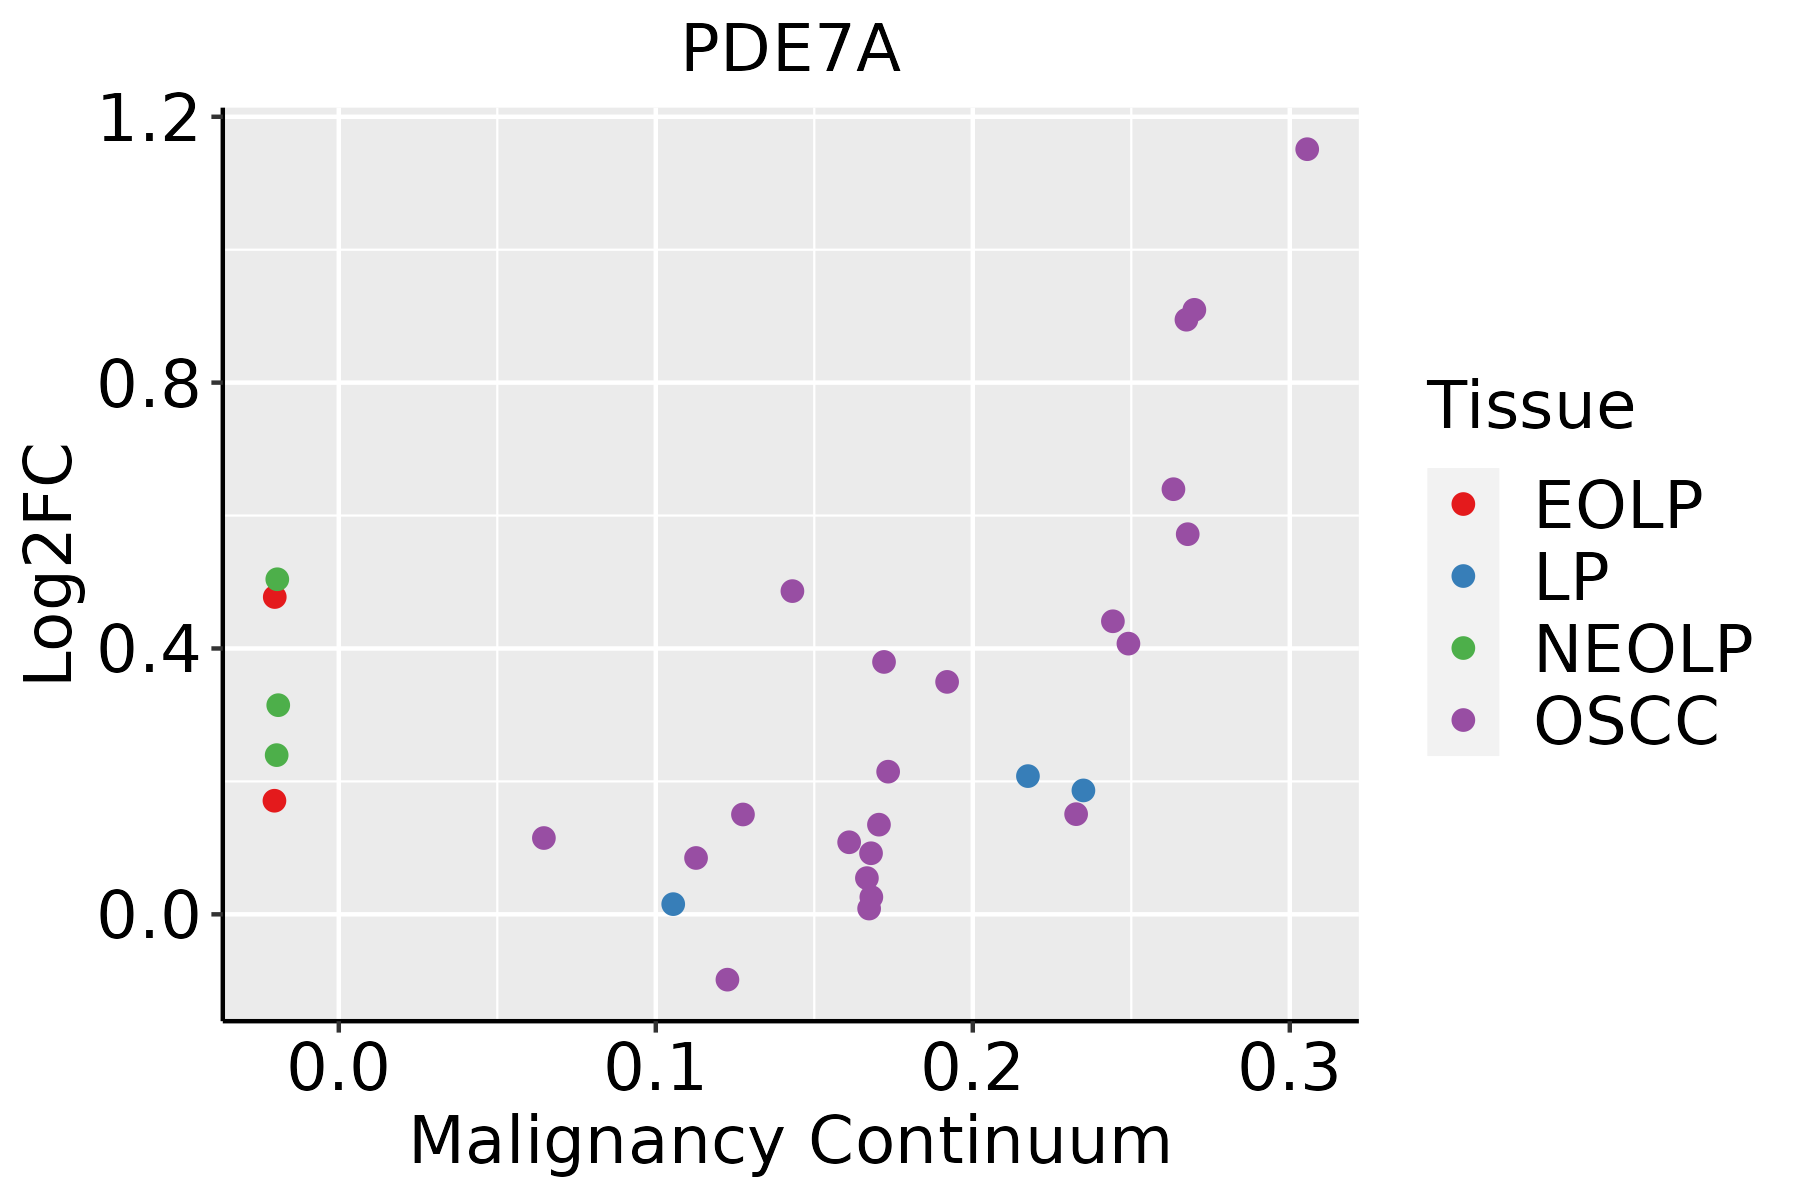 | EOLP: Erosive Oral lichen planus |
| LP: leukoplakia | ||
| NEOLP: Non-erosive oral lichen planus | ||
| OSCC: Oral squamous cell carcinoma | ||
| Thyroid | 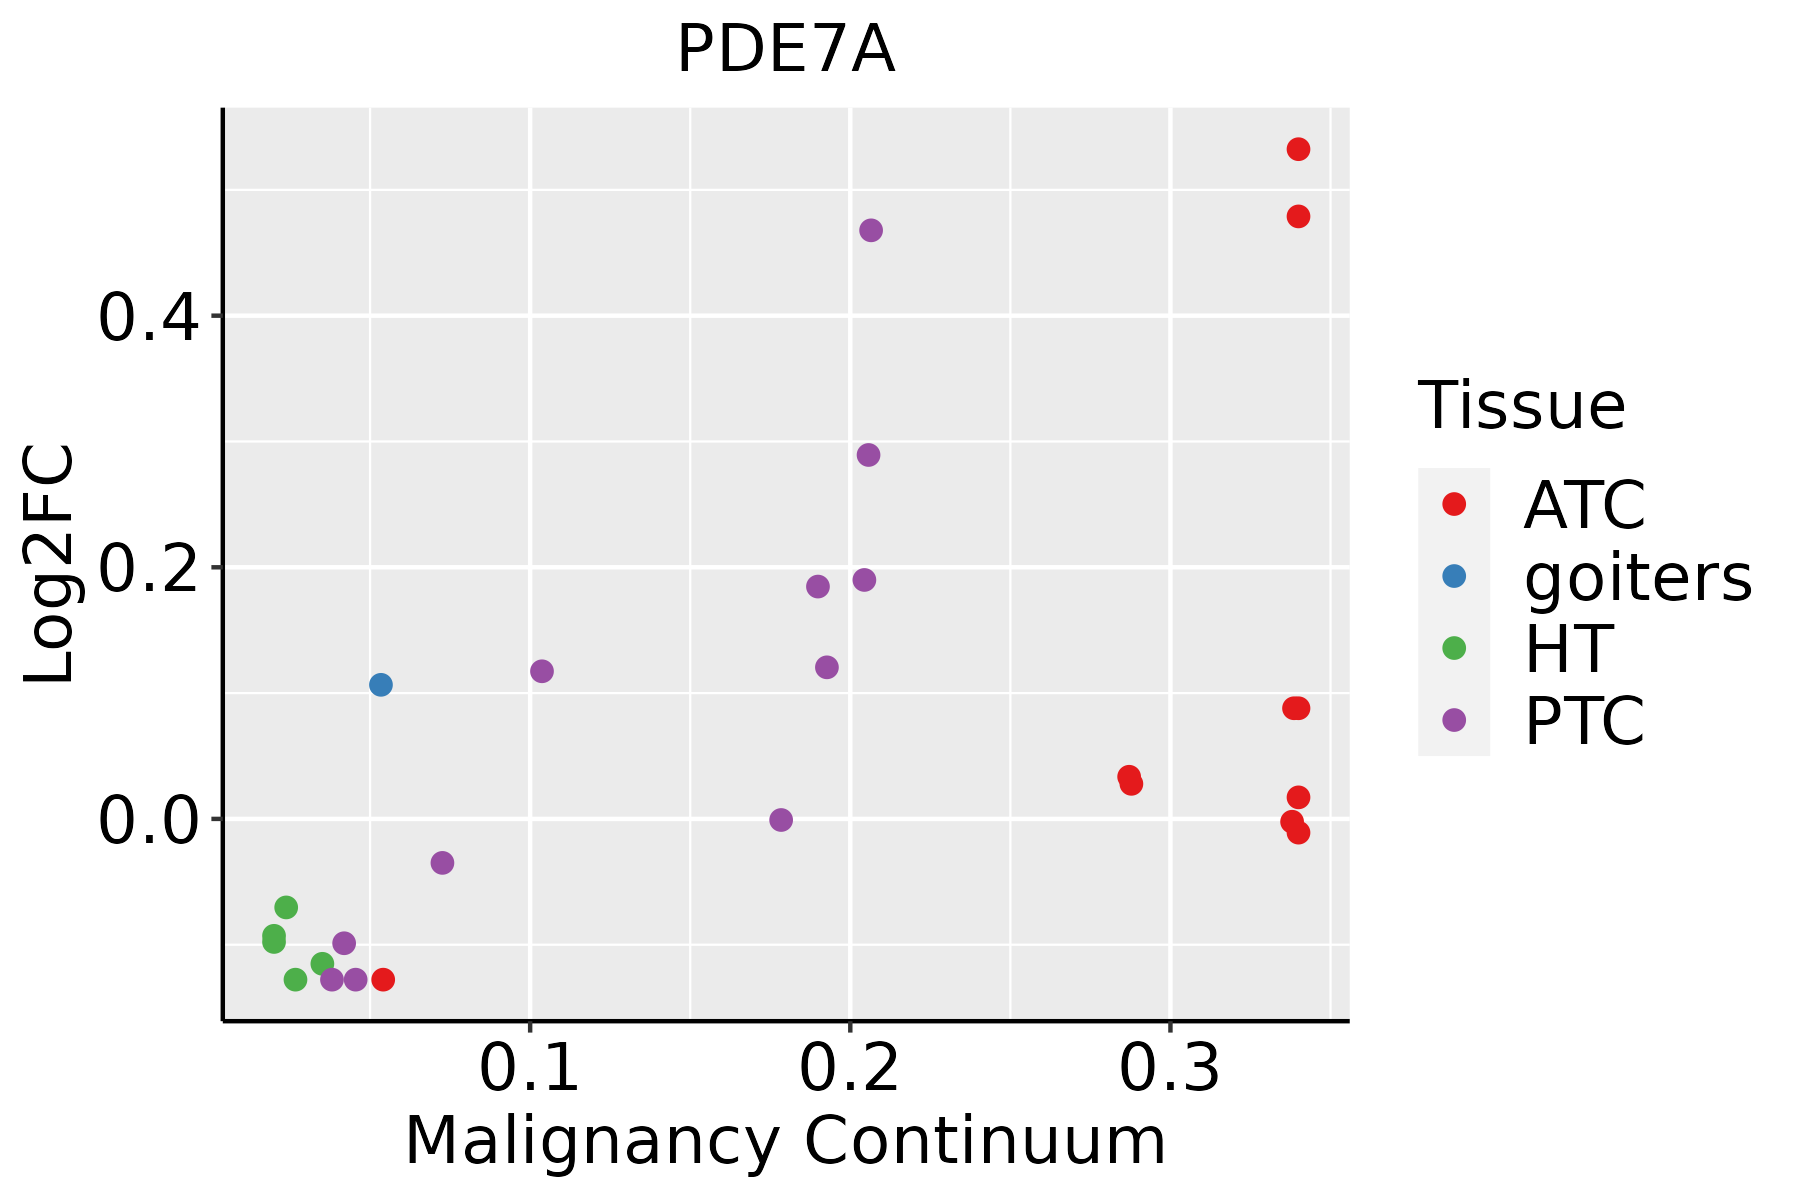 | ATC: Anaplastic thyroid cancer |
| HT: Hashimoto's thyroiditis | ||
| PTC: Papillary thyroid cancer |
| ∗log2FC in expression of this searched gene in stem-like cells from each diseased tissue sample relative to stem-like cells in normal samples in each tissue plotted against the malignancy continuum. Samples are colored based on if they are from different disease stage. |
Top |
Malignant transformation related pathway analysis |
| Find out the enriched GO biological processes and KEGG pathways involved in transition from healthy to precancer to cancer |
| Tissue | Disease Stage | Enriched GO biological Processes |
| Colorectum | AD |  |
| Colorectum | SER |  |
| Colorectum | MSS |  |
| Colorectum | MSI-H |  |
| Colorectum | FAP |  |
| ∗Top 15 enriched GO BP terms are showed in the bar plot of each disease state in each tissue. Each row represents a significant GO biological process which is colored according to the -log10(p.adjust). |
| Page: 1 2 3 4 5 6 7 8 9 |
| GO ID | Tissue | Disease Stage | Description | Gene Ratio | Bg Ratio | pvalue | p.adjust | Count |
| GO:00467008 | Cervix | CC | heterocycle catabolic process | 80/2311 | 445/18723 | 3.23e-04 | 3.42e-03 | 80 |
| GO:00346559 | Cervix | CC | nucleobase-containing compound catabolic process | 74/2311 | 407/18723 | 3.77e-04 | 3.88e-03 | 74 |
| GO:00196939 | Cervix | CC | ribose phosphate metabolic process | 72/2311 | 396/18723 | 4.49e-04 | 4.48e-03 | 72 |
| GO:00092599 | Cervix | CC | ribonucleotide metabolic process | 70/2311 | 385/18723 | 5.35e-04 | 5.18e-03 | 70 |
| GO:00442709 | Cervix | CC | cellular nitrogen compound catabolic process | 79/2311 | 451/18723 | 7.80e-04 | 6.91e-03 | 79 |
| GO:000915010 | Cervix | CC | purine ribonucleotide metabolic process | 66/2311 | 368/18723 | 1.09e-03 | 9.07e-03 | 66 |
| GO:00194398 | Cervix | CC | aromatic compound catabolic process | 79/2311 | 467/18723 | 2.14e-03 | 1.54e-02 | 79 |
| GO:000616310 | Cervix | CC | purine nucleotide metabolic process | 67/2311 | 396/18723 | 4.41e-03 | 2.69e-02 | 67 |
| GO:007252110 | Cervix | CC | purine-containing compound metabolic process | 69/2311 | 416/18723 | 6.27e-03 | 3.54e-02 | 69 |
| GO:19013618 | Cervix | CC | organic cyclic compound catabolic process | 80/2311 | 495/18723 | 6.77e-03 | 3.72e-02 | 80 |
| GO:000911710 | Cervix | CC | nucleotide metabolic process | 79/2311 | 489/18723 | 7.16e-03 | 3.85e-02 | 79 |
| GO:0034655110 | Esophagus | ESCC | nucleobase-containing compound catabolic process | 272/8552 | 407/18723 | 2.92e-18 | 2.90e-16 | 272 |
| GO:004670018 | Esophagus | ESCC | heterocycle catabolic process | 286/8552 | 445/18723 | 1.12e-15 | 7.47e-14 | 286 |
| GO:004427019 | Esophagus | ESCC | cellular nitrogen compound catabolic process | 288/8552 | 451/18723 | 3.03e-15 | 1.79e-13 | 288 |
| GO:001943918 | Esophagus | ESCC | aromatic compound catabolic process | 295/8552 | 467/18723 | 1.09e-14 | 5.98e-13 | 295 |
| GO:190136118 | Esophagus | ESCC | organic cyclic compound catabolic process | 307/8552 | 495/18723 | 9.99e-14 | 4.80e-12 | 307 |
| GO:0006753110 | Esophagus | ESCC | nucleoside phosphate metabolic process | 288/8552 | 497/18723 | 1.80e-08 | 3.50e-07 | 288 |
| GO:0019693111 | Esophagus | ESCC | ribose phosphate metabolic process | 234/8552 | 396/18723 | 4.24e-08 | 7.76e-07 | 234 |
| GO:0009117111 | Esophagus | ESCC | nucleotide metabolic process | 282/8552 | 489/18723 | 4.70e-08 | 8.50e-07 | 282 |
| GO:0009259111 | Esophagus | ESCC | ribonucleotide metabolic process | 224/8552 | 385/18723 | 4.41e-07 | 6.00e-06 | 224 |
| Page: 1 2 3 4 5 6 |
| Pathway ID | Tissue | Disease Stage | Description | Gene Ratio | Bg Ratio | pvalue | p.adjust | qvalue | Count |
| Page: 1 |
Top |
Cell-cell communication analysis |
| Identification of potential cell-cell interactions between two cell types and their ligand-receptor pairs for different disease states |
| Ligand | Receptor | LRpair | Pathway | Tissue | Disease Stage |
| Page: 1 |
Top |
Single-cell gene regulatory network inference analysis |
| Find out the significant the regulons (TFs) and the target genes of each regulon across cell types for different disease states |
| TF | Cell Type | Tissue | Disease Stage | Target Gene | RSS | Regulon Activity |
| ∗The dot plots of a searched regulon are shown for all cell subpopulations in each disease state of each tissue based on the regulon specific score inferred using pySCENIC and by calculating the average expression. |
| Page: 1 |
Top |
Somatic mutation of malignant transformation related genes |
| Annotation of somatic variants for genes involved in malignant transformation |
| Hugo Symbol | Variant Class | Variant Classification | dbSNP RS | HGVSc | HGVSp | HGVSp Short | SWISSPROT | BIOTYPE | SIFT | PolyPhen | Tumor Sample Barcode | Tissue | Histology | Sex | Age | Stage | Therapy Types | Drugs | Outcome |
| PDE7A | SNV | Missense_Mutation | novel | c.84C>A | p.Ser28Arg | p.S28R | Q13946 | protein_coding | deleterious(0.01) | benign(0) | TCGA-BH-A0BT-01 | Breast | breast invasive carcinoma | Female | <65 | I/II | Chemotherapy | adriamycin | CR |
| PDE7A | SNV | Missense_Mutation | novel | c.628C>A | p.Pro210Thr | p.P210T | Q13946 | protein_coding | deleterious(0) | probably_damaging(0.999) | TCGA-S3-AA17-01 | Breast | breast invasive carcinoma | Female | <65 | I/II | Hormone Therapy | anastrozole | SD |
| PDE7A | SNV | Missense_Mutation | rs372221056 | c.974N>A | p.Arg325His | p.R325H | Q13946 | protein_coding | deleterious(0) | probably_damaging(0.913) | TCGA-2W-A8YY-01 | Cervix | cervical & endocervical cancer | Female | <65 | I/II | Chemotherapy | cisplatin | CR |
| PDE7A | SNV | Missense_Mutation | c.324N>G | p.Ile108Met | p.I108M | Q13946 | protein_coding | tolerated(0.07) | benign(0.028) | TCGA-C5-A2LZ-01 | Cervix | cervical & endocervical cancer | Female | >=65 | III/IV | Unknown | Unknown | PD | |
| PDE7A | SNV | Missense_Mutation | novel | c.1074N>C | p.Leu358Phe | p.L358F | Q13946 | protein_coding | deleterious(0) | probably_damaging(1) | TCGA-C5-A8YQ-01 | Cervix | cervical & endocervical cancer | Female | >=65 | I/II | Chemotherapy | cisplatin | PD |
| PDE7A | SNV | Missense_Mutation | c.1396N>A | p.Ala466Thr | p.A466T | Q13946 | protein_coding | tolerated(0.48) | benign(0) | TCGA-A6-5665-01 | Colorectum | colon adenocarcinoma | Female | >=65 | I/II | Unknown | Unknown | PD | |
| PDE7A | SNV | Missense_Mutation | c.556N>C | p.Tyr186His | p.Y186H | Q13946 | protein_coding | tolerated(1) | benign(0) | TCGA-AA-3492-01 | Colorectum | colon adenocarcinoma | Female | >=65 | I/II | Unknown | Unknown | SD | |
| PDE7A | SNV | Missense_Mutation | rs774612786 | c.208N>T | p.Arg70Cys | p.R70C | Q13946 | protein_coding | deleterious(0.01) | possibly_damaging(0.88) | TCGA-AA-3821-01 | Colorectum | colon adenocarcinoma | Female | >=65 | I/II | Unknown | Unknown | SD |
| PDE7A | SNV | Missense_Mutation | c.935N>T | p.Thr312Ile | p.T312I | Q13946 | protein_coding | tolerated(0.13) | benign(0.021) | TCGA-CM-6674-01 | Colorectum | colon adenocarcinoma | Male | <65 | I/II | Unknown | Unknown | SD | |
| PDE7A | SNV | Missense_Mutation | c.103N>G | p.Leu35Val | p.L35V | Q13946 | protein_coding | tolerated(0.06) | possibly_damaging(0.899) | TCGA-G4-6299-01 | Colorectum | colon adenocarcinoma | Male | >=65 | III/IV | Ancillary | leucovorin | SD |
| Page: 1 2 3 4 |
Top |
Related drugs of malignant transformation related genes |
| Identification of chemicals and drugs interact with genes involved in malignant transfromation |
| (DGIdb 4.0) |
| Entrez ID | Symbol | Category | Interaction Types | Drug Claim Name | Drug Name | PMIDs |
| 5150 | PDE7A | ENZYME, DRUGGABLE GENOME | DYPHYLLINE | DYPHYLLINE | ||
| 5150 | PDE7A | ENZYME, DRUGGABLE GENOME | ISOBUTYLMETHYLXANTHINE | ISOBUTYLMETHYLXANTHINE | 24239625 | |
| 5150 | PDE7A | ENZYME, DRUGGABLE GENOME | DYPHYLLINE | DYPHYLLINE | ||
| 5150 | PDE7A | ENZYME, DRUGGABLE GENOME | inhibitor | CHEMBL1200875 | FLAVOXATE HYDROCHLORIDE | |
| 5150 | PDE7A | ENZYME, DRUGGABLE GENOME | inhibitor | CHEMBL628 | PENTOXIFYLLINE | |
| 5150 | PDE7A | ENZYME, DRUGGABLE GENOME | inhibitor | 178101846 | ||
| 5150 | PDE7A | ENZYME, DRUGGABLE GENOME | inhibitor | CHEMBL932 | DIPYRIDAMOLE | |
| 5150 | PDE7A | ENZYME, DRUGGABLE GENOME | inhibitor | 315661236 | CRISABOROLE |
| Page: 1 |

Copyright 2023-Present -The University of Texas Health Science Center at Houston |