
|
|||||
|
 | |
| |
| |
| |
| |
| |
|
Gene: PDE6D |
Gene summary for PDE6D |
| Gene information | Species | Human | Gene symbol | PDE6D | Gene ID | 5147 |
| Gene name | phosphodiesterase 6D | |
| Gene Alias | JBTS22 | |
| Cytomap | 2q37.1 | |
| Gene Type | protein-coding | GO ID | GO:0003008 | UniProtAcc | B8ZZK5 |
Top |
Malignant transformation analysis |
| Identification of the aberrant gene expression in precancerous and cancerous lesions by comparing the gene expression of stem-like cells in diseased tissues with normal stem cells |
| Entrez ID | Symbol | Replicates | Species | Organ | Tissue | Adj P-value | Log2FC | Malignancy |
| 5147 | PDE6D | LZE4T | Human | Esophagus | ESCC | 9.21e-09 | 2.08e-01 | 0.0811 |
| 5147 | PDE6D | LZE7T | Human | Esophagus | ESCC | 9.19e-06 | 3.08e-01 | 0.0667 |
| 5147 | PDE6D | LZE8T | Human | Esophagus | ESCC | 7.98e-08 | 3.23e-01 | 0.067 |
| 5147 | PDE6D | LZE24T | Human | Esophagus | ESCC | 8.42e-22 | 5.81e-01 | 0.0596 |
| 5147 | PDE6D | LZE6T | Human | Esophagus | ESCC | 1.07e-03 | 2.53e-01 | 0.0845 |
| 5147 | PDE6D | P1T-E | Human | Esophagus | ESCC | 1.21e-11 | 5.71e-01 | 0.0875 |
| 5147 | PDE6D | P2T-E | Human | Esophagus | ESCC | 1.59e-21 | 4.16e-01 | 0.1177 |
| 5147 | PDE6D | P4T-E | Human | Esophagus | ESCC | 1.49e-18 | 4.49e-01 | 0.1323 |
| 5147 | PDE6D | P5T-E | Human | Esophagus | ESCC | 3.78e-17 | 2.59e-01 | 0.1327 |
| 5147 | PDE6D | P8T-E | Human | Esophagus | ESCC | 8.20e-31 | 6.01e-01 | 0.0889 |
| 5147 | PDE6D | P9T-E | Human | Esophagus | ESCC | 9.48e-21 | 4.68e-01 | 0.1131 |
| 5147 | PDE6D | P10T-E | Human | Esophagus | ESCC | 6.21e-24 | 4.41e-01 | 0.116 |
| 5147 | PDE6D | P11T-E | Human | Esophagus | ESCC | 5.80e-18 | 6.41e-01 | 0.1426 |
| 5147 | PDE6D | P12T-E | Human | Esophagus | ESCC | 2.08e-21 | 5.32e-01 | 0.1122 |
| 5147 | PDE6D | P15T-E | Human | Esophagus | ESCC | 1.98e-22 | 5.57e-01 | 0.1149 |
| 5147 | PDE6D | P16T-E | Human | Esophagus | ESCC | 2.00e-25 | 4.32e-01 | 0.1153 |
| 5147 | PDE6D | P17T-E | Human | Esophagus | ESCC | 8.29e-05 | 3.72e-01 | 0.1278 |
| 5147 | PDE6D | P19T-E | Human | Esophagus | ESCC | 1.93e-09 | 7.47e-01 | 0.1662 |
| 5147 | PDE6D | P20T-E | Human | Esophagus | ESCC | 6.36e-24 | 5.60e-01 | 0.1124 |
| 5147 | PDE6D | P21T-E | Human | Esophagus | ESCC | 3.88e-32 | 7.21e-01 | 0.1617 |
| Page: 1 2 3 4 5 |
| Tissue | Expression Dynamics | Abbreviation |
| Esophagus | 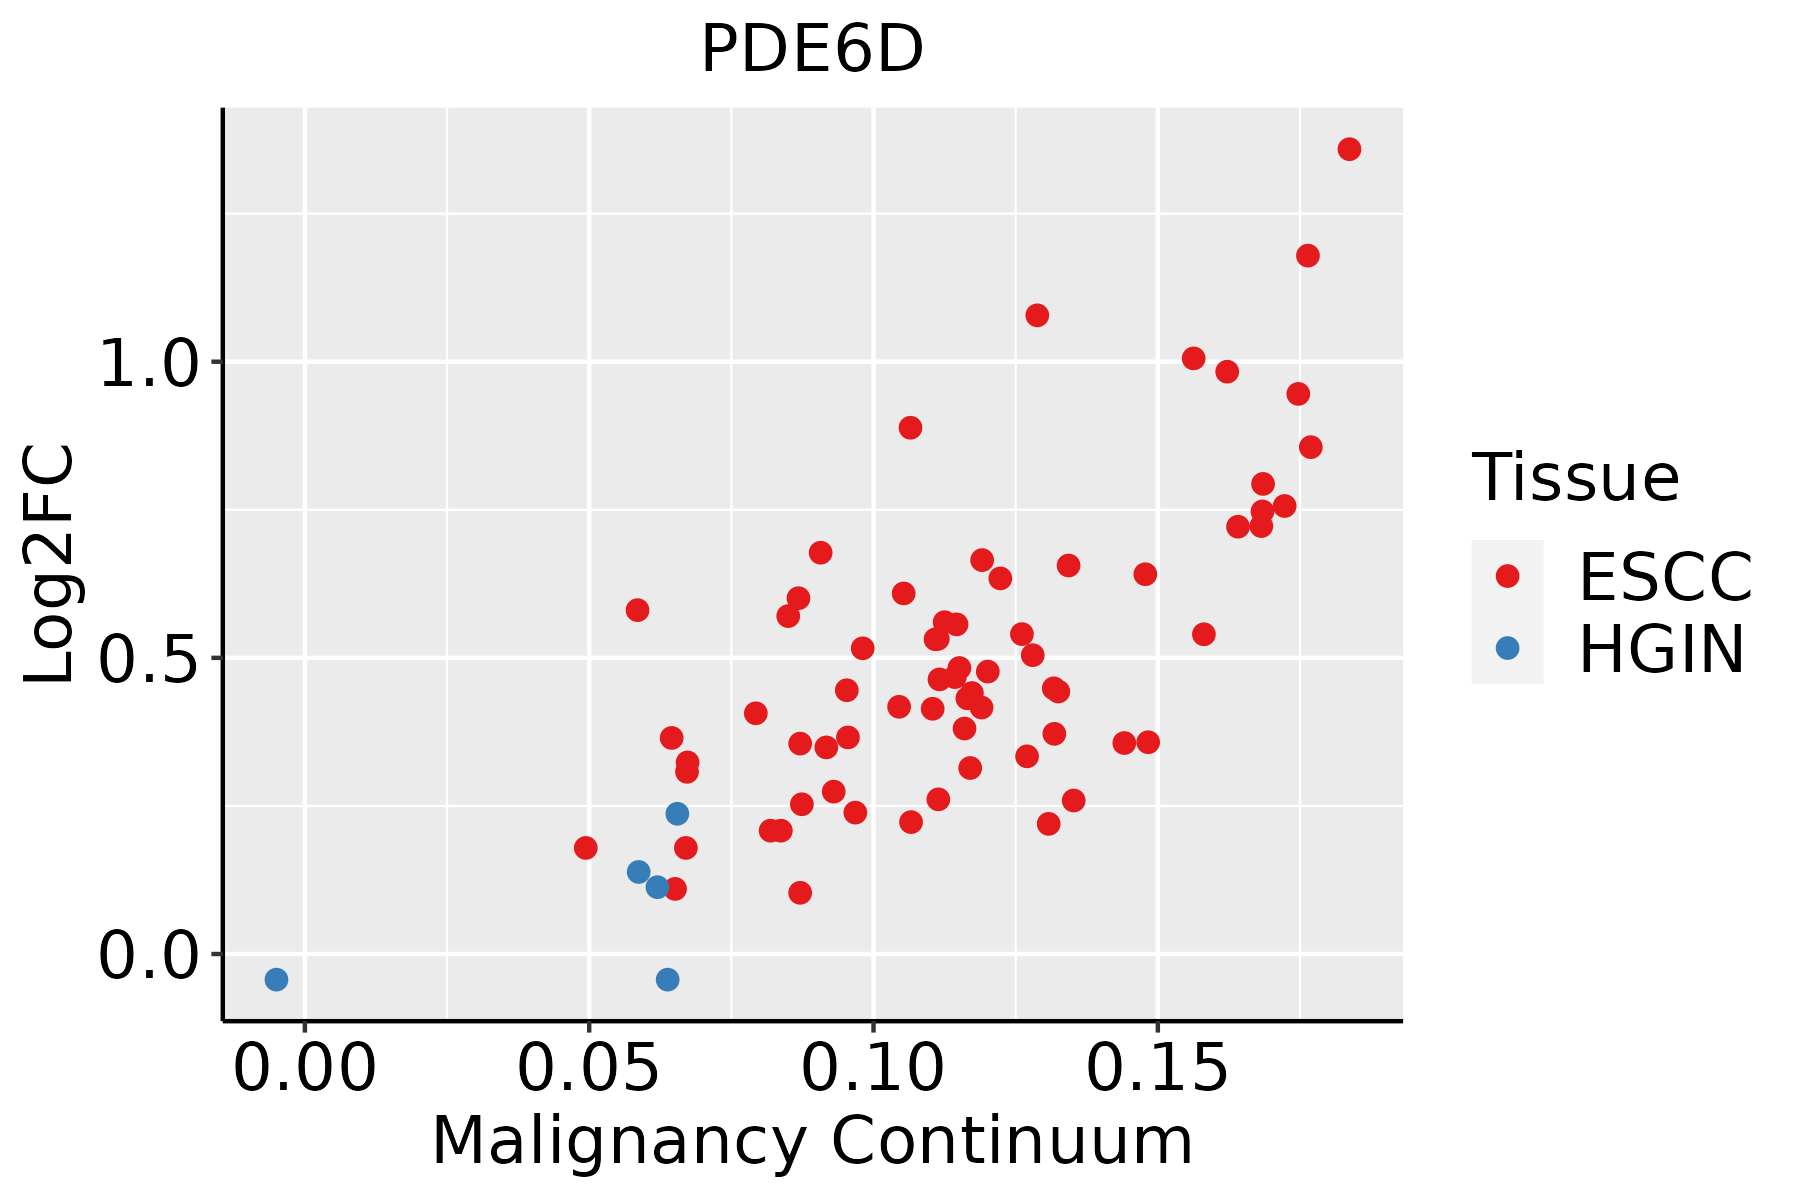 | ESCC: Esophageal squamous cell carcinoma |
| HGIN: High-grade intraepithelial neoplasias | ||
| LGIN: Low-grade intraepithelial neoplasias | ||
| Liver | 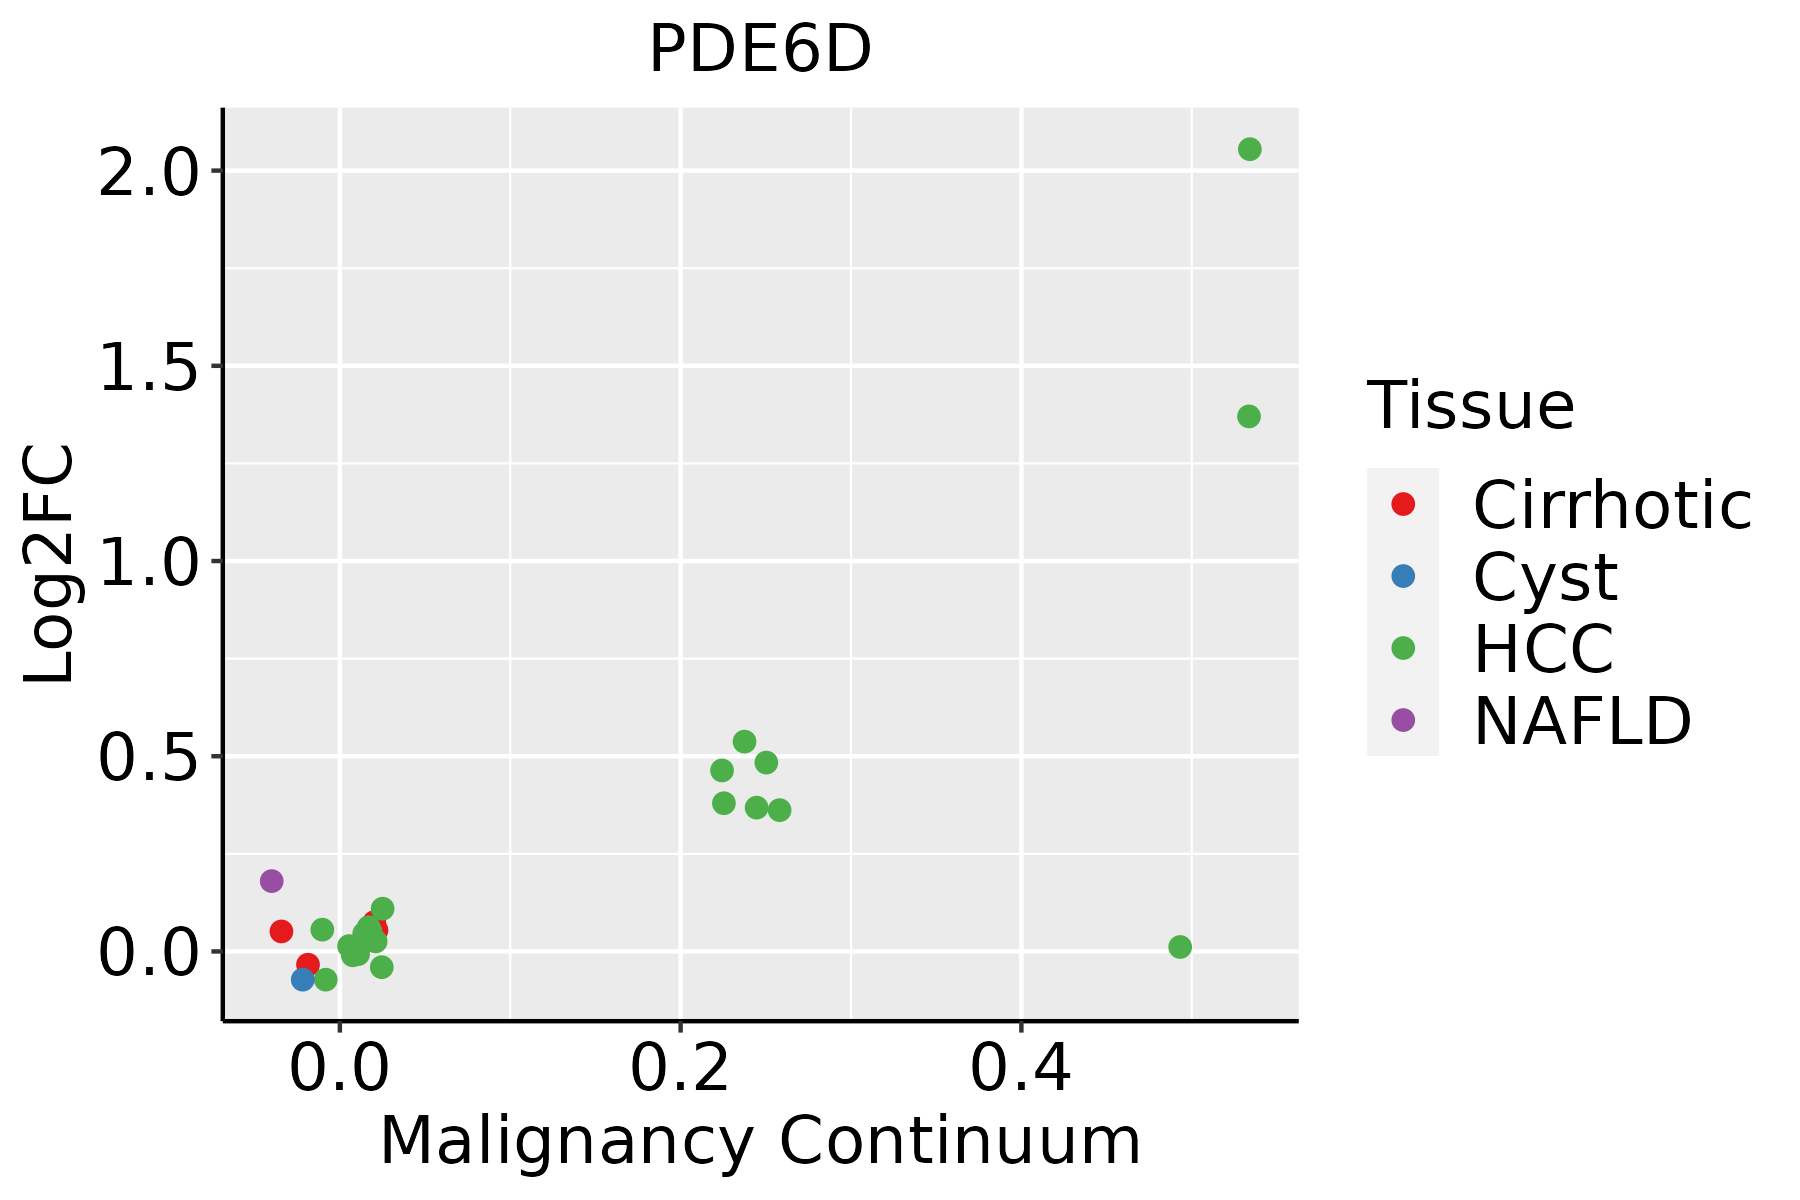 | HCC: Hepatocellular carcinoma |
| NAFLD: Non-alcoholic fatty liver disease | ||
| Oral Cavity | 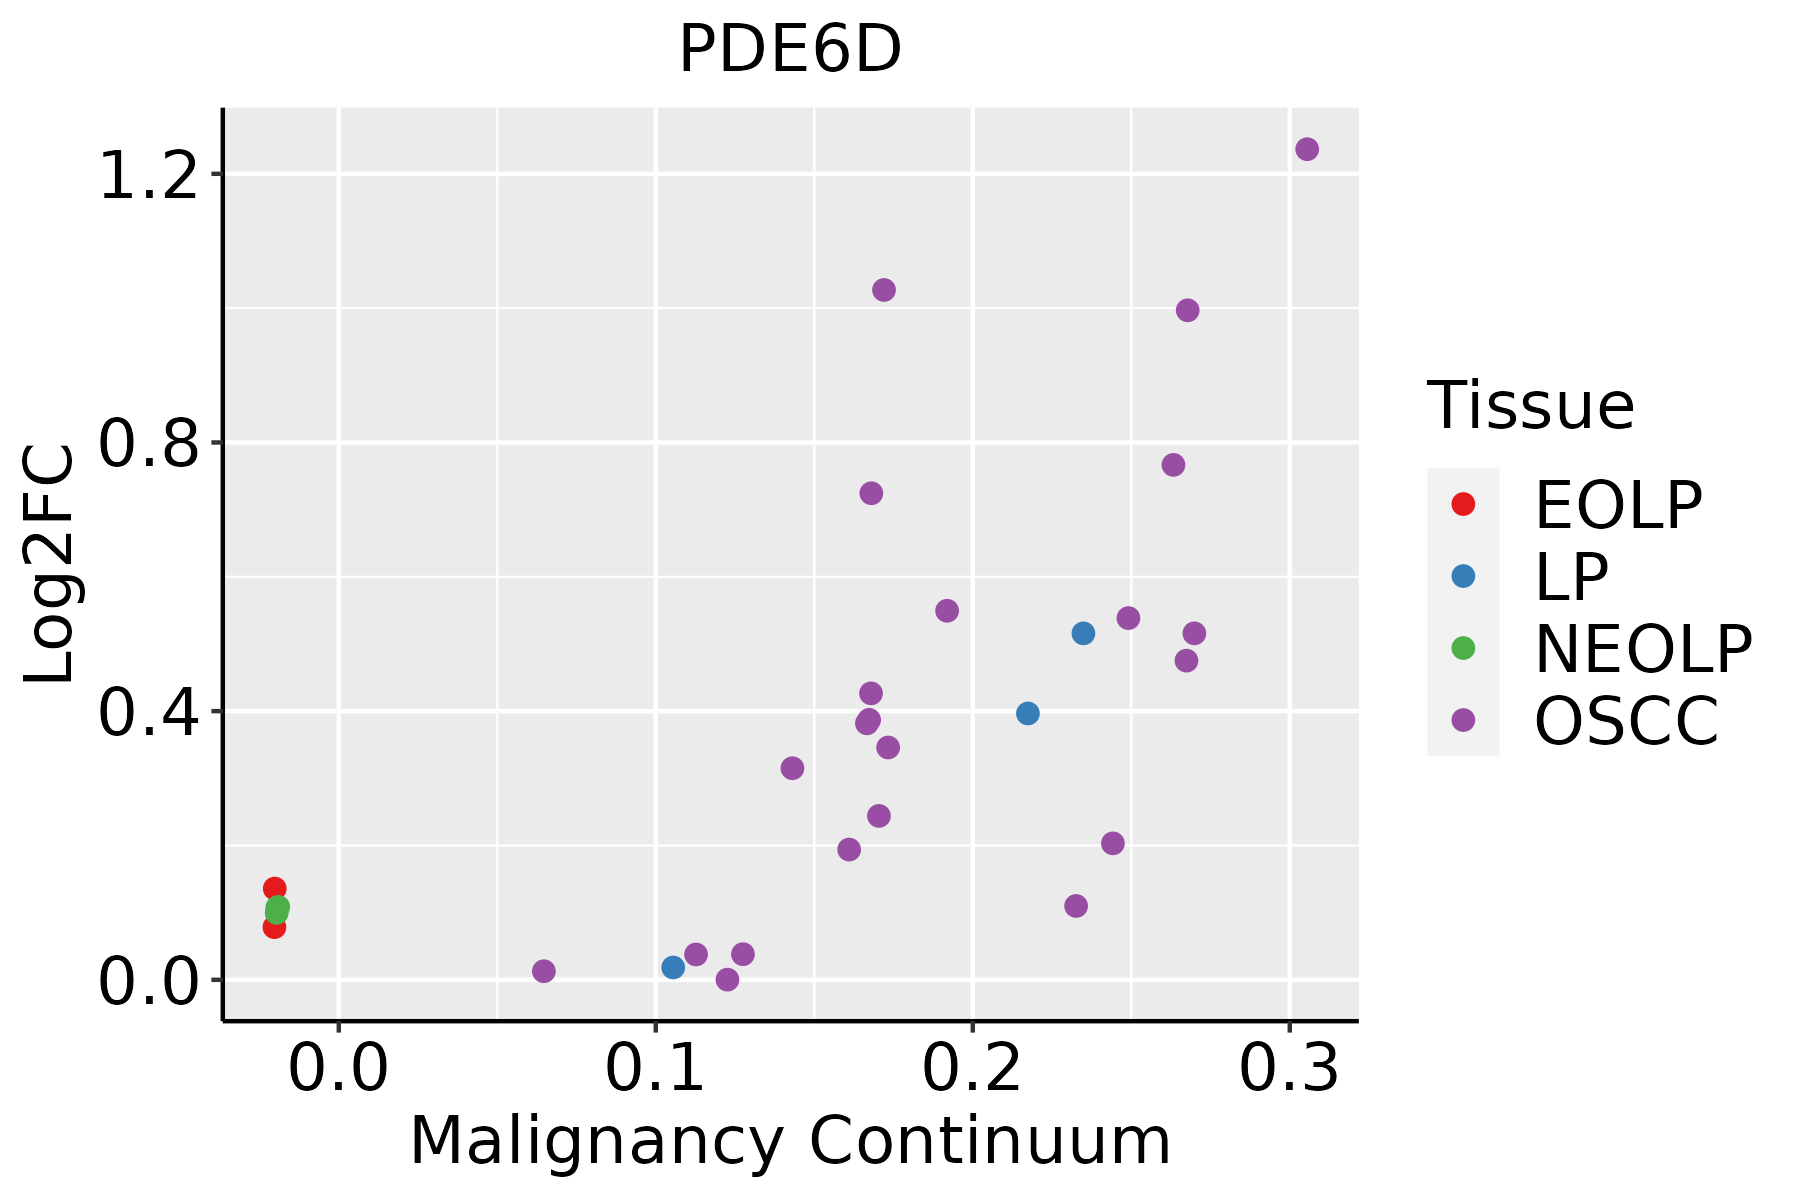 | EOLP: Erosive Oral lichen planus |
| LP: leukoplakia | ||
| NEOLP: Non-erosive oral lichen planus | ||
| OSCC: Oral squamous cell carcinoma |
| ∗log2FC in expression of this searched gene in stem-like cells from each diseased tissue sample relative to stem-like cells in normal samples in each tissue plotted against the malignancy continuum. Samples are colored based on if they are from different disease stage. |
Top |
Malignant transformation related pathway analysis |
| Find out the enriched GO biological processes and KEGG pathways involved in transition from healthy to precancer to cancer |
| Tissue | Disease Stage | Enriched GO biological Processes |
| Colorectum | AD |  |
| Colorectum | SER |  |
| Colorectum | MSS |  |
| Colorectum | MSI-H |  |
| Colorectum | FAP |  |
| ∗Top 15 enriched GO BP terms are showed in the bar plot of each disease state in each tissue. Each row represents a significant GO biological process which is colored according to the -log10(p.adjust). |
| Page: 1 2 3 4 5 6 7 8 9 |
| GO ID | Tissue | Disease Stage | Description | Gene Ratio | Bg Ratio | pvalue | p.adjust | Count |
| Page: 1 |
| Pathway ID | Tissue | Disease Stage | Description | Gene Ratio | Bg Ratio | pvalue | p.adjust | qvalue | Count |
| Page: 1 |
Top |
Cell-cell communication analysis |
| Identification of potential cell-cell interactions between two cell types and their ligand-receptor pairs for different disease states |
| Ligand | Receptor | LRpair | Pathway | Tissue | Disease Stage |
| Page: 1 |
Top |
Single-cell gene regulatory network inference analysis |
| Find out the significant the regulons (TFs) and the target genes of each regulon across cell types for different disease states |
| TF | Cell Type | Tissue | Disease Stage | Target Gene | RSS | Regulon Activity |
| ∗The dot plots of a searched regulon are shown for all cell subpopulations in each disease state of each tissue based on the regulon specific score inferred using pySCENIC and by calculating the average expression. |
| Page: 1 |
Top |
Somatic mutation of malignant transformation related genes |
| Annotation of somatic variants for genes involved in malignant transformation |
| Hugo Symbol | Variant Class | Variant Classification | dbSNP RS | HGVSc | HGVSp | HGVSp Short | SWISSPROT | BIOTYPE | SIFT | PolyPhen | Tumor Sample Barcode | Tissue | Histology | Sex | Age | Stage | Therapy Types | Drugs | Outcome |
| PDE6D | SNV | Missense_Mutation | c.106G>A | p.Glu36Lys | p.E36K | O43924 | protein_coding | tolerated(0.29) | benign(0.028) | TCGA-LD-A74U-01 | Breast | breast invasive carcinoma | Female | >=65 | III/IV | Chemotherapy | taxotere | SD | |
| PDE6D | insertion | Nonsense_Mutation | novel | c.178_179insTTATTTTATTTTTTTAAAAAACA | p.Ser60PhefsTer6 | p.S60Ffs*6 | O43924 | protein_coding | TCGA-B6-A0I5-01 | Breast | breast invasive carcinoma | Female | <65 | I/II | Unknown | Unknown | SD | ||
| PDE6D | SNV | Missense_Mutation | c.16G>C | p.Glu6Gln | p.E6Q | O43924 | protein_coding | tolerated(0.41) | benign(0) | TCGA-Q1-A5R2-01 | Cervix | cervical & endocervical cancer | Female | <65 | I/II | Chemotherapy | cisplatin | PR | |
| PDE6D | SNV | Missense_Mutation | c.200C>T | p.Ser67Leu | p.S67L | O43924 | protein_coding | deleterious(0) | probably_damaging(0.997) | TCGA-AA-3510-01 | Colorectum | colon adenocarcinoma | Male | >=65 | I/II | Unknown | Unknown | SD | |
| PDE6D | SNV | Missense_Mutation | c.158N>A | p.Ile53Asn | p.I53N | O43924 | protein_coding | deleterious(0) | probably_damaging(1) | TCGA-EI-6511-01 | Colorectum | rectum adenocarcinoma | Male | <65 | III/IV | Chemotherapy | oxaliplatinum+5-fu | SD | |
| PDE6D | SNV | Missense_Mutation | c.380N>C | p.Val127Ala | p.V127A | O43924 | protein_coding | deleterious(0) | possibly_damaging(0.669) | TCGA-B5-A11N-01 | Endometrium | uterine corpus endometrioid carcinoma | Female | >=65 | I/II | Unknown | Unknown | SD | |
| PDE6D | SNV | Missense_Mutation | rs767716256 | c.143N>A | p.Arg48His | p.R48H | O43924 | protein_coding | tolerated(0.34) | benign(0.01) | TCGA-D1-A167-01 | Endometrium | uterine corpus endometrioid carcinoma | Female | >=65 | I/II | Unknown | Unknown | SD |
| PDE6D | SNV | Missense_Mutation | rs758019119 | c.223N>T | p.Arg75Cys | p.R75C | O43924 | protein_coding | deleterious(0.05) | benign(0.303) | TCGA-EJ-A7NN-01 | Prostate | prostate adenocarcinoma | Male | <65 | 7 | Unknown | Unknown | PD |
| PDE6D | SNV | Missense_Mutation | c.385A>G | p.Ile129Val | p.I129V | O43924 | protein_coding | tolerated(0.16) | benign(0.076) | TCGA-CD-A4MG-01 | Stomach | stomach adenocarcinoma | Male | >=65 | I/II | Unknown | Unknown | PD |
| Page: 1 |
Top |
Related drugs of malignant transformation related genes |
| Identification of chemicals and drugs interact with genes involved in malignant transfromation |
| (DGIdb 4.0) |
| Entrez ID | Symbol | Category | Interaction Types | Drug Claim Name | Drug Name | PMIDs |
| 5147 | PDE6D | ENZYME, DRUGGABLE GENOME | inhibitor | CHEMBL628 | PENTOXIFYLLINE | |
| 5147 | PDE6D | ENZYME, DRUGGABLE GENOME | inhibitor | CHEMBL932 | DIPYRIDAMOLE |
| Page: 1 |

Copyright 2023-Present -The University of Texas Health Science Center at Houston |