
|
|||||
|
 | |
| |
| |
| |
| |
| |
|
Gene: PDE4DIP |
Gene summary for PDE4DIP |
| Gene information | Species | Human | Gene symbol | PDE4DIP | Gene ID | 9659 |
| Gene name | phosphodiesterase 4D interacting protein | |
| Gene Alias | CMYA2 | |
| Cytomap | 1q21.2 | |
| Gene Type | protein-coding | GO ID | GO:0006996 | UniProtAcc | Q5VU43 |
Top |
Malignant transformation analysis |
| Identification of the aberrant gene expression in precancerous and cancerous lesions by comparing the gene expression of stem-like cells in diseased tissues with normal stem cells |
| Entrez ID | Symbol | Replicates | Species | Organ | Tissue | Adj P-value | Log2FC | Malignancy |
| 9659 | PDE4DIP | LZE4T | Human | Esophagus | ESCC | 1.39e-02 | 1.40e-01 | 0.0811 |
| 9659 | PDE4DIP | LZE7T | Human | Esophagus | ESCC | 3.45e-05 | 2.75e-01 | 0.0667 |
| 9659 | PDE4DIP | LZE24T | Human | Esophagus | ESCC | 5.21e-12 | 3.25e-01 | 0.0596 |
| 9659 | PDE4DIP | LZE6T | Human | Esophagus | ESCC | 7.39e-03 | 2.08e-01 | 0.0845 |
| 9659 | PDE4DIP | P2T-E | Human | Esophagus | ESCC | 1.04e-16 | 3.31e-01 | 0.1177 |
| 9659 | PDE4DIP | P4T-E | Human | Esophagus | ESCC | 6.24e-13 | 2.97e-01 | 0.1323 |
| 9659 | PDE4DIP | P5T-E | Human | Esophagus | ESCC | 1.75e-07 | 1.92e-01 | 0.1327 |
| 9659 | PDE4DIP | P8T-E | Human | Esophagus | ESCC | 1.99e-16 | 1.81e-01 | 0.0889 |
| 9659 | PDE4DIP | P9T-E | Human | Esophagus | ESCC | 9.61e-13 | 3.19e-01 | 0.1131 |
| 9659 | PDE4DIP | P10T-E | Human | Esophagus | ESCC | 6.35e-41 | 6.94e-01 | 0.116 |
| 9659 | PDE4DIP | P11T-E | Human | Esophagus | ESCC | 9.72e-17 | 7.65e-01 | 0.1426 |
| 9659 | PDE4DIP | P12T-E | Human | Esophagus | ESCC | 1.53e-13 | 2.19e-01 | 0.1122 |
| 9659 | PDE4DIP | P15T-E | Human | Esophagus | ESCC | 6.54e-10 | 2.99e-01 | 0.1149 |
| 9659 | PDE4DIP | P16T-E | Human | Esophagus | ESCC | 4.58e-11 | 2.49e-01 | 0.1153 |
| 9659 | PDE4DIP | P17T-E | Human | Esophagus | ESCC | 2.44e-06 | 3.86e-01 | 0.1278 |
| 9659 | PDE4DIP | P19T-E | Human | Esophagus | ESCC | 3.41e-08 | 7.93e-01 | 0.1662 |
| 9659 | PDE4DIP | P20T-E | Human | Esophagus | ESCC | 1.05e-05 | 2.31e-01 | 0.1124 |
| 9659 | PDE4DIP | P21T-E | Human | Esophagus | ESCC | 2.42e-15 | 2.34e-01 | 0.1617 |
| 9659 | PDE4DIP | P22T-E | Human | Esophagus | ESCC | 1.07e-20 | 2.75e-01 | 0.1236 |
| 9659 | PDE4DIP | P23T-E | Human | Esophagus | ESCC | 8.93e-15 | 5.01e-01 | 0.108 |
| Page: 1 2 3 4 5 |
| Tissue | Expression Dynamics | Abbreviation |
| Esophagus | 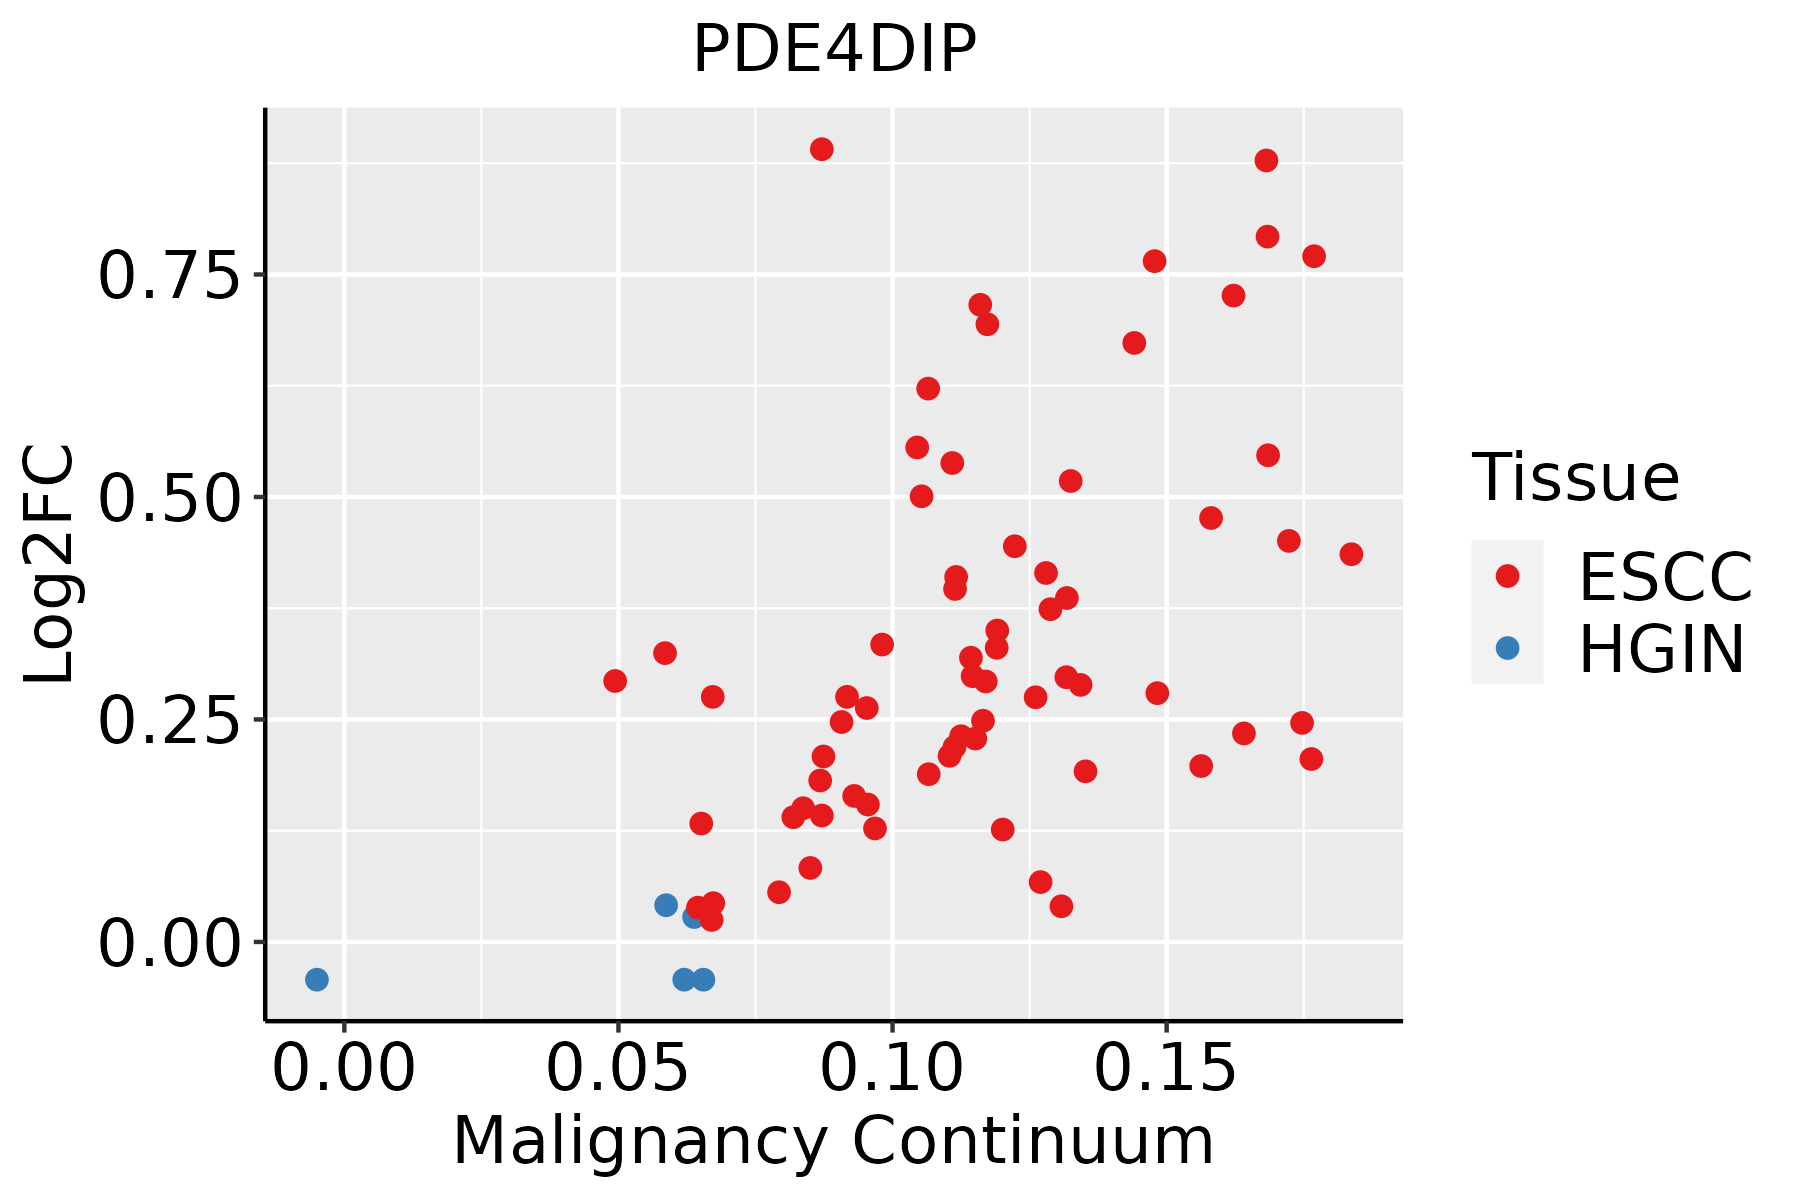 | ESCC: Esophageal squamous cell carcinoma |
| HGIN: High-grade intraepithelial neoplasias | ||
| LGIN: Low-grade intraepithelial neoplasias | ||
| Liver | 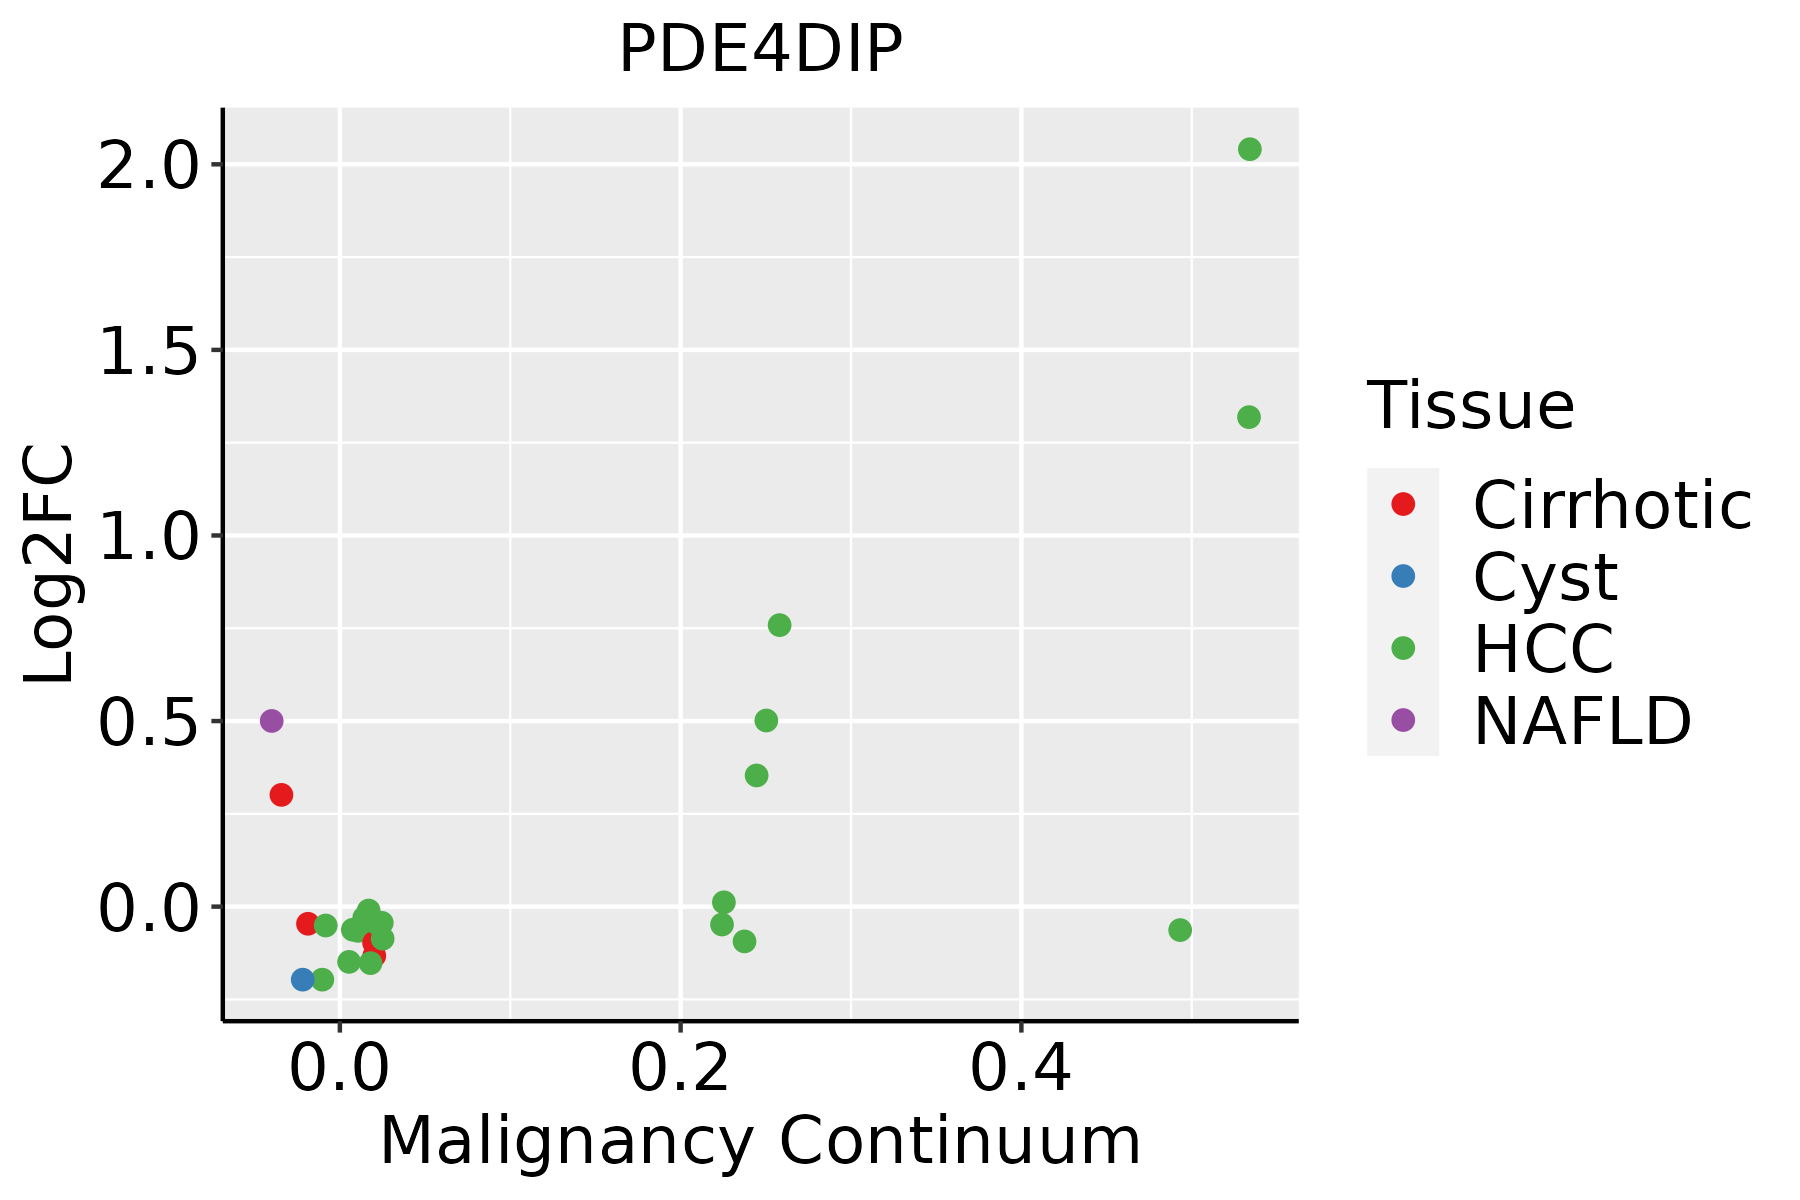 | HCC: Hepatocellular carcinoma |
| NAFLD: Non-alcoholic fatty liver disease | ||
| Prostate | 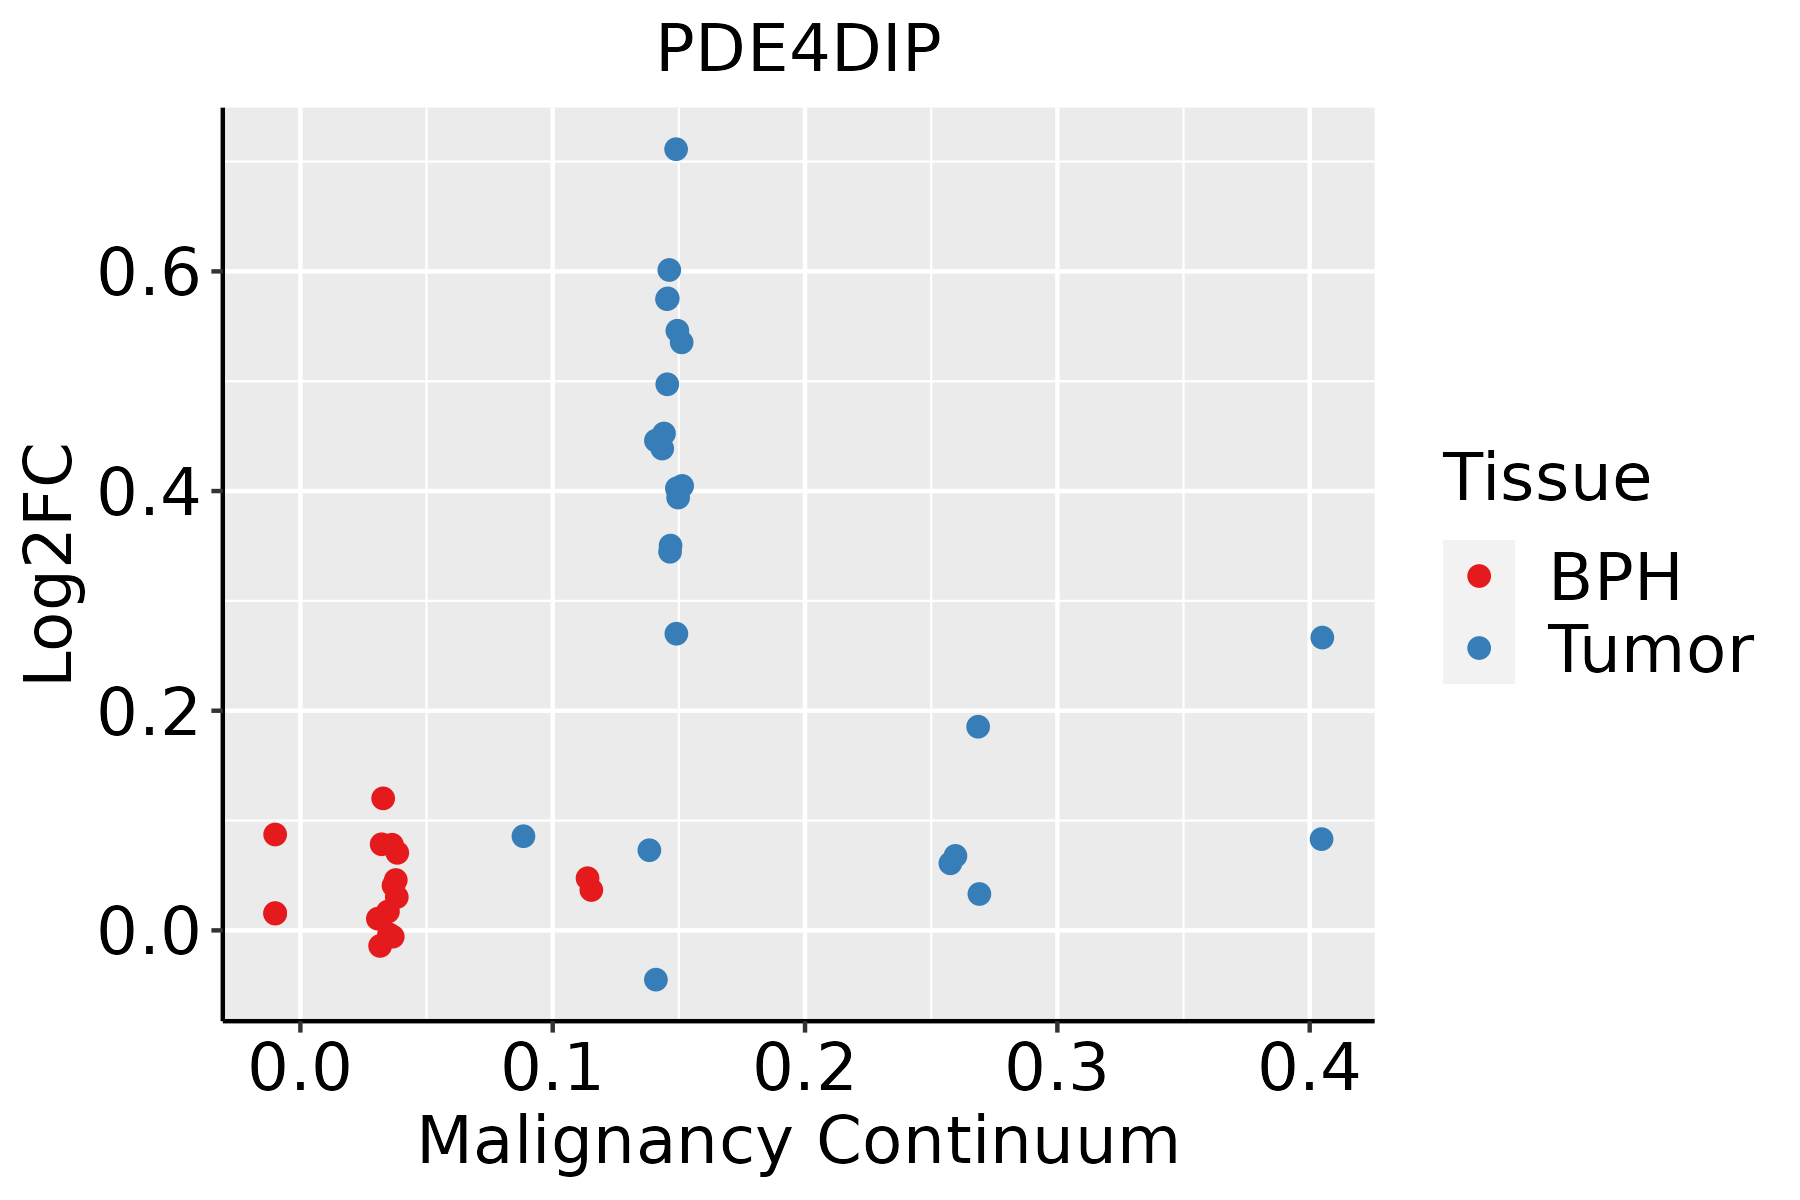 | BPH: Benign Prostatic Hyperplasia |
| Thyroid | 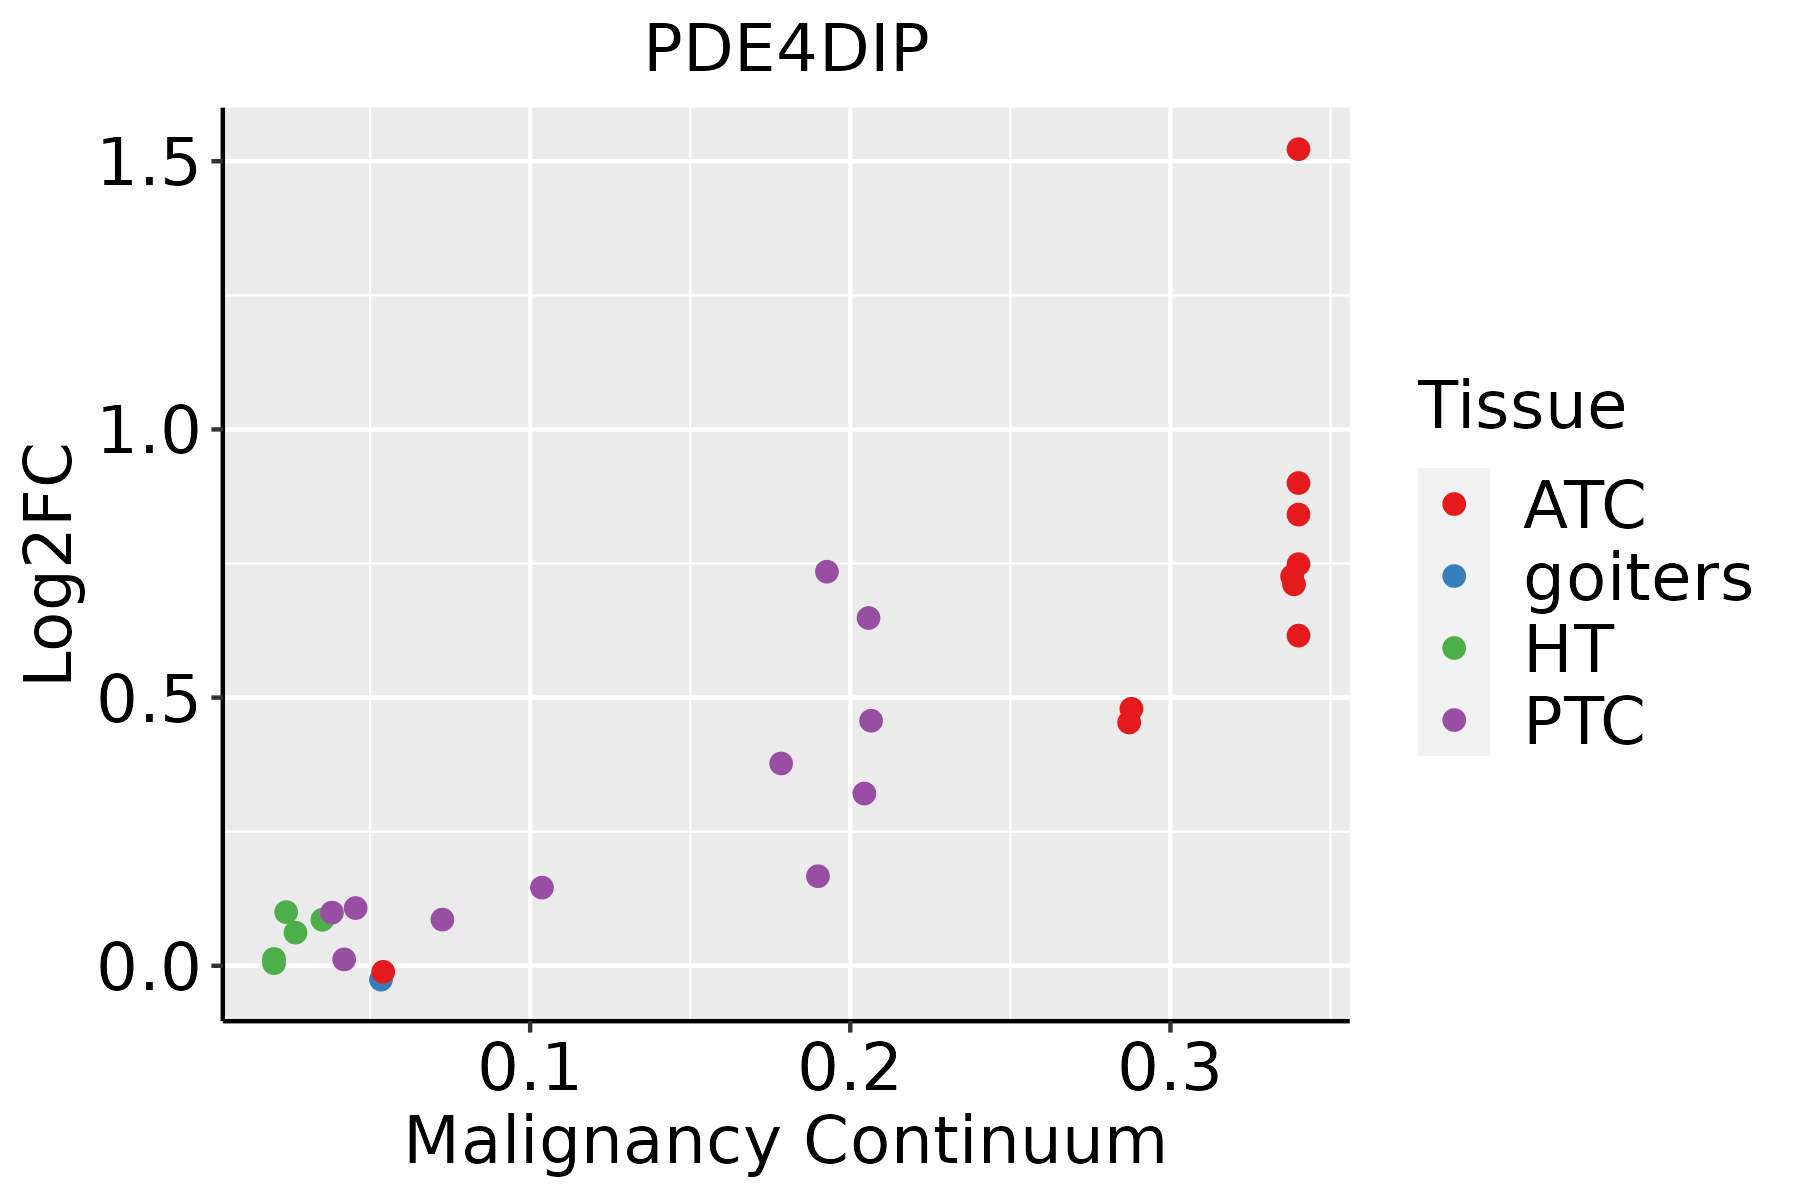 | ATC: Anaplastic thyroid cancer |
| HT: Hashimoto's thyroiditis | ||
| PTC: Papillary thyroid cancer |
| ∗log2FC in expression of this searched gene in stem-like cells from each diseased tissue sample relative to stem-like cells in normal samples in each tissue plotted against the malignancy continuum. Samples are colored based on if they are from different disease stage. |
Top |
Malignant transformation related pathway analysis |
| Find out the enriched GO biological processes and KEGG pathways involved in transition from healthy to precancer to cancer |
| Tissue | Disease Stage | Enriched GO biological Processes |
| Colorectum | AD |  |
| Colorectum | SER |  |
| Colorectum | MSS |  |
| Colorectum | MSI-H |  |
| Colorectum | FAP |  |
| ∗Top 15 enriched GO BP terms are showed in the bar plot of each disease state in each tissue. Each row represents a significant GO biological process which is colored according to the -log10(p.adjust). |
| Page: 1 2 3 4 5 6 7 8 9 |
| GO ID | Tissue | Disease Stage | Description | Gene Ratio | Bg Ratio | pvalue | p.adjust | Count |
| GO:00070308 | Esophagus | ESCC | Golgi organization | 101/8552 | 157/18723 | 1.78e-06 | 2.10e-05 | 101 |
| GO:0007030 | Liver | NAFLD | Golgi organization | 36/1882 | 157/18723 | 1.76e-06 | 7.68e-05 | 36 |
| GO:1903358 | Liver | NAFLD | regulation of Golgi organization | 7/1882 | 17/18723 | 8.03e-04 | 9.95e-03 | 7 |
| GO:00070301 | Liver | Cirrhotic | Golgi organization | 68/4634 | 157/18723 | 2.57e-07 | 6.41e-06 | 68 |
| GO:19033581 | Liver | Cirrhotic | regulation of Golgi organization | 10/4634 | 17/18723 | 2.85e-03 | 1.64e-02 | 10 |
| GO:00070302 | Liver | HCC | Golgi organization | 99/7958 | 157/18723 | 1.54e-07 | 2.85e-06 | 99 |
| GO:19033582 | Liver | HCC | regulation of Golgi organization | 13/7958 | 17/18723 | 4.77e-03 | 2.02e-02 | 13 |
| GO:000703013 | Prostate | Tumor | Golgi organization | 40/3246 | 157/18723 | 6.33e-03 | 2.90e-02 | 40 |
| GO:000703010 | Thyroid | PTC | Golgi organization | 79/5968 | 157/18723 | 1.11e-06 | 1.64e-05 | 79 |
| GO:000703015 | Thyroid | ATC | Golgi organization | 79/6293 | 157/18723 | 1.07e-05 | 1.05e-04 | 79 |
| Page: 1 |
| Pathway ID | Tissue | Disease Stage | Description | Gene Ratio | Bg Ratio | pvalue | p.adjust | qvalue | Count |
| Page: 1 |
Top |
Cell-cell communication analysis |
| Identification of potential cell-cell interactions between two cell types and their ligand-receptor pairs for different disease states |
| Ligand | Receptor | LRpair | Pathway | Tissue | Disease Stage |
| Page: 1 |
Top |
Single-cell gene regulatory network inference analysis |
| Find out the significant the regulons (TFs) and the target genes of each regulon across cell types for different disease states |
| TF | Cell Type | Tissue | Disease Stage | Target Gene | RSS | Regulon Activity |
| ∗The dot plots of a searched regulon are shown for all cell subpopulations in each disease state of each tissue based on the regulon specific score inferred using pySCENIC and by calculating the average expression. |
| Page: 1 |
Top |
Somatic mutation of malignant transformation related genes |
| Annotation of somatic variants for genes involved in malignant transformation |
| Hugo Symbol | Variant Class | Variant Classification | dbSNP RS | HGVSc | HGVSp | HGVSp Short | SWISSPROT | BIOTYPE | SIFT | PolyPhen | Tumor Sample Barcode | Tissue | Histology | Sex | Age | Stage | Therapy Types | Drugs | Outcome |
| PDE4DIP | SNV | Missense_Mutation | novel | c.485N>G | p.Asp162Gly | p.D162G | protein_coding | tolerated(0.09) | benign(0.007) | TCGA-A2-A3XS-01 | Breast | breast invasive carcinoma | Female | <65 | III/IV | Chemotherapy | cytoxan | PD | |
| PDE4DIP | SNV | Missense_Mutation | c.5623N>T | p.Arg1875Trp | p.R1875W | protein_coding | deleterious(0.01) | benign(0.179) | TCGA-A8-A06U-01 | Breast | breast invasive carcinoma | Female | >=65 | I/II | Unknown | Unknown | SD | ||
| PDE4DIP | SNV | Missense_Mutation | c.181G>C | p.Glu61Gln | p.E61Q | protein_coding | deleterious(0) | probably_damaging(0.998) | TCGA-AC-A23H-01 | Breast | breast invasive carcinoma | Female | >=65 | I/II | Unknown | Unknown | PD | ||
| PDE4DIP | SNV | Missense_Mutation | c.790G>A | p.Glu264Lys | p.E264K | protein_coding | deleterious(0) | possibly_damaging(0.559) | TCGA-AC-A23H-01 | Breast | breast invasive carcinoma | Female | >=65 | I/II | Unknown | Unknown | PD | ||
| PDE4DIP | SNV | Missense_Mutation | c.4862C>G | p.Ser1621Cys | p.S1621C | protein_coding | deleterious(0) | probably_damaging(1) | TCGA-AC-A23H-01 | Breast | breast invasive carcinoma | Female | >=65 | I/II | Unknown | Unknown | PD | ||
| PDE4DIP | SNV | Missense_Mutation | c.1108N>A | p.Ala370Thr | p.A370T | protein_coding | tolerated(0.1) | benign(0.112) | TCGA-AN-A0AT-01 | Breast | breast invasive carcinoma | Female | <65 | I/II | Unknown | Unknown | SD | ||
| PDE4DIP | SNV | Missense_Mutation | novel | c.240C>A | p.Asn80Lys | p.N80K | protein_coding | deleterious(0.01) | benign(0.127) | TCGA-AO-A0JB-01 | Breast | breast invasive carcinoma | Female | <65 | III/IV | Chemotherapy | cyclophosphamide | SD | |
| PDE4DIP | SNV | Missense_Mutation | c.4465N>T | p.Arg1489Trp | p.R1489W | protein_coding | deleterious(0) | probably_damaging(0.998) | TCGA-AR-A0TY-01 | Breast | breast invasive carcinoma | Female | <65 | I/II | Unspecific | Paclitaxel | PD | ||
| PDE4DIP | SNV | Missense_Mutation | novel | c.4979N>T | p.Ser1660Leu | p.S1660L | protein_coding | tolerated(0.14) | benign(0.045) | TCGA-BH-A0B6-01 | Breast | breast invasive carcinoma | Female | <65 | I/II | Unknown | Unknown | SD | |
| PDE4DIP | SNV | Missense_Mutation | c.4166N>T | p.Ser1389Leu | p.S1389L | protein_coding | deleterious(0) | possibly_damaging(0.658) | TCGA-BH-A0HB-01 | Breast | breast invasive carcinoma | Female | <65 | I/II | Chemotherapy | docetaxel | SD |
| Page: 1 2 3 4 5 6 7 8 9 10 11 12 13 14 15 16 17 18 19 20 21 22 23 |
Top |
Related drugs of malignant transformation related genes |
| Identification of chemicals and drugs interact with genes involved in malignant transfromation |
| (DGIdb 4.0) |
| Entrez ID | Symbol | Category | Interaction Types | Drug Claim Name | Drug Name | PMIDs |
| Page: 1 |

Copyright 2023-Present -The University of Texas Health Science Center at Houston |