Schematic overview of the cellular and molecular mechanisms involved in the cancer progression, including the proposed cellular and molecular mechanisms in cancer cells trajectory. AT1: alveolar type 1 cells; AT2: alveolar type 2 cells; AAH: atypical adenomatous hyperplasia; AIS: adenocarcinoma in situ; MIA: minimally invasive adenocarcinoma; IA: invasive adenocarcinoma; EMT: epithelial-mesenchymal transition

Home

Download

Statistics

Help

Contact

Center for Computational Systems Medicine
leaf

Gene summary

leaf

Malignant transformation analysis

leaf

Malignant transformation related pathway analysis

leaf

Cell-cell communication analysis

leaf

Single-cell gene regulatory network inference analysis

leaf

Somatic mutation of malignant transformation related genes

leaf

Related drugs of malignant transformation related genes

Gene: PDE4C

Gene summary for PDE4C

check button Gene summary.

Gene informationSpeciesHuman
Gene symbol

PDE4C

Gene ID

5143

Gene namephosphodiesterase 4C
Gene AliasDPDE1
Cytomap19p13.11
Gene Typeprotein-coding
GO ID

GO:0006139

UniProtAcc

O43849


Top

Malignant transformation analysis

check button Identification of the aberrant gene expression in precancerous and cancerous lesions by comparing the gene expression of stem-like cells in diseased tissues with normal stem cells
check button Malignant transformation involving gene list.
Entrez IDSymbolReplicatesSpeciesOrganTissueAdj P-valueLog2FCMalignancy
5143PDE4CHTA11_3410_2000001011HumanColorectumAD4.20e-029.73e-020.0155
5143PDE4CHTA11_2487_2000001011HumanColorectumSER1.18e-276.86e-01-0.1808
5143PDE4CHTA11_1938_2000001011HumanColorectumAD3.41e-164.80e-01-0.0811
5143PDE4CHTA11_78_2000001011HumanColorectumAD6.11e-041.68e-01-0.1088
5143PDE4CHTA11_347_2000001011HumanColorectumAD2.14e-621.05e+00-0.1954
5143PDE4CHTA11_411_2000001011HumanColorectumSER6.42e-181.29e+00-0.2602
5143PDE4CHTA11_2112_2000001011HumanColorectumSER2.75e-126.59e-01-0.2196
5143PDE4CHTA11_3361_2000001011HumanColorectumAD6.03e-083.50e-01-0.1207
5143PDE4CHTA11_83_2000001011HumanColorectumSER2.83e-155.43e-01-0.1526
5143PDE4CHTA11_696_2000001011HumanColorectumAD3.28e-346.47e-01-0.1464
5143PDE4CHTA11_866_2000001011HumanColorectumAD2.71e-265.05e-01-0.1001
5143PDE4CHTA11_1391_2000001011HumanColorectumAD4.56e-174.36e-01-0.059
5143PDE4CHTA11_2992_2000001011HumanColorectumSER1.02e-198.95e-01-0.1706
5143PDE4CHTA11_5212_2000001011HumanColorectumAD1.67e-104.78e-01-0.2061
5143PDE4CHTA11_5216_2000001011HumanColorectumSER1.20e-126.52e-01-0.1462
5143PDE4CHTA11_546_2000001011HumanColorectumAD1.19e-227.58e-01-0.0842
5143PDE4CHTA11_866_3004761011HumanColorectumAD6.26e-041.18e-010.096
5143PDE4CHTA11_4255_2000001011HumanColorectumSER1.51e-115.15e-010.0446
5143PDE4CHTA11_9408_2000001011HumanColorectumAD4.54e-063.39e-010.0451
5143PDE4CHTA11_8622_2000001021HumanColorectumSER6.58e-135.44e-010.0528
Page: 1 2 3 

check button Transcriptomic changes along malignancy continuum.
TissueExpression DynamicsAbbreviation
Colorectum (GSE201348)The image shows the transcriptomic changes along malignancy continuum.log2FC in expression of this searched gene in stem-like cells from each diseased tissue sample relative to stem-like cells in normal samples in each tissue plotted against the malignancy continuum. Samples are colored based on if they are from different disease stage.FAP: Familial adenomatous polyposis
CRC: Colorectal cancer
Colorectum (HTA11)The image shows the transcriptomic changes along malignancy continuum.log2FC in expression of this searched gene in stem-like cells from each diseased tissue sample relative to stem-like cells in normal samples in each tissue plotted against the malignancy continuum. Samples are colored based on if they are from different disease stage.AD: Adenomas
SER: Sessile serrated lesions
MSI-H: Microsatellite-high colorectal cancer
MSS: Microsatellite stable colorectal cancer
EndometriumThe image shows the transcriptomic changes along malignancy continuum.log2FC in expression of this searched gene in stem-like cells from each diseased tissue sample relative to stem-like cells in normal samples in each tissue plotted against the malignancy continuum. Samples are colored based on if they are from different disease stage.
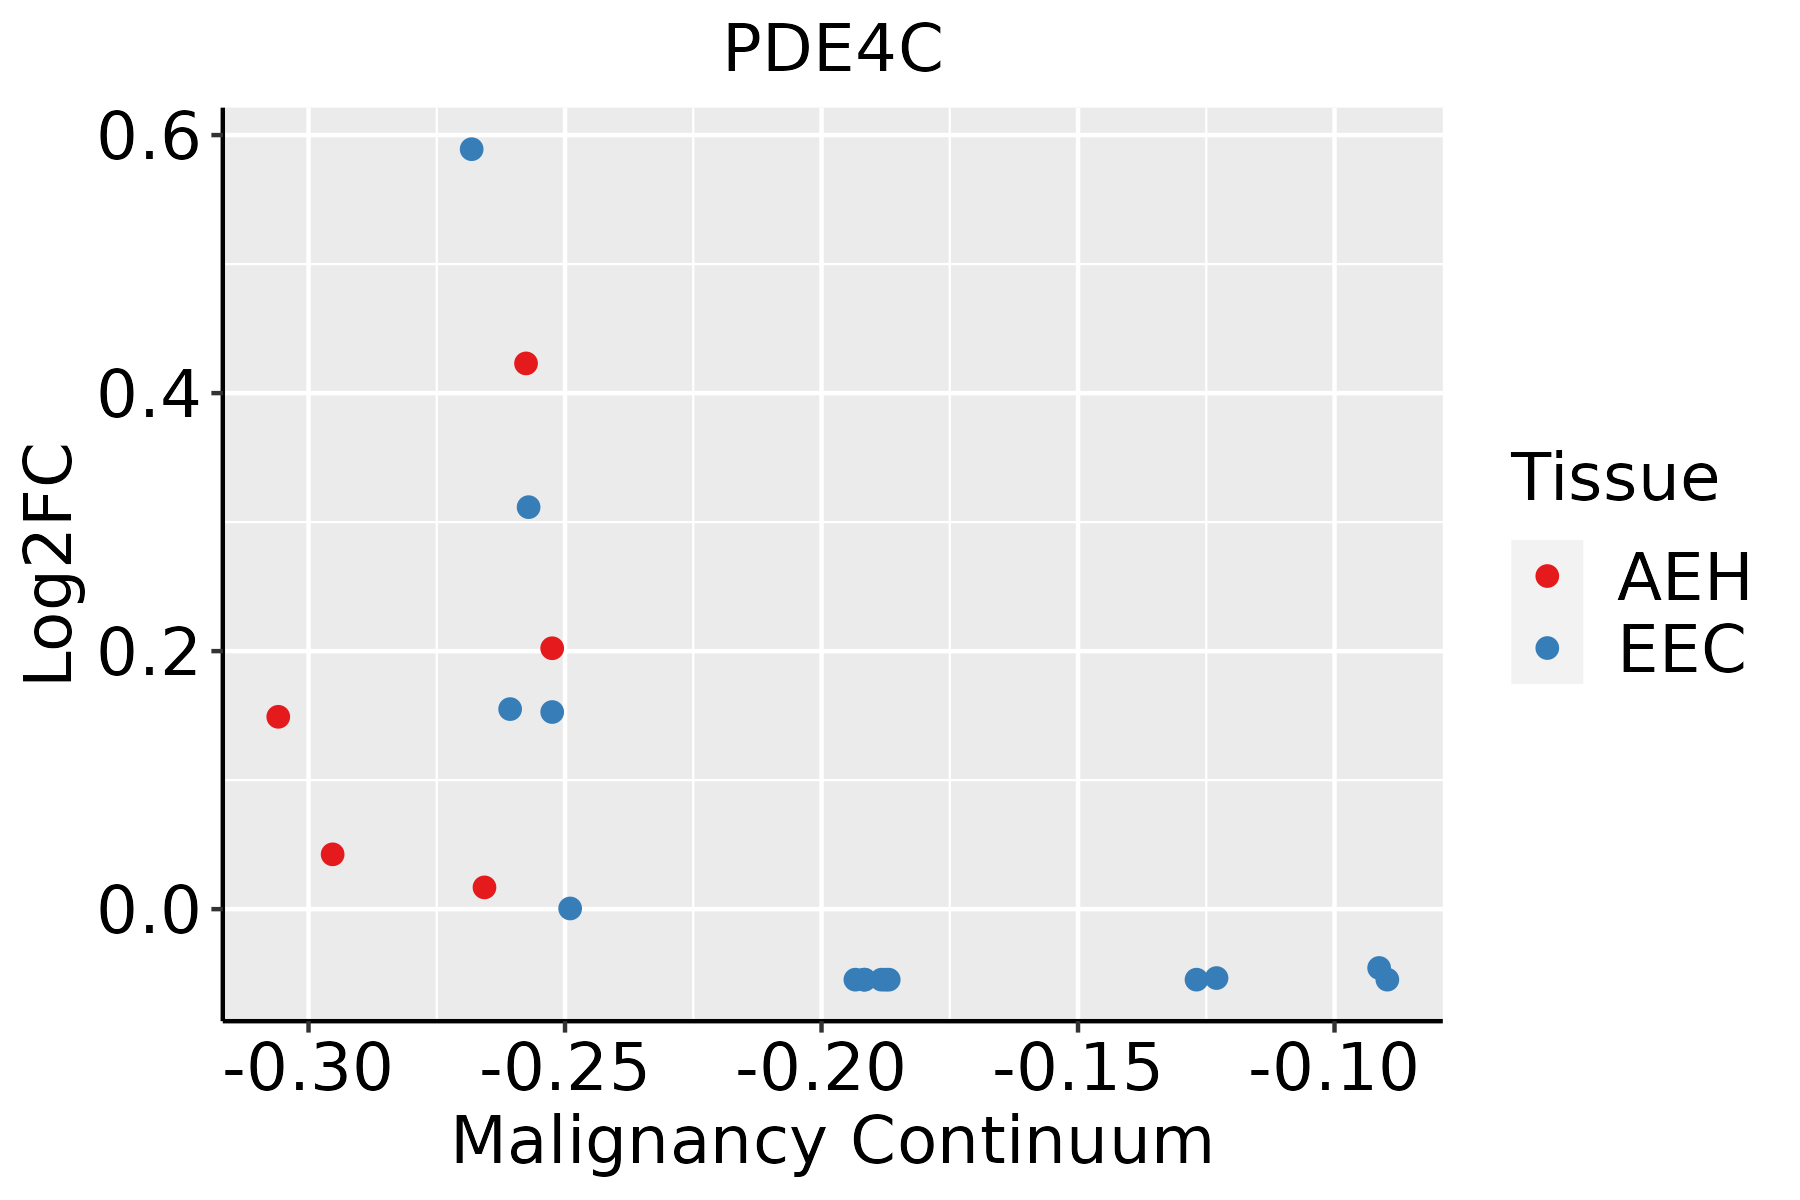
AEH: Atypical endometrial hyperplasia
EEC: Endometrioid Cancer
EsophagusThe image shows the transcriptomic changes along malignancy continuum.log2FC in expression of this searched gene in stem-like cells from each diseased tissue sample relative to stem-like cells in normal samples in each tissue plotted against the malignancy continuum. Samples are colored based on if they are from different disease stage.ESCC: Esophageal squamous cell carcinoma
HGIN: High-grade intraepithelial neoplasias
LGIN: Low-grade intraepithelial neoplasias
GCThe image shows the transcriptomic changes along malignancy continuum.log2FC in expression of this searched gene in stem-like cells from each diseased tissue sample relative to stem-like cells in normal samples in each tissue plotted against the malignancy continuum. Samples are colored based on if they are from different disease stage.
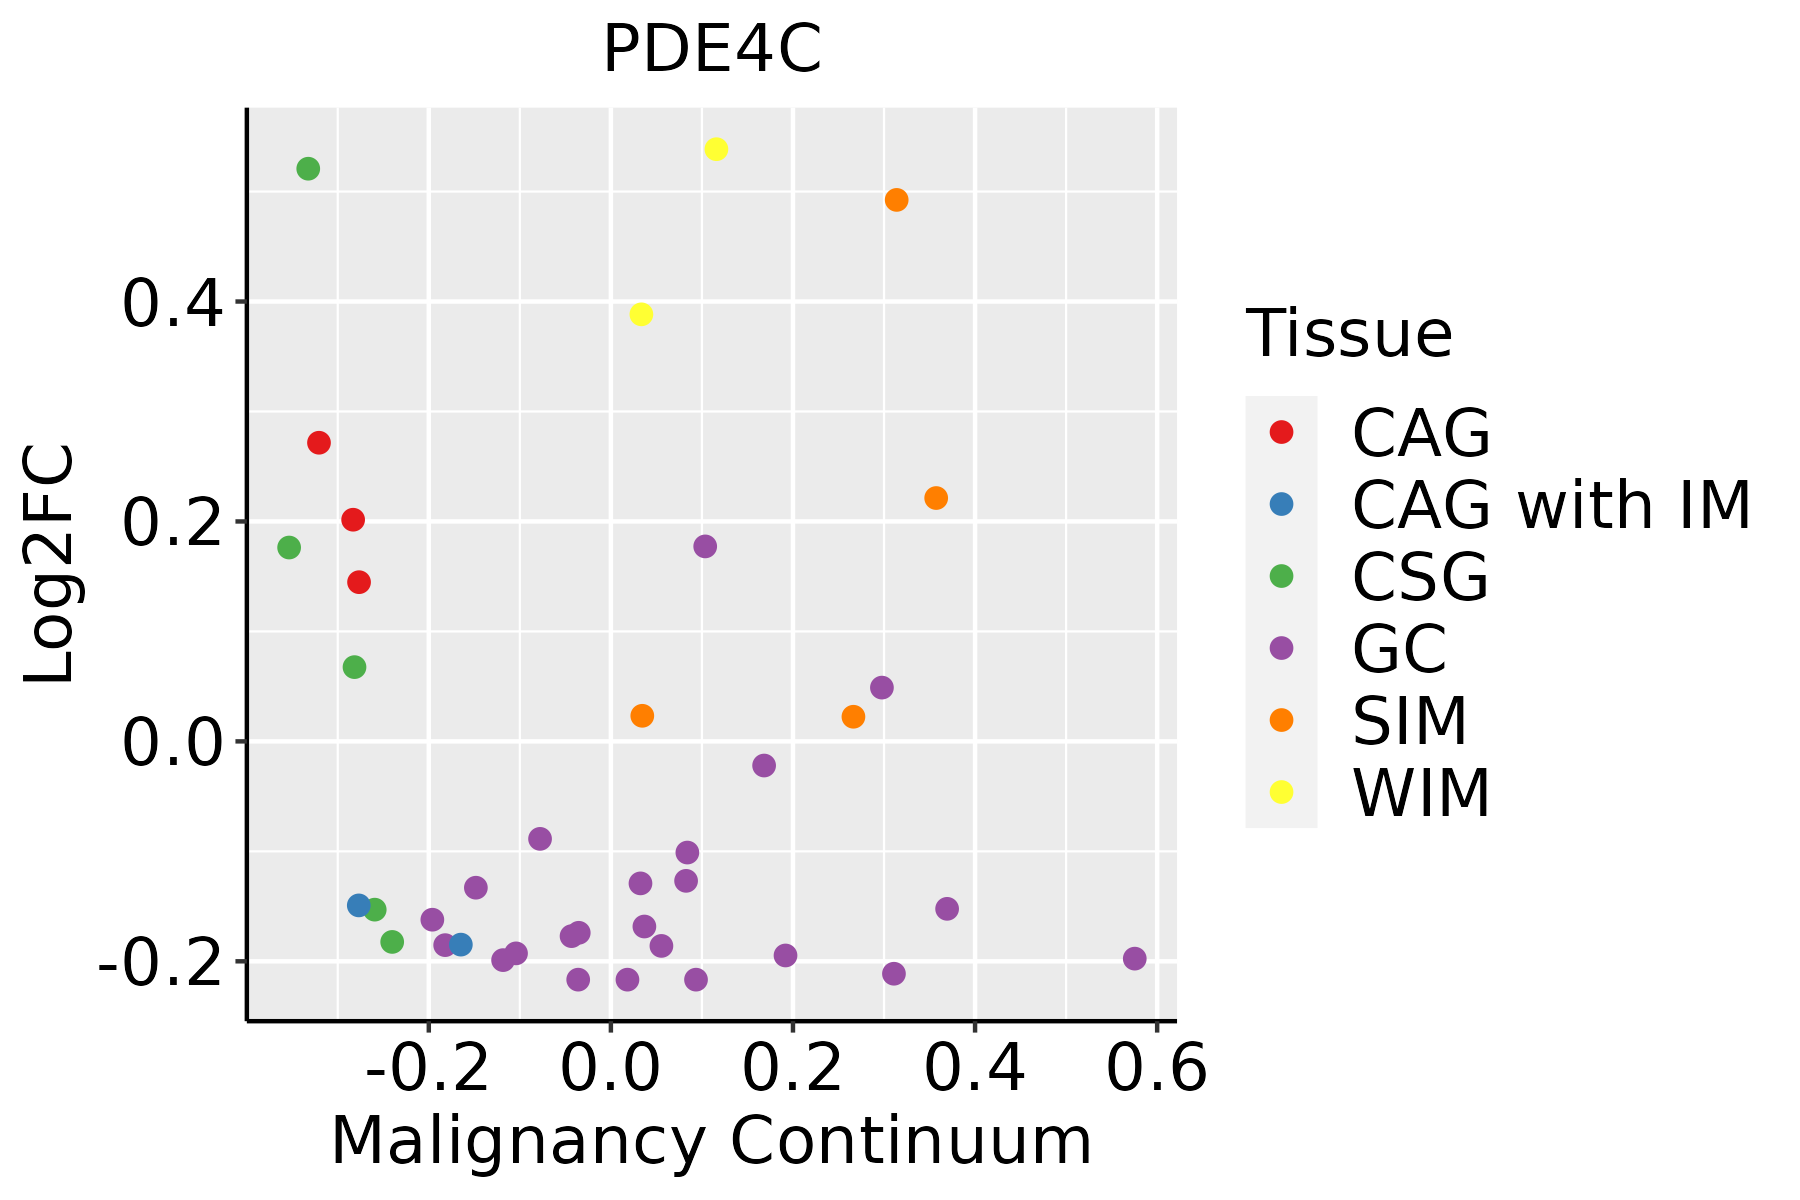
CAG: Chronic atrophic gastritis
CAG with IM: Chronic atrophic gastritis with intestinal metaplasia
CSG: Chronic superficial gastritis
GC: Gastric cancer
SIM: Severe intestinal metaplasia
WIM: Wild intestinal metaplasia
LiverThe image shows the transcriptomic changes along malignancy continuum.log2FC in expression of this searched gene in stem-like cells from each diseased tissue sample relative to stem-like cells in normal samples in each tissue plotted against the malignancy continuum. Samples are colored based on if they are from different disease stage.
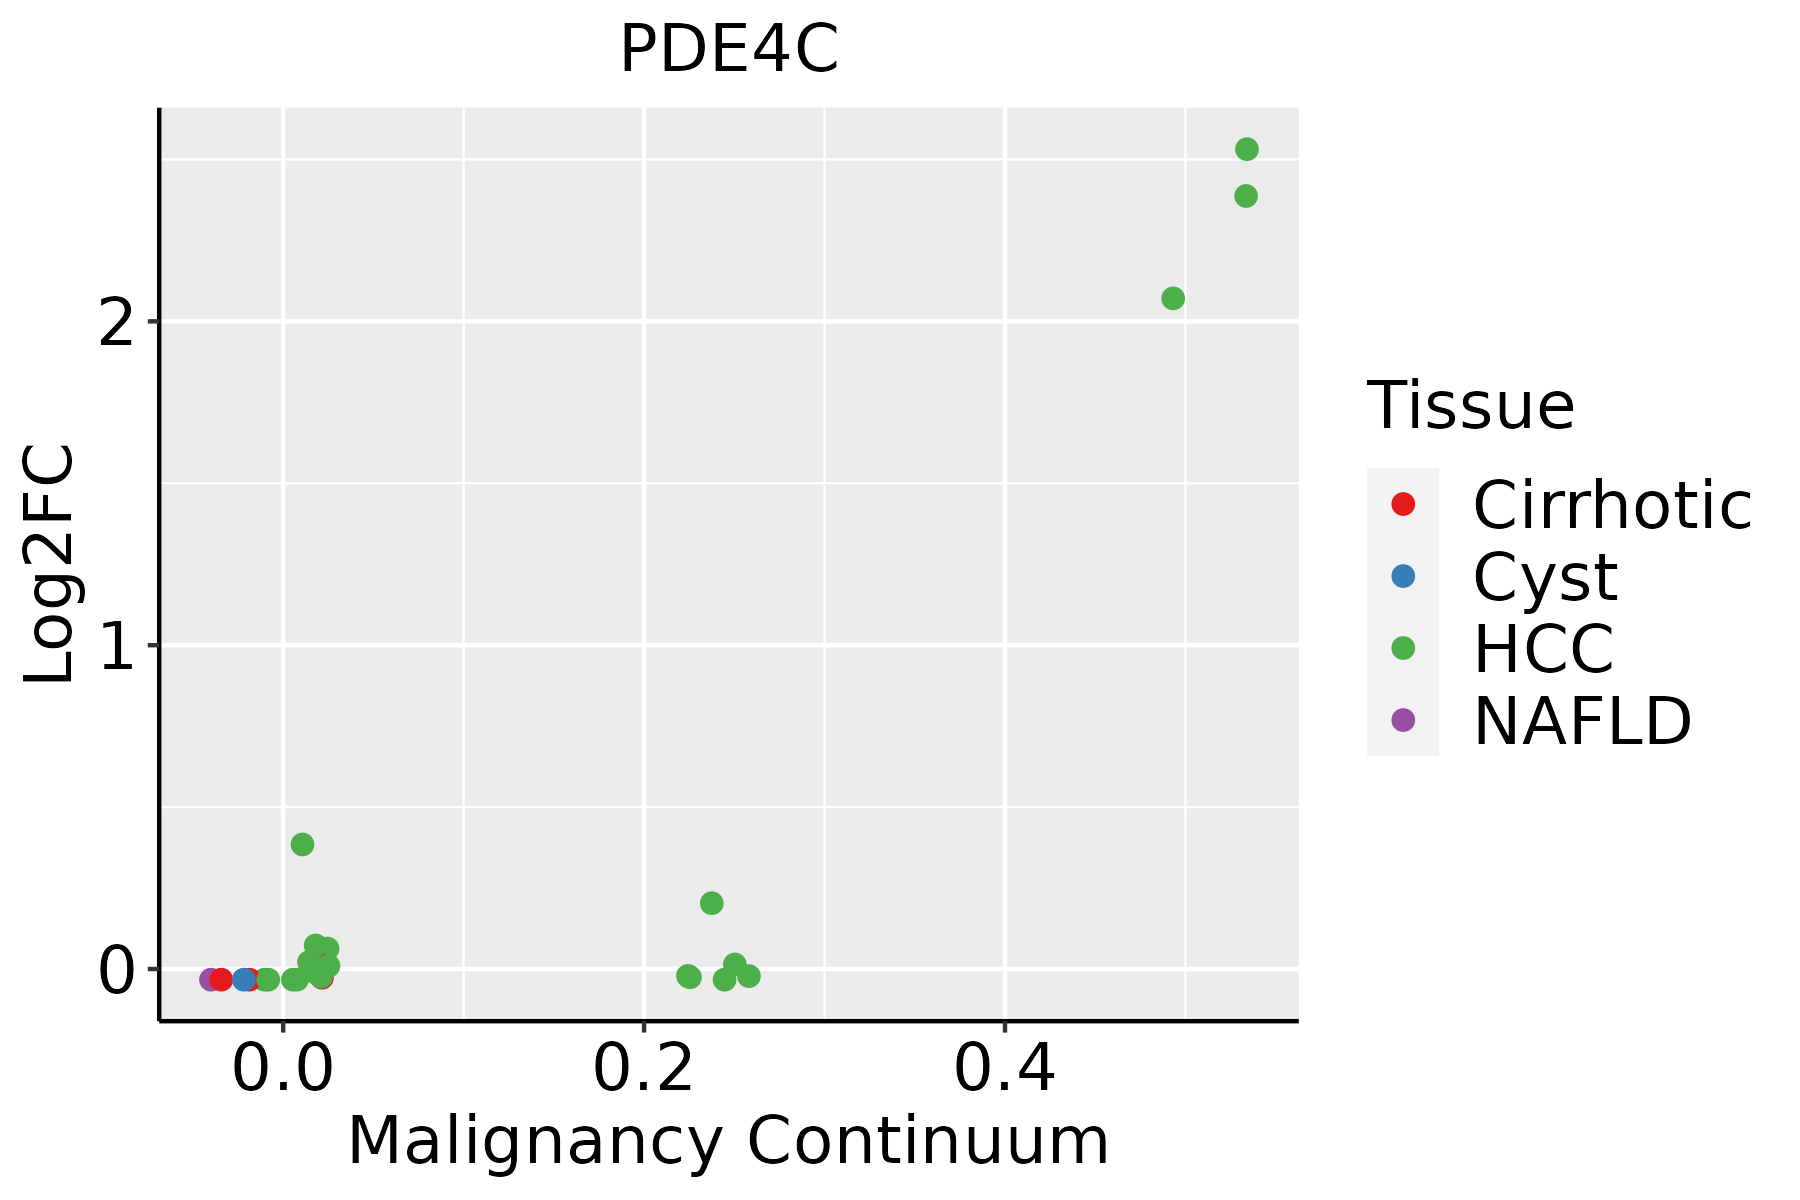
HCC: Hepatocellular carcinoma
NAFLD: Non-alcoholic fatty liver disease
∗log2FC in expression of this searched gene in stem-like cells from each diseased tissue sample relative to stem-like cells in normal samples in each tissue plotted against the malignancy continuum. Samples are colored based on if they are from different disease stage.

Top

Malignant transformation related pathway analysis

check buttonFind out the enriched GO biological processes and KEGG pathways involved in transition from healthy to precancer to cancer
check button Figure of enriched GO biological processes.
TissueDisease StageEnriched GO biological Processes
ColorectumADGO analysis - Figure of enriched GO biological processes: Top 15 enriched GO BP terms are showed in the bar plot of each disease state in each tissue. Each row represents a significant GO biological process which is colored according to the -log10(p.adjust).
ColorectumSERGO analysis - Figure of enriched GO biological processes: Top 15 enriched GO BP terms are showed in the bar plot of each disease state in each tissue. Each row represents a significant GO biological process which is colored according to the -log10(p.adjust).
ColorectumMSSGO analysis - Figure of enriched GO biological processes: Top 15 enriched GO BP terms are showed in the bar plot of each disease state in each tissue. Each row represents a significant GO biological process which is colored according to the -log10(p.adjust).
ColorectumMSI-HGO analysis - Figure of enriched GO biological processes: Top 15 enriched GO BP terms are showed in the bar plot of each disease state in each tissue. Each row represents a significant GO biological process which is colored according to the -log10(p.adjust).
ColorectumFAPGO analysis - Figure of enriched GO biological processes: Top 15 enriched GO BP terms are showed in the bar plot of each disease state in each tissue. Each row represents a significant GO biological process which is colored according to the -log10(p.adjust).
∗Top 15 enriched GO BP terms are showed in the bar plot of each disease state in each tissue. Each row represents a significant GO biological process which is colored according to the -log10(p.adjust).
Page: 1 2 3 4 5 6 7 8 9 

check button Enriched GO biological processes.
GO IDTissueDisease StageDescriptionGene RatioBg Ratiopvaluep.adjustCount
GO:0009150ColorectumADpurine ribonucleotide metabolic process142/3918368/187234.29e-151.17e-12142
GO:0006163ColorectumADpurine nucleotide metabolic process149/3918396/187231.08e-142.80e-12149
GO:0072521ColorectumADpurine-containing compound metabolic process153/3918416/187234.34e-141.01e-11153
GO:0009259ColorectumADribonucleotide metabolic process144/3918385/187235.25e-141.13e-11144
GO:0019693ColorectumADribose phosphate metabolic process145/3918396/187233.01e-135.71e-11145
GO:0009117ColorectumADnucleotide metabolic process168/3918489/187232.20e-123.36e-10168
GO:0006753ColorectumADnucleoside phosphate metabolic process169/3918497/187234.99e-126.98e-10169
GO:0044270ColorectumADcellular nitrogen compound catabolic process147/3918451/187233.35e-092.23e-07147
GO:0046700ColorectumADheterocycle catabolic process145/3918445/187234.37e-092.84e-07145
GO:0034655ColorectumADnucleobase-containing compound catabolic process133/3918407/187231.56e-089.12e-07133
GO:0019439ColorectumADaromatic compound catabolic process146/3918467/187237.48e-083.84e-06146
GO:1901361ColorectumADorganic cyclic compound catabolic process153/3918495/187238.23e-084.18e-06153
GO:0006195ColorectumADpurine nucleotide catabolic process18/391846/187233.67e-032.60e-0218
GO:0072523ColorectumADpurine-containing compound catabolic process19/391852/187236.92e-034.26e-0219
GO:00061631ColorectumSERpurine nucleotide metabolic process109/2897396/187234.26e-105.44e-08109
GO:00091501ColorectumSERpurine ribonucleotide metabolic process103/2897368/187234.69e-105.68e-08103
GO:00725211ColorectumSERpurine-containing compound metabolic process113/2897416/187234.80e-105.68e-08113
GO:00092591ColorectumSERribonucleotide metabolic process104/2897385/187233.27e-093.04e-07104
GO:00196931ColorectumSERribose phosphate metabolic process105/2897396/187238.15e-097.14e-07105
GO:00091171ColorectumSERnucleotide metabolic process122/2897489/187232.50e-081.76e-06122
Page: 1 2 3 4 5 6 

check button Enriched KEGG pathways.
Pathway IDTissueDisease StageDescriptionGene RatioBg Ratiopvaluep.adjustqvalueCount
hsa04928ColorectumADParathyroid hormone synthesis, secretion and action38/2092106/84656.60e-032.77e-021.76e-0238
hsa049281ColorectumADParathyroid hormone synthesis, secretion and action38/2092106/84656.60e-032.77e-021.76e-0238
hsa049282ColorectumSERParathyroid hormone synthesis, secretion and action31/1580106/84655.20e-033.28e-022.38e-0231
hsa049283ColorectumSERParathyroid hormone synthesis, secretion and action31/1580106/84655.20e-033.28e-022.38e-0231
hsa0492816EsophagusESCCParathyroid hormone synthesis, secretion and action66/4205106/84655.86e-031.47e-027.51e-0366
hsa0492817EsophagusESCCParathyroid hormone synthesis, secretion and action66/4205106/84655.86e-031.47e-027.51e-0366
Page: 1 

Top

Cell-cell communication analysis

check buttonIdentification of potential cell-cell interactions between two cell types and their ligand-receptor pairs for different disease states
LigandReceptorLRpairPathwayTissueDisease Stage
Page: 1 

Top

Single-cell gene regulatory network inference analysis

check buttonFind out the significant the regulons (TFs) and the target genes of each regulon across cell types for different disease states
TFCell TypeTissueDisease StageTarget GeneRSSRegulon Activity
∗The dot plots of a searched regulon are shown for all cell subpopulations in each disease state of each tissue based on the regulon specific score inferred using pySCENIC and by calculating the average expression.
Page: 1 

Top

Somatic mutation of malignant transformation related genes

check buttonAnnotation of somatic variants for genes involved in malignant transformation
Hugo SymbolVariant ClassVariant ClassificationdbSNP RSHGVScHGVSpHGVSp ShortSWISSPROTBIOTYPESIFTPolyPhenTumor Sample BarcodeTissueHistologySexAgeStageTherapy TypesDrugsOutcome
PDE4CSNVMissense_Mutationc.1294N>Ap.His432Asnp.H432NQ08493protein_codingdeleterious(0.01)probably_damaging(1)TCGA-A2-A0CX-01Breastbreast invasive carcinomaFemale<65I/IIChemotherapyadriamycinSD
PDE4CSNVMissense_Mutationnovelc.292N>Ap.Gln98Lysp.Q98KQ08493protein_codingdeleterious_low_confidence(0.01)benign(0.062)TCGA-A2-A0YK-01Breastbreast invasive carcinomaFemale<65I/IIChemotherapycytoxanSD
PDE4CSNVMissense_Mutationrs759324714c.1945N>Ap.Glu649Lysp.E649KQ08493protein_codingtolerated_low_confidence(0.09)benign(0)TCGA-A8-A09N-01Breastbreast invasive carcinomaFemale<65III/IVUnknownUnknownSD
PDE4CSNVMissense_Mutationc.418T>Ap.Ser140Thrp.S140TQ08493protein_codingdeleterious(0.01)possibly_damaging(0.5)TCGA-AQ-A04J-01Breastbreast invasive carcinomaFemale<65I/IIChemotherapycytoxanSD
PDE4CSNVMissense_Mutationnovelc.2002G>Cp.Glu668Glnp.E668QQ08493protein_codingtolerated_low_confidence(0.14)benign(0.007)TCGA-AR-A2LH-01Breastbreast invasive carcinomaFemale<65III/IVChemotherapyadriamycinPD
PDE4CSNVMissense_Mutationc.1780G>Cp.Glu594Glnp.E594QQ08493protein_codingdeleterious(0)probably_damaging(0.999)TCGA-B6-A0RE-01Breastbreast invasive carcinomaFemale<65I/IIUnknownUnknownSD
PDE4CSNVMissense_Mutationc.1682C>Tp.Thr561Metp.T561MQ08493protein_codingdeleterious(0)probably_damaging(1)TCGA-C8-A275-01Breastbreast invasive carcinomaFemale<65I/IIUnknownUnknownSD
PDE4CSNVMissense_Mutationrs771418461c.2132N>Ap.Arg711Lysp.R711KQ08493protein_codingdeleterious_low_confidence(0)benign(0.112)TCGA-S3-AA0Z-01Breastbreast invasive carcinomaFemale<65I/IIAncillaryneulastaCR
PDE4CinsertionNonsense_Mutationnovelc.1428_1429insAGCAGAGGGAACCCCACGTGAGGAGGCp.Ile476_Phe477insSerArgGlyAsnProThrTerGlyGlyp.I476_F477insSRGNPT*GGQ08493protein_codingTCGA-A2-A0D1-01Breastbreast invasive carcinomaFemale>=65I/IIChemotherapytaxotereSD
PDE4CinsertionIn_Frame_Insnovelc.1851_1852insTGCp.His617_Pro618insCysp.H617_P618insCQ08493protein_codingTCGA-A7-A0CJ-01Breastbreast invasive carcinomaFemale<65I/IIChemotherapycytoxanSD
Page: 1 2 3 4 5 6 7 8 

Top

Related drugs of malignant transformation related genes

check buttonIdentification of chemicals and drugs interact with genes involved in malignant transfromation
(DGIdb 4.0)
Entrez IDSymbolCategoryInteraction TypesDrug Claim NameDrug NamePMIDs
5143PDE4CDRUGGABLE GENOME, ENZYMEinhibitorCHEMBL1200434OXTRIPHYLLINE
5143PDE4CDRUGGABLE GENOME, ENZYMEinhibitor178101942
5143PDE4CDRUGGABLE GENOME, ENZYMEinhibitorCHEMBL1752DYPHYLLINE
5143PDE4CDRUGGABLE GENOME, ENZYMEinhibitorCHEMBL1096AMLEXANOX
5143PDE4CDRUGGABLE GENOME, ENZYMEinhibitor178103971IBUDILAST
5143PDE4CDRUGGABLE GENOME, ENZYMEinhibitor178103944APREMILAST
5143PDE4CDRUGGABLE GENOME, ENZYMEinhibitor363894172
5143PDE4CDRUGGABLE GENOME, ENZYMEinhibitorCHEMBL932DIPYRIDAMOLE
5143PDE4CDRUGGABLE GENOME, ENZYMEinhibitorCHEMBL193240ROFLUMILAST
5143PDE4CDRUGGABLE GENOME, ENZYMEinhibitor363894146
Page: 1 2 3