
|
|||||
|
 | |
| |
| |
| |
| |
| |
|
Gene: PDE4A |
Gene summary for PDE4A |
| Gene information | Species | Human | Gene symbol | PDE4A | Gene ID | 5141 |
| Gene name | phosphodiesterase 4A | |
| Gene Alias | DPDE2 | |
| Cytomap | 19p13.2 | |
| Gene Type | protein-coding | GO ID | GO:0003008 | UniProtAcc | P27815 |
Top |
Malignant transformation analysis |
| Identification of the aberrant gene expression in precancerous and cancerous lesions by comparing the gene expression of stem-like cells in diseased tissues with normal stem cells |
| Entrez ID | Symbol | Replicates | Species | Organ | Tissue | Adj P-value | Log2FC | Malignancy |
| 5141 | PDE4A | HTA11_3410_2000001011 | Human | Colorectum | AD | 1.16e-02 | 2.19e-01 | 0.0155 |
| 5141 | PDE4A | HTA11_347_2000001011 | Human | Colorectum | AD | 3.33e-06 | 3.25e-01 | -0.1954 |
| 5141 | PDE4A | HTA11_696_2000001011 | Human | Colorectum | AD | 3.22e-03 | 3.61e-01 | -0.1464 |
| 5141 | PDE4A | HTA11_866_2000001011 | Human | Colorectum | AD | 2.73e-15 | 5.55e-01 | -0.1001 |
| 5141 | PDE4A | HTA11_1391_2000001011 | Human | Colorectum | AD | 8.65e-03 | 3.31e-01 | -0.059 |
| 5141 | PDE4A | HTA11_546_2000001011 | Human | Colorectum | AD | 2.72e-03 | 4.59e-01 | -0.0842 |
| 5141 | PDE4A | HTA11_10623_2000001011 | Human | Colorectum | AD | 4.08e-02 | 5.33e-01 | -0.0177 |
| 5141 | PDE4A | HTA11_10711_2000001011 | Human | Colorectum | AD | 6.21e-10 | 6.90e-01 | 0.0338 |
| 5141 | PDE4A | HTA11_7696_3000711011 | Human | Colorectum | AD | 2.18e-23 | 7.78e-01 | 0.0674 |
| 5141 | PDE4A | male-WTA | Human | Thyroid | PTC | 3.40e-02 | 4.84e-02 | 0.1037 |
| 5141 | PDE4A | PTC01 | Human | Thyroid | PTC | 1.52e-02 | 2.96e-02 | 0.1899 |
| 5141 | PDE4A | PTC04 | Human | Thyroid | PTC | 5.96e-08 | 1.51e-01 | 0.1927 |
| 5141 | PDE4A | PTC05 | Human | Thyroid | PTC | 1.92e-03 | 1.68e-01 | 0.2065 |
| 5141 | PDE4A | PTC06 | Human | Thyroid | PTC | 1.05e-03 | 1.20e-01 | 0.2057 |
| 5141 | PDE4A | PTC07 | Human | Thyroid | PTC | 1.07e-13 | 2.09e-01 | 0.2044 |
| 5141 | PDE4A | ATC13 | Human | Thyroid | ATC | 7.41e-25 | 4.27e-01 | 0.34 |
| 5141 | PDE4A | ATC2 | Human | Thyroid | ATC | 1.08e-07 | 6.21e-01 | 0.34 |
| 5141 | PDE4A | ATC5 | Human | Thyroid | ATC | 1.46e-27 | 4.73e-01 | 0.34 |
| Page: 1 |
| Tissue | Expression Dynamics | Abbreviation |
| Colorectum (GSE201348) |  | FAP: Familial adenomatous polyposis |
| CRC: Colorectal cancer | ||
| Colorectum (HTA11) |  | AD: Adenomas |
| SER: Sessile serrated lesions | ||
| MSI-H: Microsatellite-high colorectal cancer | ||
| MSS: Microsatellite stable colorectal cancer | ||
| Thyroid | 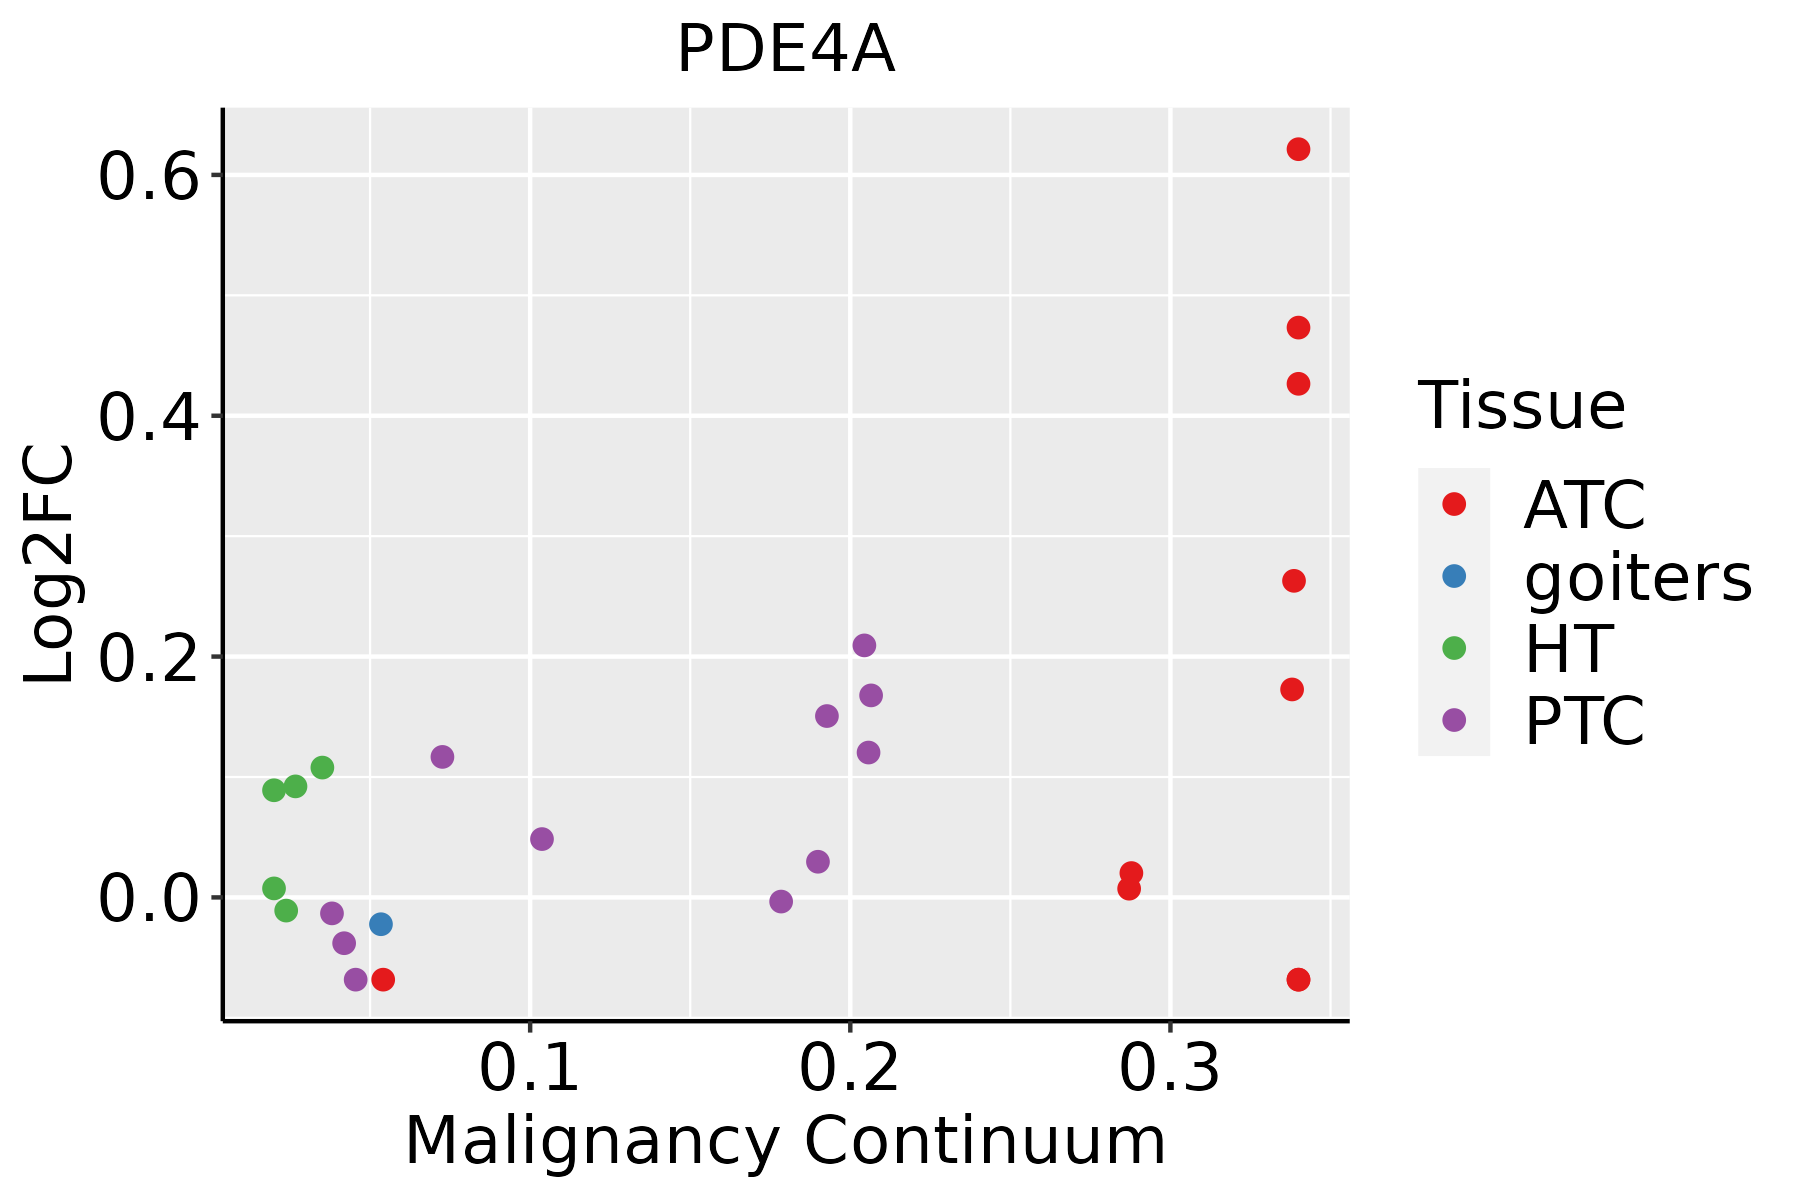 | ATC: Anaplastic thyroid cancer |
| HT: Hashimoto's thyroiditis | ||
| PTC: Papillary thyroid cancer |
| ∗log2FC in expression of this searched gene in stem-like cells from each diseased tissue sample relative to stem-like cells in normal samples in each tissue plotted against the malignancy continuum. Samples are colored based on if they are from different disease stage. |
Top |
Malignant transformation related pathway analysis |
| Find out the enriched GO biological processes and KEGG pathways involved in transition from healthy to precancer to cancer |
| Tissue | Disease Stage | Enriched GO biological Processes |
| Colorectum | AD |  |
| Colorectum | SER |  |
| Colorectum | MSS |  |
| Colorectum | MSI-H |  |
| Colorectum | FAP |  |
| ∗Top 15 enriched GO BP terms are showed in the bar plot of each disease state in each tissue. Each row represents a significant GO biological process which is colored according to the -log10(p.adjust). |
| Page: 1 2 3 4 5 6 7 8 9 |
| GO ID | Tissue | Disease Stage | Description | Gene Ratio | Bg Ratio | pvalue | p.adjust | Count |
| GO:0009150 | Colorectum | AD | purine ribonucleotide metabolic process | 142/3918 | 368/18723 | 4.29e-15 | 1.17e-12 | 142 |
| GO:0006163 | Colorectum | AD | purine nucleotide metabolic process | 149/3918 | 396/18723 | 1.08e-14 | 2.80e-12 | 149 |
| GO:0072521 | Colorectum | AD | purine-containing compound metabolic process | 153/3918 | 416/18723 | 4.34e-14 | 1.01e-11 | 153 |
| GO:0009259 | Colorectum | AD | ribonucleotide metabolic process | 144/3918 | 385/18723 | 5.25e-14 | 1.13e-11 | 144 |
| GO:0019693 | Colorectum | AD | ribose phosphate metabolic process | 145/3918 | 396/18723 | 3.01e-13 | 5.71e-11 | 145 |
| GO:0009117 | Colorectum | AD | nucleotide metabolic process | 168/3918 | 489/18723 | 2.20e-12 | 3.36e-10 | 168 |
| GO:0006753 | Colorectum | AD | nucleoside phosphate metabolic process | 169/3918 | 497/18723 | 4.99e-12 | 6.98e-10 | 169 |
| GO:0044270 | Colorectum | AD | cellular nitrogen compound catabolic process | 147/3918 | 451/18723 | 3.35e-09 | 2.23e-07 | 147 |
| GO:0046700 | Colorectum | AD | heterocycle catabolic process | 145/3918 | 445/18723 | 4.37e-09 | 2.84e-07 | 145 |
| GO:0034655 | Colorectum | AD | nucleobase-containing compound catabolic process | 133/3918 | 407/18723 | 1.56e-08 | 9.12e-07 | 133 |
| GO:0019439 | Colorectum | AD | aromatic compound catabolic process | 146/3918 | 467/18723 | 7.48e-08 | 3.84e-06 | 146 |
| GO:1901361 | Colorectum | AD | organic cyclic compound catabolic process | 153/3918 | 495/18723 | 8.23e-08 | 4.18e-06 | 153 |
| GO:0009410 | Colorectum | AD | response to xenobiotic stimulus | 128/3918 | 462/18723 | 2.69e-04 | 3.31e-03 | 128 |
| GO:0006195 | Colorectum | AD | purine nucleotide catabolic process | 18/3918 | 46/18723 | 3.67e-03 | 2.60e-02 | 18 |
| GO:0072523 | Colorectum | AD | purine-containing compound catabolic process | 19/3918 | 52/18723 | 6.92e-03 | 4.26e-02 | 19 |
| GO:0034655112 | Thyroid | PTC | nucleobase-containing compound catabolic process | 211/5968 | 407/18723 | 2.72e-17 | 2.52e-15 | 211 |
| GO:0046700111 | Thyroid | PTC | heterocycle catabolic process | 221/5968 | 445/18723 | 2.43e-15 | 1.72e-13 | 221 |
| GO:0044270111 | Thyroid | PTC | cellular nitrogen compound catabolic process | 223/5968 | 451/18723 | 3.34e-15 | 2.31e-13 | 223 |
| GO:0019439111 | Thyroid | PTC | aromatic compound catabolic process | 225/5968 | 467/18723 | 8.51e-14 | 4.71e-12 | 225 |
| GO:1901361111 | Thyroid | PTC | organic cyclic compound catabolic process | 231/5968 | 495/18723 | 2.55e-12 | 1.12e-10 | 231 |
| Page: 1 2 3 |
| Pathway ID | Tissue | Disease Stage | Description | Gene Ratio | Bg Ratio | pvalue | p.adjust | qvalue | Count |
| hsa04928 | Colorectum | AD | Parathyroid hormone synthesis, secretion and action | 38/2092 | 106/8465 | 6.60e-03 | 2.77e-02 | 1.76e-02 | 38 |
| hsa049281 | Colorectum | AD | Parathyroid hormone synthesis, secretion and action | 38/2092 | 106/8465 | 6.60e-03 | 2.77e-02 | 1.76e-02 | 38 |
| Page: 1 |
Top |
Cell-cell communication analysis |
| Identification of potential cell-cell interactions between two cell types and their ligand-receptor pairs for different disease states |
| Ligand | Receptor | LRpair | Pathway | Tissue | Disease Stage |
| Page: 1 |
Top |
Single-cell gene regulatory network inference analysis |
| Find out the significant the regulons (TFs) and the target genes of each regulon across cell types for different disease states |
| TF | Cell Type | Tissue | Disease Stage | Target Gene | RSS | Regulon Activity |
| ∗The dot plots of a searched regulon are shown for all cell subpopulations in each disease state of each tissue based on the regulon specific score inferred using pySCENIC and by calculating the average expression. |
| Page: 1 |
Top |
Somatic mutation of malignant transformation related genes |
| Annotation of somatic variants for genes involved in malignant transformation |
| Hugo Symbol | Variant Class | Variant Classification | dbSNP RS | HGVSc | HGVSp | HGVSp Short | SWISSPROT | BIOTYPE | SIFT | PolyPhen | Tumor Sample Barcode | Tissue | Histology | Sex | Age | Stage | Therapy Types | Drugs | Outcome |
| PDE4A | SNV | Missense_Mutation | c.1614N>G | p.Ile538Met | p.I538M | P27815 | protein_coding | deleterious(0) | probably_damaging(1) | TCGA-5L-AAT1-01 | Breast | breast invasive carcinoma | Female | <65 | III/IV | Hormone Therapy | letrozol | SD | |
| PDE4A | SNV | Missense_Mutation | rs199842964 | c.415N>C | p.Thr139Pro | p.T139P | P27815 | protein_coding | tolerated_low_confidence(0.2) | benign(0) | TCGA-A1-A0SH-01 | Breast | breast invasive carcinoma | Female | <65 | I/II | Chemotherapy | tc | SD |
| PDE4A | SNV | Missense_Mutation | rs199842964 | c.415N>C | p.Thr139Pro | p.T139P | P27815 | protein_coding | tolerated_low_confidence(0.2) | benign(0) | TCGA-A2-A0T2-01 | Breast | breast invasive carcinoma | Female | >=65 | III/IV | Chemotherapy | xeloda | PD |
| PDE4A | SNV | Missense_Mutation | rs199842964 | c.415N>C | p.Thr139Pro | p.T139P | P27815 | protein_coding | tolerated_low_confidence(0.2) | benign(0) | TCGA-BH-A0H7-01 | Breast | breast invasive carcinoma | Female | >=65 | III/IV | Chemotherapy | doxorubicin | SD |
| PDE4A | SNV | Missense_Mutation | rs199842964 | c.415A>C | p.Thr139Pro | p.T139P | P27815 | protein_coding | tolerated_low_confidence(0.2) | benign(0) | TCGA-C8-A12K-01 | Breast | breast invasive carcinoma | Female | >=65 | I/II | Unknown | Unknown | SD |
| PDE4A | SNV | Missense_Mutation | c.1230N>G | p.Ile410Met | p.I410M | P27815 | protein_coding | deleterious(0) | possibly_damaging(0.848) | TCGA-E2-A1B6-01 | Breast | breast invasive carcinoma | Female | <65 | I/II | Unspecific | Adriamycin | SD | |
| PDE4A | insertion | Frame_Shift_Ins | novel | c.1789_1790insTTAC | p.Lys597IlefsTer23 | p.K597Ifs*23 | P27815 | protein_coding | TCGA-AO-A0JB-01 | Breast | breast invasive carcinoma | Female | <65 | III/IV | Chemotherapy | cyclophosphamide | SD | ||
| PDE4A | insertion | Nonsense_Mutation | novel | c.1791_1792insGCATGTGCCACCGTGCCTGGCTAATTTTTTTGTAT | p.Pro598AlafsTer8 | p.P598Afs*8 | P27815 | protein_coding | TCGA-AO-A0JB-01 | Breast | breast invasive carcinoma | Female | <65 | III/IV | Chemotherapy | cyclophosphamide | SD | ||
| PDE4A | SNV | Missense_Mutation | c.1495N>A | p.Glu499Lys | p.E499K | P27815 | protein_coding | deleterious(0.04) | possibly_damaging(0.457) | TCGA-C5-A1BK-01 | Cervix | cervical & endocervical cancer | Female | <65 | I/II | Unknown | Unknown | SD | |
| PDE4A | SNV | Missense_Mutation | c.463N>A | p.Asp155Asn | p.D155N | P27815 | protein_coding | deleterious_low_confidence(0.04) | benign(0.273) | TCGA-EK-A2PG-01 | Cervix | cervical & endocervical cancer | Female | >=65 | I/II | Unknown | Unknown | SD |
| Page: 1 2 3 4 5 6 7 8 |
Top |
Related drugs of malignant transformation related genes |
| Identification of chemicals and drugs interact with genes involved in malignant transfromation |
| (DGIdb 4.0) |
| Entrez ID | Symbol | Category | Interaction Types | Drug Claim Name | Drug Name | PMIDs |
| 5141 | PDE4A | DRUGGABLE GENOME, ENZYME | ENPROFYLLINE | ENPROFYLLINE | ||
| 5141 | PDE4A | DRUGGABLE GENOME, ENZYME | AVE-8112 | 24343458 | ||
| 5141 | PDE4A | DRUGGABLE GENOME, ENZYME | inhibitor | CHEMBL1370561 | AMINOPHYLLINE | |
| 5141 | PDE4A | DRUGGABLE GENOME, ENZYME | Enprofylline | ENPROFYLLINE | ||
| 5141 | PDE4A | DRUGGABLE GENOME, ENZYME | AN-2898 | |||
| 5141 | PDE4A | DRUGGABLE GENOME, ENZYME | MM36 topical ointment | |||
| 5141 | PDE4A | DRUGGABLE GENOME, ENZYME | RONOMILAST | |||
| 5141 | PDE4A | DRUGGABLE GENOME, ENZYME | OX914 | |||
| 5141 | PDE4A | DRUGGABLE GENOME, ENZYME | THEOPHYLLINE | THEOPHYLLINE | ||
| 5141 | PDE4A | DRUGGABLE GENOME, ENZYME | DYPHYLLINE | DYPHYLLINE |
| Page: 1 2 3 4 5 6 7 8 9 |

Copyright 2023-Present -The University of Texas Health Science Center at Houston |