
|
|||||
|
 | |
| |
| |
| |
| |
| |
|
Gene: PDE3B |
Gene summary for PDE3B |
| Gene information | Species | Human | Gene symbol | PDE3B | Gene ID | 5140 |
| Gene name | phosphodiesterase 3B | |
| Gene Alias | HcGIP1 | |
| Cytomap | 11p15.2 | |
| Gene Type | protein-coding | GO ID | GO:0001525 | UniProtAcc | A7E2E5 |
Top |
Malignant transformation analysis |
| Identification of the aberrant gene expression in precancerous and cancerous lesions by comparing the gene expression of stem-like cells in diseased tissues with normal stem cells |
| Entrez ID | Symbol | Replicates | Species | Organ | Tissue | Adj P-value | Log2FC | Malignancy |
| 5140 | PDE3B | HTA11_3410_2000001011 | Human | Colorectum | AD | 7.43e-26 | -5.93e-01 | 0.0155 |
| 5140 | PDE3B | HTA11_2487_2000001011 | Human | Colorectum | SER | 2.50e-04 | -4.80e-01 | -0.1808 |
| 5140 | PDE3B | HTA11_3361_2000001011 | Human | Colorectum | AD | 2.85e-02 | -4.29e-01 | -0.1207 |
| 5140 | PDE3B | HTA11_696_2000001011 | Human | Colorectum | AD | 1.24e-02 | -3.86e-01 | -0.1464 |
| 5140 | PDE3B | HTA11_1391_2000001011 | Human | Colorectum | AD | 4.85e-03 | -3.78e-01 | -0.059 |
| 5140 | PDE3B | HTA11_866_3004761011 | Human | Colorectum | AD | 5.40e-08 | -4.68e-01 | 0.096 |
| 5140 | PDE3B | HTA11_4255_2000001011 | Human | Colorectum | SER | 1.65e-02 | -6.90e-01 | 0.0446 |
| 5140 | PDE3B | HTA11_9408_2000001011 | Human | Colorectum | AD | 1.14e-02 | -7.90e-01 | 0.0451 |
| 5140 | PDE3B | HTA11_8622_2000001021 | Human | Colorectum | SER | 1.79e-03 | -4.73e-01 | 0.0528 |
| 5140 | PDE3B | HTA11_7696_3000711011 | Human | Colorectum | AD | 1.98e-07 | -4.18e-01 | 0.0674 |
| 5140 | PDE3B | HTA11_99999970781_79442 | Human | Colorectum | MSS | 1.87e-23 | -6.64e-01 | 0.294 |
| 5140 | PDE3B | HTA11_99999965104_69814 | Human | Colorectum | MSS | 2.63e-06 | -3.57e-01 | 0.281 |
| 5140 | PDE3B | HTA11_99999971662_82457 | Human | Colorectum | MSS | 4.73e-15 | -5.80e-01 | 0.3859 |
| 5140 | PDE3B | HTA11_99999973899_84307 | Human | Colorectum | MSS | 4.91e-05 | -5.90e-01 | 0.2585 |
| 5140 | PDE3B | HTA11_99999974143_84620 | Human | Colorectum | MSS | 1.05e-26 | -7.38e-01 | 0.3005 |
| 5140 | PDE3B | A001-C-207 | Human | Colorectum | FAP | 2.83e-03 | 1.29e-01 | 0.1278 |
| 5140 | PDE3B | A015-C-203 | Human | Colorectum | FAP | 1.08e-21 | -3.98e-03 | -0.1294 |
| 5140 | PDE3B | A015-C-204 | Human | Colorectum | FAP | 5.42e-05 | 1.55e-01 | -0.0228 |
| 5140 | PDE3B | A014-C-040 | Human | Colorectum | FAP | 8.52e-03 | 8.75e-02 | -0.1184 |
| 5140 | PDE3B | A002-C-201 | Human | Colorectum | FAP | 8.71e-10 | -2.87e-03 | 0.0324 |
| Page: 1 2 3 |
| Tissue | Expression Dynamics | Abbreviation |
| Colorectum (GSE201348) |  | FAP: Familial adenomatous polyposis |
| CRC: Colorectal cancer | ||
| Colorectum (HTA11) | 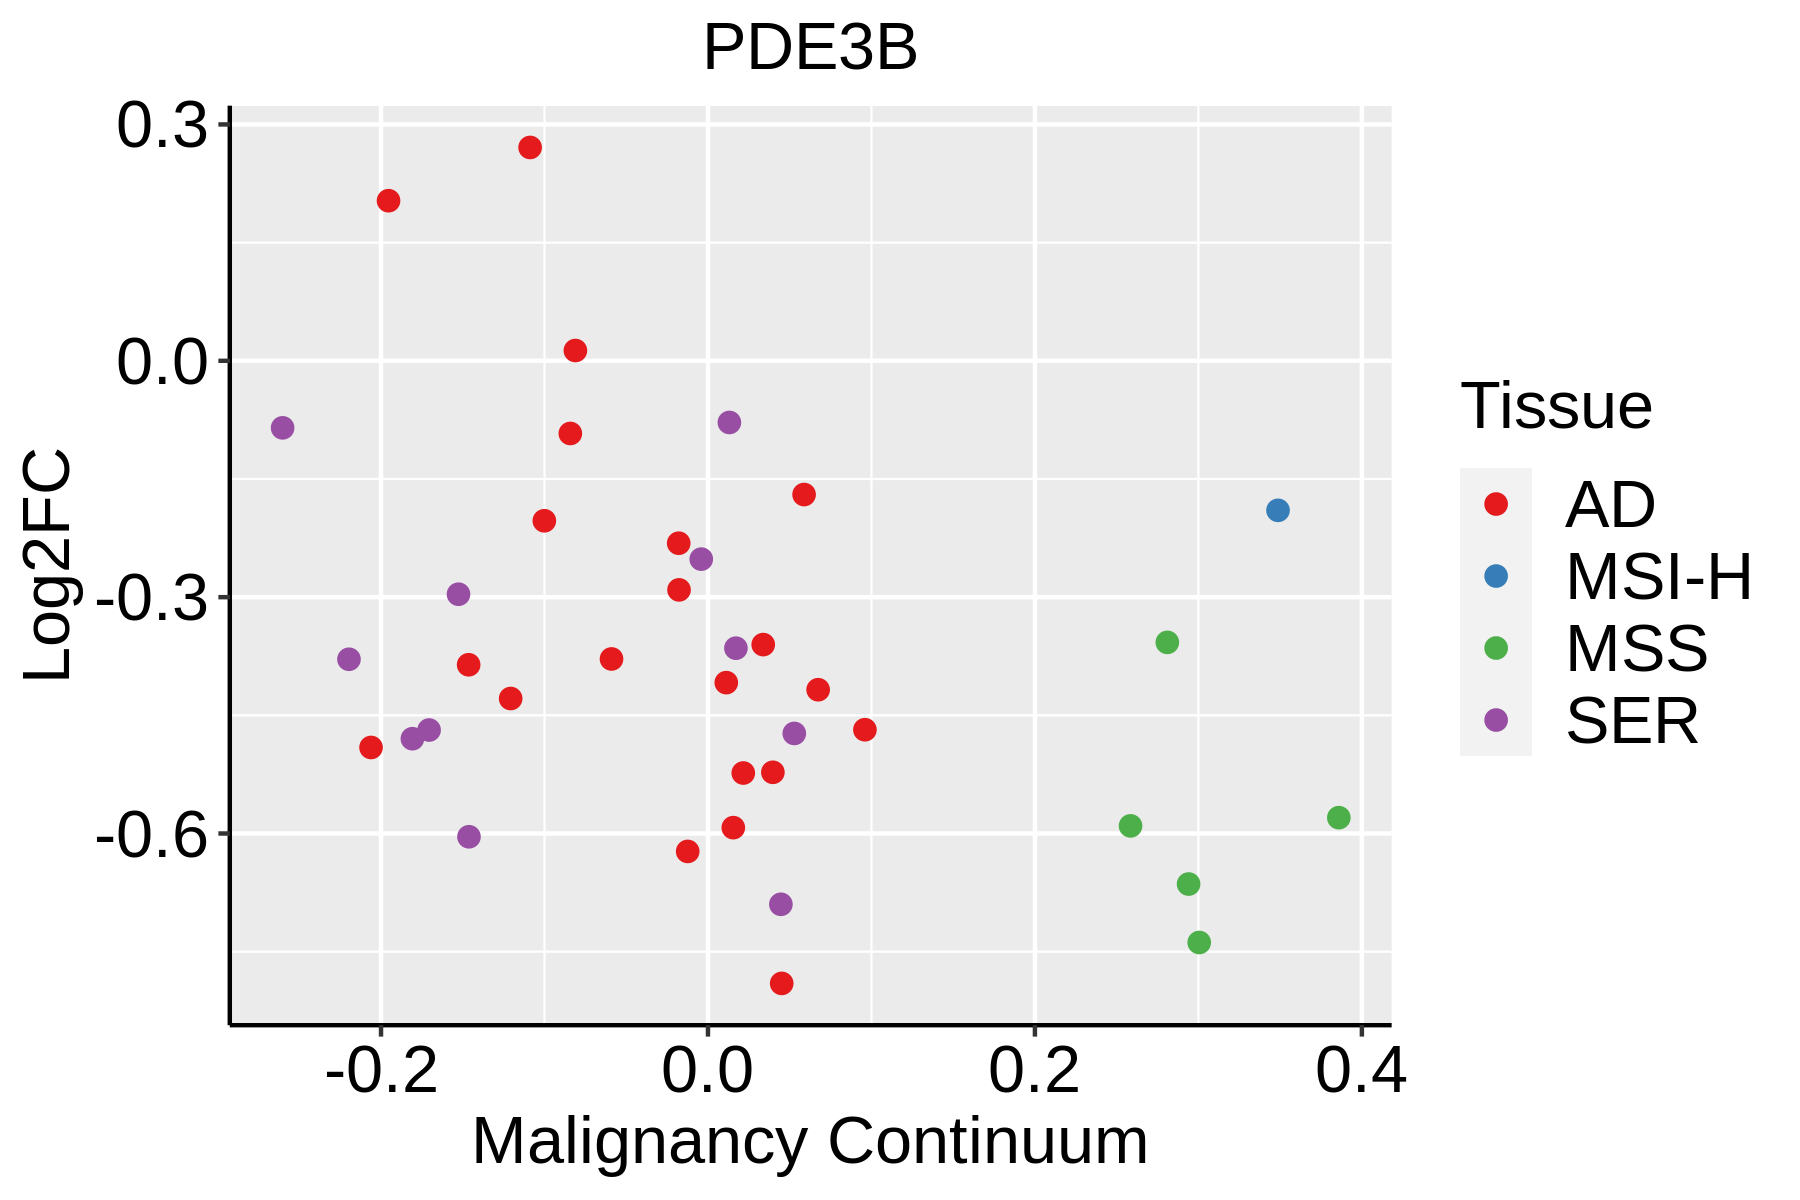 | AD: Adenomas |
| SER: Sessile serrated lesions | ||
| MSI-H: Microsatellite-high colorectal cancer | ||
| MSS: Microsatellite stable colorectal cancer | ||
| Liver | 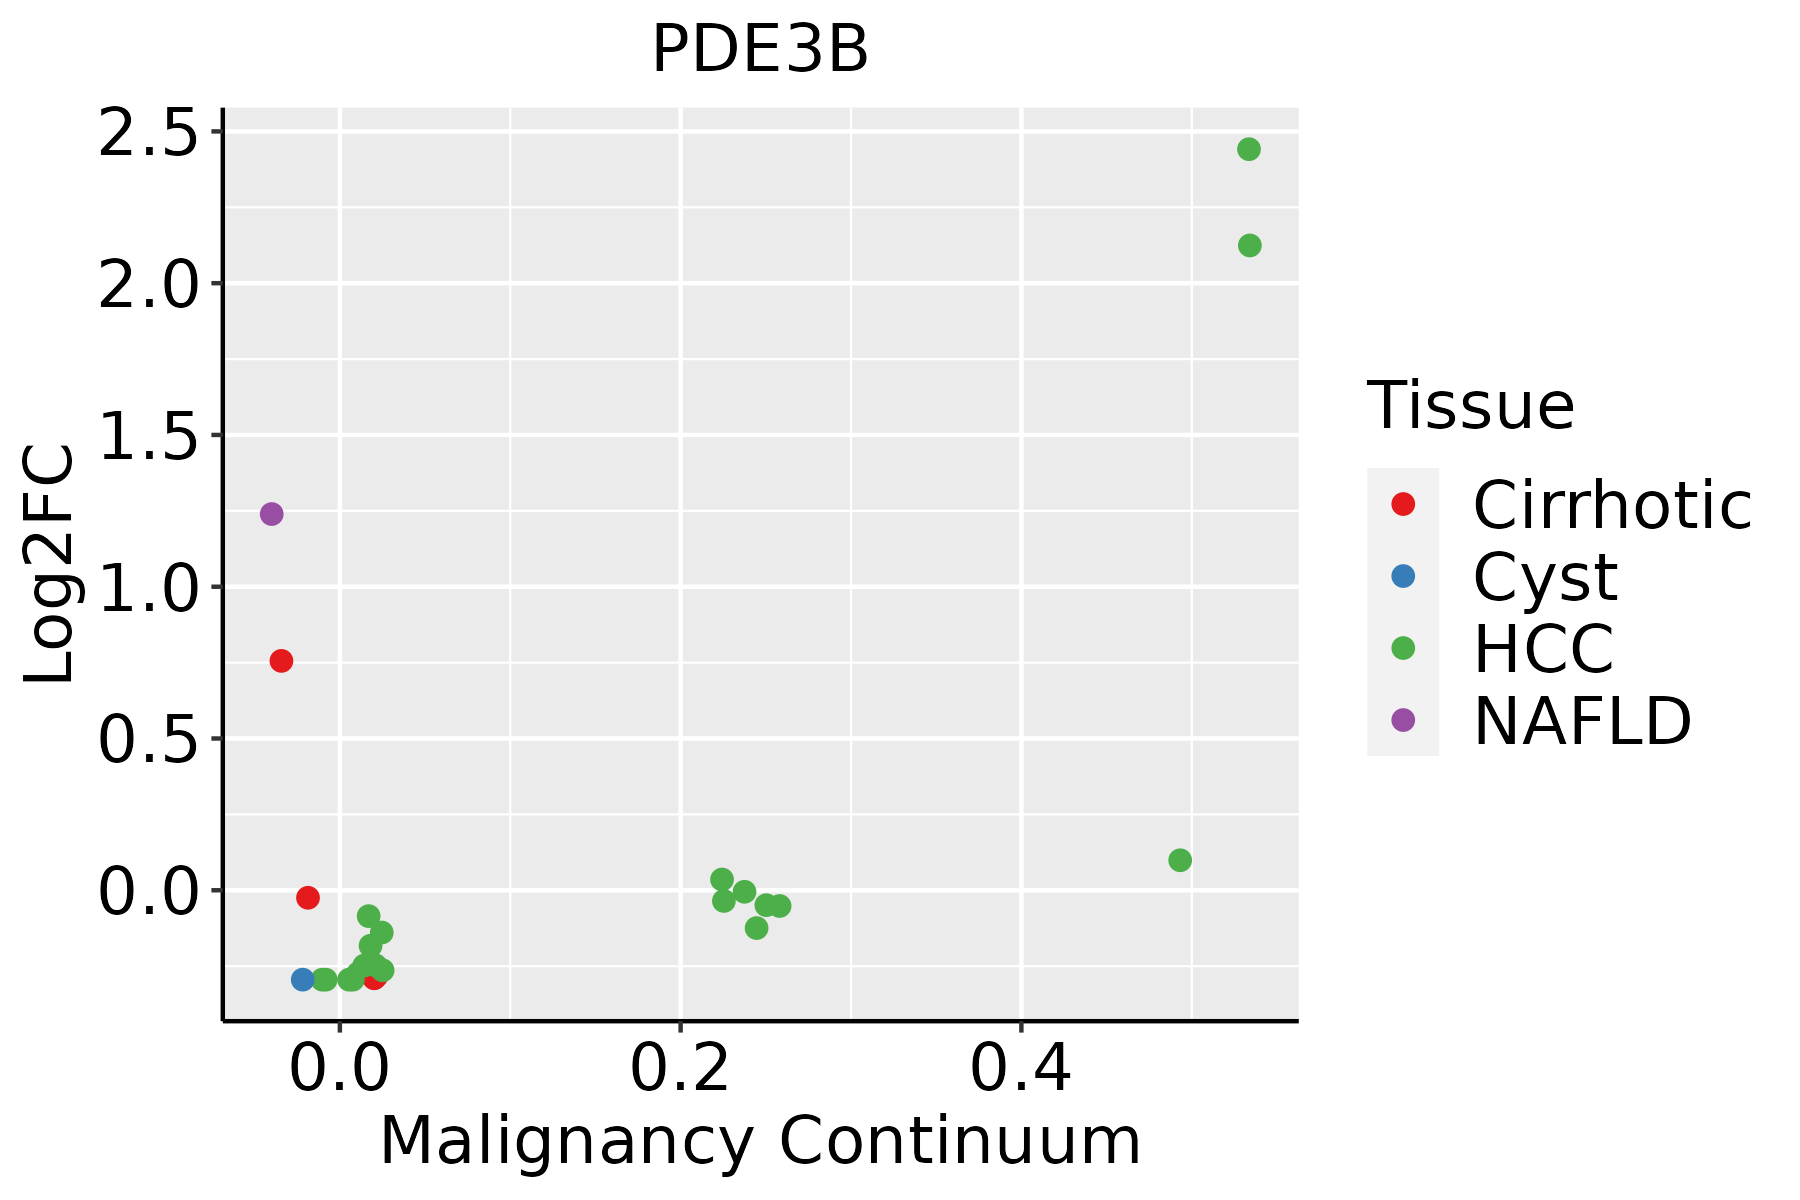 | HCC: Hepatocellular carcinoma |
| NAFLD: Non-alcoholic fatty liver disease |
| ∗log2FC in expression of this searched gene in stem-like cells from each diseased tissue sample relative to stem-like cells in normal samples in each tissue plotted against the malignancy continuum. Samples are colored based on if they are from different disease stage. |
Top |
Malignant transformation related pathway analysis |
| Find out the enriched GO biological processes and KEGG pathways involved in transition from healthy to precancer to cancer |
| Tissue | Disease Stage | Enriched GO biological Processes |
| Colorectum | AD |  |
| Colorectum | SER |  |
| Colorectum | MSS |  |
| Colorectum | MSI-H |  |
| Colorectum | FAP |  |
| ∗Top 15 enriched GO BP terms are showed in the bar plot of each disease state in each tissue. Each row represents a significant GO biological process which is colored according to the -log10(p.adjust). |
| Page: 1 2 3 4 5 6 7 8 9 |
| GO ID | Tissue | Disease Stage | Description | Gene Ratio | Bg Ratio | pvalue | p.adjust | Count |
| GO:0009895 | Colorectum | AD | negative regulation of catabolic process | 124/3918 | 320/18723 | 1.66e-13 | 3.35e-11 | 124 |
| GO:0032868 | Colorectum | AD | response to insulin | 91/3918 | 264/18723 | 2.02e-07 | 8.48e-06 | 91 |
| GO:1901653 | Colorectum | AD | cellular response to peptide | 114/3918 | 359/18723 | 8.32e-07 | 2.88e-05 | 114 |
| GO:0032869 | Colorectum | AD | cellular response to insulin stimulus | 72/3918 | 203/18723 | 1.10e-06 | 3.68e-05 | 72 |
| GO:0071375 | Colorectum | AD | cellular response to peptide hormone stimulus | 95/3918 | 290/18723 | 1.50e-06 | 4.66e-05 | 95 |
| GO:0043434 | Colorectum | AD | response to peptide hormone | 126/3918 | 414/18723 | 2.70e-06 | 7.86e-05 | 126 |
| GO:0016042 | Colorectum | AD | lipid catabolic process | 97/3918 | 320/18723 | 4.31e-05 | 7.56e-04 | 97 |
| GO:00098951 | Colorectum | SER | negative regulation of catabolic process | 84/2897 | 320/18723 | 3.93e-07 | 2.06e-05 | 84 |
| GO:00160421 | Colorectum | SER | lipid catabolic process | 77/2897 | 320/18723 | 3.52e-05 | 9.18e-04 | 77 |
| GO:00328681 | Colorectum | SER | response to insulin | 65/2897 | 264/18723 | 6.70e-05 | 1.53e-03 | 65 |
| GO:19016531 | Colorectum | SER | cellular response to peptide | 83/2897 | 359/18723 | 8.03e-05 | 1.77e-03 | 83 |
| GO:00434341 | Colorectum | SER | response to peptide hormone | 93/2897 | 414/18723 | 9.61e-05 | 2.04e-03 | 93 |
| GO:00713751 | Colorectum | SER | cellular response to peptide hormone stimulus | 68/2897 | 290/18723 | 2.20e-04 | 3.89e-03 | 68 |
| GO:00328691 | Colorectum | SER | cellular response to insulin stimulus | 51/2897 | 203/18723 | 2.30e-04 | 3.96e-03 | 51 |
| GO:0007162 | Colorectum | SER | negative regulation of cell adhesion | 68/2897 | 303/18723 | 8.02e-04 | 1.01e-02 | 68 |
| GO:00098952 | Colorectum | MSS | negative regulation of catabolic process | 110/3467 | 320/18723 | 7.88e-12 | 1.20e-09 | 110 |
| GO:00434342 | Colorectum | MSS | response to peptide hormone | 104/3467 | 414/18723 | 4.58e-04 | 5.43e-03 | 104 |
| GO:19016532 | Colorectum | MSS | cellular response to peptide | 91/3467 | 359/18723 | 7.38e-04 | 7.88e-03 | 91 |
| GO:00328692 | Colorectum | MSS | cellular response to insulin stimulus | 56/3467 | 203/18723 | 9.41e-04 | 9.50e-03 | 56 |
| GO:00713752 | Colorectum | MSS | cellular response to peptide hormone stimulus | 75/3467 | 290/18723 | 1.14e-03 | 1.12e-02 | 75 |
| Page: 1 2 3 4 |
| Pathway ID | Tissue | Disease Stage | Description | Gene Ratio | Bg Ratio | pvalue | p.adjust | qvalue | Count |
| hsa04922 | Colorectum | AD | Glucagon signaling pathway | 41/2092 | 107/8465 | 1.18e-03 | 7.75e-03 | 4.94e-03 | 41 |
| hsa049221 | Colorectum | AD | Glucagon signaling pathway | 41/2092 | 107/8465 | 1.18e-03 | 7.75e-03 | 4.94e-03 | 41 |
| hsa049222 | Colorectum | SER | Glucagon signaling pathway | 38/1580 | 107/8465 | 2.57e-05 | 3.28e-04 | 2.38e-04 | 38 |
| hsa049223 | Colorectum | SER | Glucagon signaling pathway | 38/1580 | 107/8465 | 2.57e-05 | 3.28e-04 | 2.38e-04 | 38 |
| hsa049224 | Colorectum | MSS | Glucagon signaling pathway | 39/1875 | 107/8465 | 5.00e-04 | 3.45e-03 | 2.11e-03 | 39 |
| hsa04022 | Colorectum | MSS | cGMP-PKG signaling pathway | 51/1875 | 167/8465 | 6.83e-03 | 2.73e-02 | 1.67e-02 | 51 |
| hsa04910 | Colorectum | MSS | Insulin signaling pathway | 43/1875 | 137/8465 | 7.37e-03 | 2.84e-02 | 1.74e-02 | 43 |
| hsa049225 | Colorectum | MSS | Glucagon signaling pathway | 39/1875 | 107/8465 | 5.00e-04 | 3.45e-03 | 2.11e-03 | 39 |
| hsa040221 | Colorectum | MSS | cGMP-PKG signaling pathway | 51/1875 | 167/8465 | 6.83e-03 | 2.73e-02 | 1.67e-02 | 51 |
| hsa049101 | Colorectum | MSS | Insulin signaling pathway | 43/1875 | 137/8465 | 7.37e-03 | 2.84e-02 | 1.74e-02 | 43 |
| hsa049226 | Colorectum | FAP | Glucagon signaling pathway | 32/1404 | 107/8465 | 4.08e-04 | 3.10e-03 | 1.89e-03 | 32 |
| hsa049102 | Colorectum | FAP | Insulin signaling pathway | 36/1404 | 137/8465 | 2.51e-03 | 1.18e-02 | 7.18e-03 | 36 |
| hsa040222 | Colorectum | FAP | cGMP-PKG signaling pathway | 42/1404 | 167/8465 | 2.84e-03 | 1.27e-02 | 7.70e-03 | 42 |
| hsa04024 | Colorectum | FAP | cAMP signaling pathway | 51/1404 | 225/8465 | 1.02e-02 | 3.68e-02 | 2.24e-02 | 51 |
| hsa049227 | Colorectum | FAP | Glucagon signaling pathway | 32/1404 | 107/8465 | 4.08e-04 | 3.10e-03 | 1.89e-03 | 32 |
| hsa049103 | Colorectum | FAP | Insulin signaling pathway | 36/1404 | 137/8465 | 2.51e-03 | 1.18e-02 | 7.18e-03 | 36 |
| hsa040223 | Colorectum | FAP | cGMP-PKG signaling pathway | 42/1404 | 167/8465 | 2.84e-03 | 1.27e-02 | 7.70e-03 | 42 |
| hsa040241 | Colorectum | FAP | cAMP signaling pathway | 51/1404 | 225/8465 | 1.02e-02 | 3.68e-02 | 2.24e-02 | 51 |
| hsa040242 | Colorectum | CRC | cAMP signaling pathway | 47/1091 | 225/8465 | 4.57e-04 | 4.77e-03 | 3.23e-03 | 47 |
| hsa049104 | Colorectum | CRC | Insulin signaling pathway | 31/1091 | 137/8465 | 1.07e-03 | 8.91e-03 | 6.03e-03 | 31 |
| Page: 1 2 |
Top |
Cell-cell communication analysis |
| Identification of potential cell-cell interactions between two cell types and their ligand-receptor pairs for different disease states |
| Ligand | Receptor | LRpair | Pathway | Tissue | Disease Stage |
| Page: 1 |
Top |
Single-cell gene regulatory network inference analysis |
| Find out the significant the regulons (TFs) and the target genes of each regulon across cell types for different disease states |
| TF | Cell Type | Tissue | Disease Stage | Target Gene | RSS | Regulon Activity |
| ∗The dot plots of a searched regulon are shown for all cell subpopulations in each disease state of each tissue based on the regulon specific score inferred using pySCENIC and by calculating the average expression. |
| Page: 1 |
Top |
Somatic mutation of malignant transformation related genes |
| Annotation of somatic variants for genes involved in malignant transformation |
| Hugo Symbol | Variant Class | Variant Classification | dbSNP RS | HGVSc | HGVSp | HGVSp Short | SWISSPROT | BIOTYPE | SIFT | PolyPhen | Tumor Sample Barcode | Tissue | Histology | Sex | Age | Stage | Therapy Types | Drugs | Outcome |
| PDE3B | SNV | Missense_Mutation | c.2004N>G | p.Asp668Glu | p.D668E | Q13370 | protein_coding | tolerated(0.39) | benign(0.007) | TCGA-A2-A0D0-01 | Breast | breast invasive carcinoma | Female | <65 | I/II | Chemotherapy | cytoxan | SD | |
| PDE3B | SNV | Missense_Mutation | novel | c.2460N>T | p.Met820Ile | p.M820I | Q13370 | protein_coding | deleterious(0.02) | probably_damaging(0.994) | TCGA-A7-A6VX-01 | Breast | breast invasive carcinoma | Female | >=65 | I/II | Chemotherapy | docetaxel | CR |
| PDE3B | SNV | Missense_Mutation | novel | c.130N>G | p.Pro44Ala | p.P44A | Q13370 | protein_coding | tolerated(0.05) | benign(0.007) | TCGA-AC-A2QI-01 | Breast | breast invasive carcinoma | Female | >=65 | III/IV | Chemotherapy | cytoxan | CR |
| PDE3B | SNV | Missense_Mutation | c.2116N>C | p.Asp706His | p.D706H | Q13370 | protein_coding | deleterious(0) | probably_damaging(0.999) | TCGA-D8-A1JD-01 | Breast | breast invasive carcinoma | Female | <65 | I/II | Chemotherapy | adriamycin | SD | |
| PDE3B | insertion | Frame_Shift_Ins | novel | c.3259_3260insGAATAGCACTGAACAGTGT | p.Asn1087ArgfsTer8 | p.N1087Rfs*8 | Q13370 | protein_coding | TCGA-AO-A128-01 | Breast | breast invasive carcinoma | Female | <65 | I/II | Chemotherapy | doxorubicin | SD | ||
| PDE3B | insertion | In_Frame_Ins | novel | c.968_969insCTCCAGGCTGGAGTG | p.Ser323_Arg324insSerArgLeuGluCys | p.S323_R324insSRLEC | Q13370 | protein_coding | TCGA-BH-A0H9-01 | Breast | breast invasive carcinoma | Female | >=65 | I/II | Hormone Therapy | arimidex | SD | ||
| PDE3B | SNV | Missense_Mutation | novel | c.2689N>C | p.Lys897Gln | p.K897Q | Q13370 | protein_coding | deleterious(0.02) | probably_damaging(1) | TCGA-2W-A8YY-01 | Cervix | cervical & endocervical cancer | Female | <65 | I/II | Chemotherapy | cisplatin | CR |
| PDE3B | SNV | Missense_Mutation | novel | c.2068N>A | p.Glu690Lys | p.E690K | Q13370 | protein_coding | tolerated(0.36) | benign(0.22) | TCGA-VS-A9UZ-01 | Cervix | cervical & endocervical cancer | Female | <65 | I/II | Unknown | Unknown | SD |
| PDE3B | SNV | Missense_Mutation | rs782615223 | c.3088G>A | p.Gly1030Ser | p.G1030S | Q13370 | protein_coding | tolerated(0.29) | benign(0) | TCGA-A6-2686-01 | Colorectum | colon adenocarcinoma | Female | >=65 | I/II | Unknown | Unknown | SD |
| PDE3B | SNV | Missense_Mutation | c.317N>A | p.Ala106Asp | p.A106D | Q13370 | protein_coding | deleterious(0.02) | benign(0.07) | TCGA-AA-3663-01 | Colorectum | colon adenocarcinoma | Male | <65 | I/II | Unknown | Unknown | SD |
| Page: 1 2 3 4 5 6 7 8 9 10 11 12 13 |
Top |
Related drugs of malignant transformation related genes |
| Identification of chemicals and drugs interact with genes involved in malignant transfromation |
| (DGIdb 4.0) |
| Entrez ID | Symbol | Category | Interaction Types | Drug Claim Name | Drug Name | PMIDs |
| 5140 | PDE3B | ENZYME, DRUGGABLE GENOME | inhibitor | CHEMBL190 | THEOPHYLLINE | |
| 5140 | PDE3B | ENZYME, DRUGGABLE GENOME | inhibitor | 178103723 | CILOSTAZOL | |
| 5140 | PDE3B | ENZYME, DRUGGABLE GENOME | US8741907-compound-3 | |||
| 5140 | PDE3B | ENZYME, DRUGGABLE GENOME | inhibitor | CHEMBL628 | PENTOXIFYLLINE | |
| 5140 | PDE3B | ENZYME, DRUGGABLE GENOME | inhibitor | CHEMBL932 | DIPYRIDAMOLE | |
| 5140 | PDE3B | ENZYME, DRUGGABLE GENOME | inhibitor | 178101910 | MILRINONE | |
| 5140 | PDE3B | ENZYME, DRUGGABLE GENOME | inhibitor | CHEMBL1200759 | ANAGRELIDE HYDROCHLORIDE | |
| 5140 | PDE3B | ENZYME, DRUGGABLE GENOME | inhibitor | 178103777 | INAMRINONE | |
| 5140 | PDE3B | ENZYME, DRUGGABLE GENOME | inhibitor | CHEMBL1370561 | AMINOPHYLLINE | |
| 5140 | PDE3B | ENZYME, DRUGGABLE GENOME | inhibitor | CHEMBL1200434 | OXTRIPHYLLINE |
| Page: 1 2 |

Copyright 2023-Present -The University of Texas Health Science Center at Houston |