
|
|||||
|
 | |
| |
| |
| |
| |
| |
|
Gene: PDE1A |
Gene summary for PDE1A |
| Gene information | Species | Human | Gene symbol | PDE1A | Gene ID | 5136 |
| Gene name | phosphodiesterase 1A | |
| Gene Alias | CAM-PDE 1A | |
| Cytomap | 2q32.1 | |
| Gene Type | protein-coding | GO ID | GO:0006139 | UniProtAcc | P54750 |
Top |
Malignant transformation analysis |
| Identification of the aberrant gene expression in precancerous and cancerous lesions by comparing the gene expression of stem-like cells in diseased tissues with normal stem cells |
| Entrez ID | Symbol | Replicates | Species | Organ | Tissue | Adj P-value | Log2FC | Malignancy |
| 5136 | PDE1A | male-WTA | Human | Thyroid | PTC | 8.86e-36 | 3.27e-01 | 0.1037 |
| 5136 | PDE1A | PTC01 | Human | Thyroid | PTC | 6.47e-11 | 2.74e-01 | 0.1899 |
| 5136 | PDE1A | PTC03 | Human | Thyroid | PTC | 2.00e-05 | 1.63e-01 | 0.1784 |
| 5136 | PDE1A | PTC04 | Human | Thyroid | PTC | 1.13e-15 | 3.48e-01 | 0.1927 |
| 5136 | PDE1A | PTC05 | Human | Thyroid | PTC | 2.92e-13 | 8.73e-01 | 0.2065 |
| 5136 | PDE1A | PTC06 | Human | Thyroid | PTC | 3.32e-59 | 1.36e+00 | 0.2057 |
| 5136 | PDE1A | PTC07 | Human | Thyroid | PTC | 6.76e-21 | 5.37e-01 | 0.2044 |
| 5136 | PDE1A | ATC5 | Human | Thyroid | ATC | 1.79e-03 | -2.70e-03 | 0.34 |
| Page: 1 |
| Tissue | Expression Dynamics | Abbreviation |
| Thyroid | 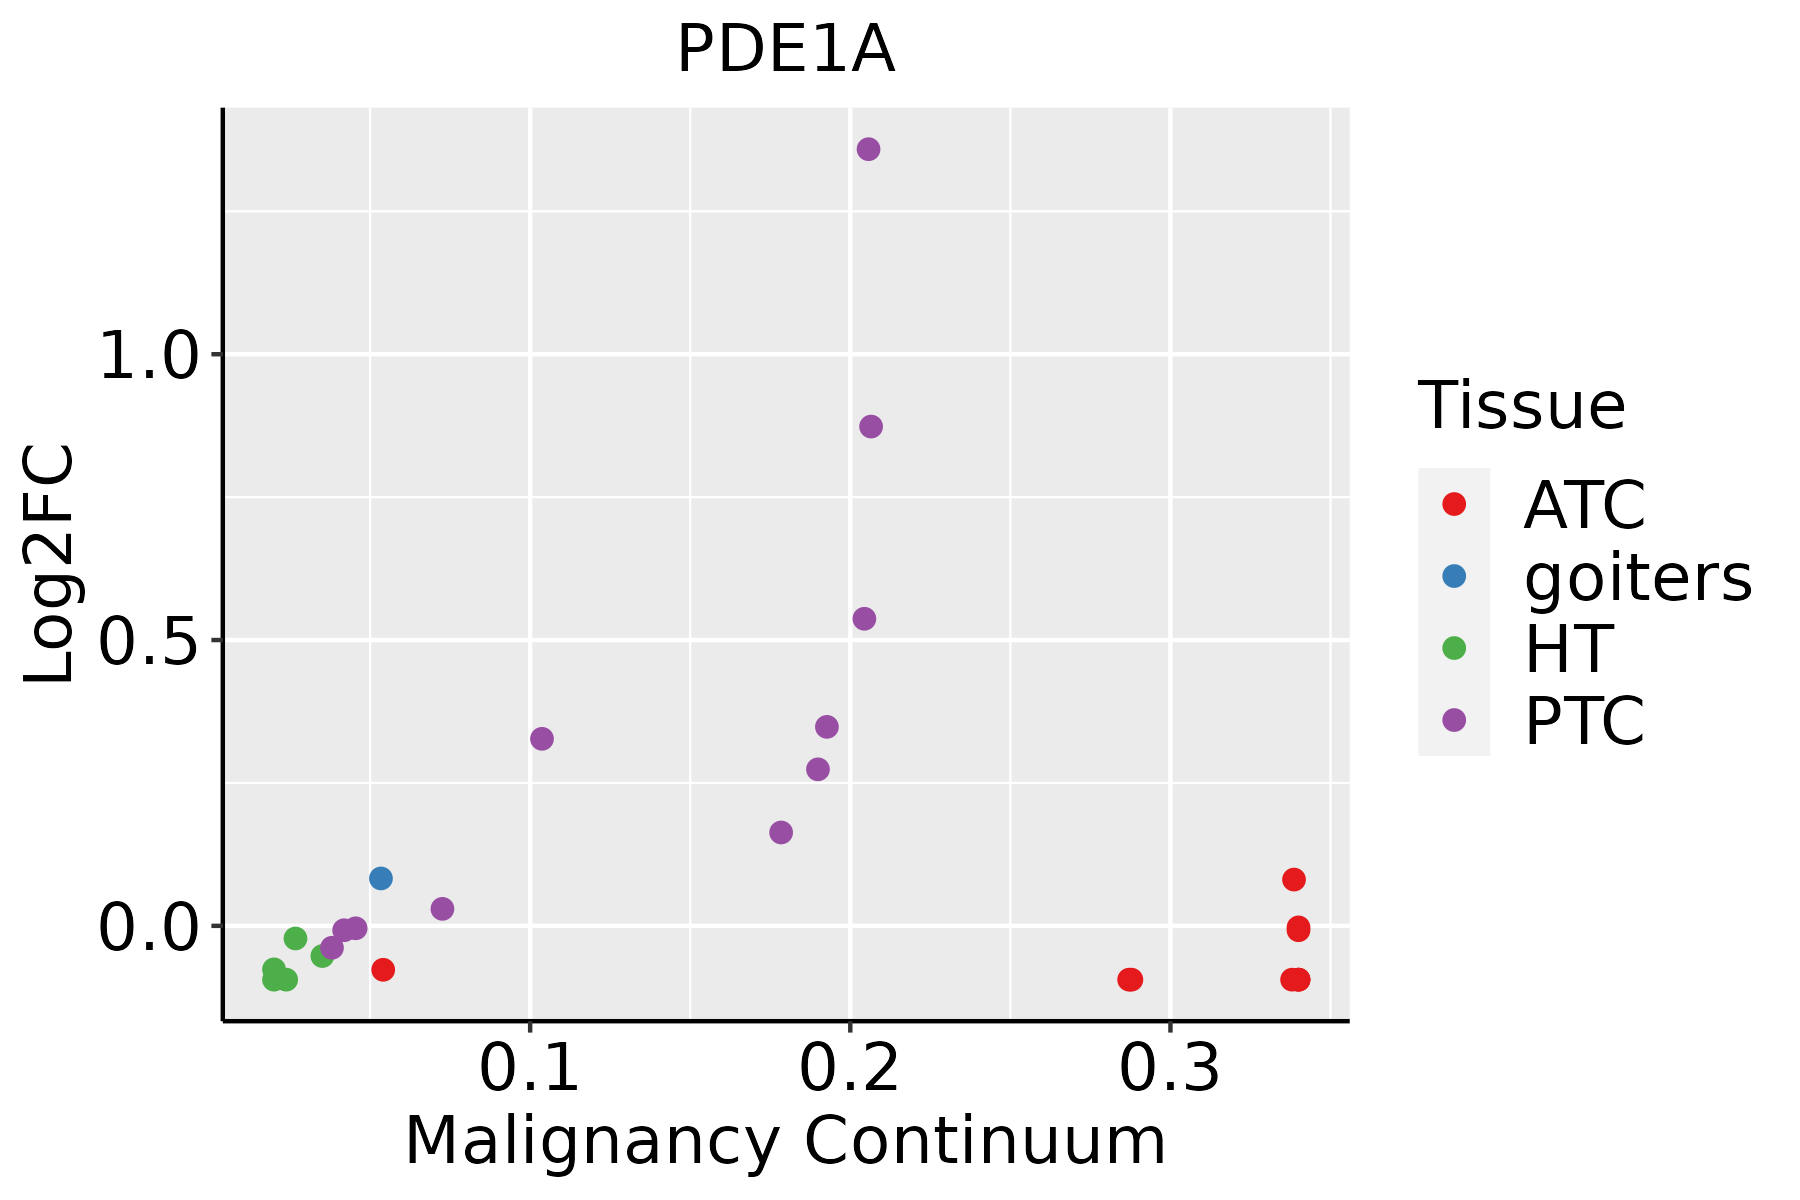 | ATC: Anaplastic thyroid cancer |
| HT: Hashimoto's thyroiditis | ||
| PTC: Papillary thyroid cancer |
| ∗log2FC in expression of this searched gene in stem-like cells from each diseased tissue sample relative to stem-like cells in normal samples in each tissue plotted against the malignancy continuum. Samples are colored based on if they are from different disease stage. |
Top |
Malignant transformation related pathway analysis |
| Find out the enriched GO biological processes and KEGG pathways involved in transition from healthy to precancer to cancer |
| Tissue | Disease Stage | Enriched GO biological Processes |
| Colorectum | AD |  |
| Colorectum | SER |  |
| Colorectum | MSS |  |
| Colorectum | MSI-H |  |
| Colorectum | FAP |  |
| ∗Top 15 enriched GO BP terms are showed in the bar plot of each disease state in each tissue. Each row represents a significant GO biological process which is colored according to the -log10(p.adjust). |
| Page: 1 2 3 4 5 6 7 8 9 |
| GO ID | Tissue | Disease Stage | Description | Gene Ratio | Bg Ratio | pvalue | p.adjust | Count |
| GO:0034655112 | Thyroid | PTC | nucleobase-containing compound catabolic process | 211/5968 | 407/18723 | 2.72e-17 | 2.52e-15 | 211 |
| GO:0046700111 | Thyroid | PTC | heterocycle catabolic process | 221/5968 | 445/18723 | 2.43e-15 | 1.72e-13 | 221 |
| GO:0044270111 | Thyroid | PTC | cellular nitrogen compound catabolic process | 223/5968 | 451/18723 | 3.34e-15 | 2.31e-13 | 223 |
| GO:0019439111 | Thyroid | PTC | aromatic compound catabolic process | 225/5968 | 467/18723 | 8.51e-14 | 4.71e-12 | 225 |
| GO:1901361111 | Thyroid | PTC | organic cyclic compound catabolic process | 231/5968 | 495/18723 | 2.55e-12 | 1.12e-10 | 231 |
| GO:001969327 | Thyroid | PTC | ribose phosphate metabolic process | 176/5968 | 396/18723 | 8.28e-08 | 1.70e-06 | 176 |
| GO:000915028 | Thyroid | PTC | purine ribonucleotide metabolic process | 165/5968 | 368/18723 | 1.03e-07 | 2.05e-06 | 165 |
| GO:007252127 | Thyroid | PTC | purine-containing compound metabolic process | 182/5968 | 416/18723 | 1.92e-07 | 3.51e-06 | 182 |
| GO:000925927 | Thyroid | PTC | ribonucleotide metabolic process | 170/5968 | 385/18723 | 2.32e-07 | 4.08e-06 | 170 |
| GO:000616327 | Thyroid | PTC | purine nucleotide metabolic process | 170/5968 | 396/18723 | 2.02e-06 | 2.75e-05 | 170 |
| GO:000675325 | Thyroid | PTC | nucleoside phosphate metabolic process | 205/5968 | 497/18723 | 5.24e-06 | 6.35e-05 | 205 |
| GO:000911725 | Thyroid | PTC | nucleotide metabolic process | 202/5968 | 489/18723 | 5.46e-06 | 6.60e-05 | 202 |
| GO:003465525 | Thyroid | ATC | nucleobase-containing compound catabolic process | 217/6293 | 407/18723 | 1.20e-16 | 1.04e-14 | 217 |
| GO:004670024 | Thyroid | ATC | heterocycle catabolic process | 228/6293 | 445/18723 | 7.26e-15 | 4.50e-13 | 228 |
| GO:004427025 | Thyroid | ATC | cellular nitrogen compound catabolic process | 229/6293 | 451/18723 | 2.25e-14 | 1.27e-12 | 229 |
| GO:001943924 | Thyroid | ATC | aromatic compound catabolic process | 232/6293 | 467/18723 | 3.05e-13 | 1.44e-11 | 232 |
| GO:190136124 | Thyroid | ATC | organic cyclic compound catabolic process | 238/6293 | 495/18723 | 1.12e-11 | 4.12e-10 | 238 |
| GO:001969328 | Thyroid | ATC | ribose phosphate metabolic process | 184/6293 | 396/18723 | 5.87e-08 | 1.05e-06 | 184 |
| GO:000915029 | Thyroid | ATC | purine ribonucleotide metabolic process | 172/6293 | 368/18723 | 9.58e-08 | 1.64e-06 | 172 |
| GO:000925928 | Thyroid | ATC | ribonucleotide metabolic process | 178/6293 | 385/18723 | 1.47e-07 | 2.39e-06 | 178 |
| Page: 1 2 |
| Pathway ID | Tissue | Disease Stage | Description | Gene Ratio | Bg Ratio | pvalue | p.adjust | qvalue | Count |
| Page: 1 |
Top |
Cell-cell communication analysis |
| Identification of potential cell-cell interactions between two cell types and their ligand-receptor pairs for different disease states |
| Ligand | Receptor | LRpair | Pathway | Tissue | Disease Stage |
| Page: 1 |
Top |
Single-cell gene regulatory network inference analysis |
| Find out the significant the regulons (TFs) and the target genes of each regulon across cell types for different disease states |
| TF | Cell Type | Tissue | Disease Stage | Target Gene | RSS | Regulon Activity |
| ∗The dot plots of a searched regulon are shown for all cell subpopulations in each disease state of each tissue based on the regulon specific score inferred using pySCENIC and by calculating the average expression. |
| Page: 1 |
Top |
Somatic mutation of malignant transformation related genes |
| Annotation of somatic variants for genes involved in malignant transformation |
| Hugo Symbol | Variant Class | Variant Classification | dbSNP RS | HGVSc | HGVSp | HGVSp Short | SWISSPROT | BIOTYPE | SIFT | PolyPhen | Tumor Sample Barcode | Tissue | Histology | Sex | Age | Stage | Therapy Types | Drugs | Outcome |
| PDE1A | SNV | Missense_Mutation | c.439N>T | p.Pro147Ser | p.P147S | P54750 | protein_coding | tolerated(0.09) | possibly_damaging(0.721) | TCGA-A8-A07Z-01 | Breast | breast invasive carcinoma | Female | >=65 | I/II | Unspecific | Exemestane | SD | |
| PDE1A | SNV | Missense_Mutation | novel | c.1276N>A | p.Glu426Lys | p.E426K | P54750 | protein_coding | tolerated(0.07) | benign(0.104) | TCGA-AN-A046-01 | Breast | breast invasive carcinoma | Female | >=65 | I/II | Unknown | Unknown | SD |
| PDE1A | SNV | Missense_Mutation | rs553030991 | c.1355N>T | p.Thr452Ile | p.T452I | P54750 | protein_coding | tolerated(0.21) | benign(0.038) | TCGA-B6-A0RG-01 | Breast | breast invasive carcinoma | Female | <65 | I/II | Unknown | Unknown | SD |
| PDE1A | SNV | Missense_Mutation | c.380C>A | p.Ala127Asp | p.A127D | P54750 | protein_coding | deleterious(0) | probably_damaging(0.988) | TCGA-BH-A18G-01 | Breast | breast invasive carcinoma | Female | >=65 | I/II | Unknown | Unknown | SD | |
| PDE1A | SNV | Missense_Mutation | c.191N>G | p.Glu64Gly | p.E64G | P54750 | protein_coding | deleterious(0) | probably_damaging(0.967) | TCGA-D8-A1XQ-01 | Breast | breast invasive carcinoma | Female | >=65 | I/II | Unknown | Unknown | SD | |
| PDE1A | SNV | Missense_Mutation | novel | c.143N>G | p.Asn48Ser | p.N48S | P54750 | protein_coding | tolerated(1) | benign(0.009) | TCGA-EA-A410-01 | Cervix | cervical & endocervical cancer | Female | <65 | I/II | Unknown | Unknown | SD |
| PDE1A | SNV | Missense_Mutation | c.232G>C | p.Glu78Gln | p.E78Q | P54750 | protein_coding | deleterious(0.03) | probably_damaging(0.935) | TCGA-EK-A2PG-01 | Cervix | cervical & endocervical cancer | Female | >=65 | I/II | Unknown | Unknown | SD | |
| PDE1A | SNV | Missense_Mutation | c.1159G>A | p.Glu387Lys | p.E387K | P54750 | protein_coding | deleterious(0) | probably_damaging(1) | TCGA-EK-A3GK-01 | Cervix | cervical & endocervical cancer | Female | <65 | I/II | Unknown | Unknown | SD | |
| PDE1A | SNV | Missense_Mutation | c.865N>C | p.Glu289Gln | p.E289Q | P54750 | protein_coding | deleterious(0) | probably_damaging(0.999) | TCGA-Q1-A73O-01 | Cervix | cervical & endocervical cancer | Female | <65 | I/II | Chemotherapy | cisplatin | CR | |
| PDE1A | deletion | Frame_Shift_Del | novel | c.1142_1160delNNNNNNNNNNNNNNNNNNN | p.Thr381SerfsTer12 | p.T381Sfs*12 | P54750 | protein_coding | TCGA-HM-A3JJ-01 | Cervix | cervical & endocervical cancer | Female | <65 | I/II | Chemotherapy | cisplatin | PD |
| Page: 1 2 3 4 5 6 7 8 9 10 |
Top |
Related drugs of malignant transformation related genes |
| Identification of chemicals and drugs interact with genes involved in malignant transfromation |
| (DGIdb 4.0) |
| Entrez ID | Symbol | Category | Interaction Types | Drug Claim Name | Drug Name | PMIDs |
| 5136 | PDE1A | ENZYME, DRUGGABLE GENOME | inhibitor | 178101953 | ||
| 5136 | PDE1A | ENZYME, DRUGGABLE GENOME | inhibitor | 178101968 | VINPOCETINE | |
| 5136 | PDE1A | ENZYME, DRUGGABLE GENOME | inhibitor | CHEMBL628 | PENTOXIFYLLINE | |
| 5136 | PDE1A | ENZYME, DRUGGABLE GENOME | inhibitor | CHEMBL932 | DIPYRIDAMOLE | |
| 5136 | PDE1A | ENZYME, DRUGGABLE GENOME | activator | 135652052 | ||
| 5136 | PDE1A | ENZYME, DRUGGABLE GENOME | inhibitor | 315661236 | CRISABOROLE |
| Page: 1 |

Copyright 2023-Present -The University of Texas Health Science Center at Houston |