
|
|||||
|
 | |
| |
| |
| |
| |
| |
|
Gene: PDE11A |
Gene summary for PDE11A |
| Gene information | Species | Human | Gene symbol | PDE11A | Gene ID | 50940 |
| Gene name | phosphodiesterase 11A | |
| Gene Alias | PPNAD2 | |
| Cytomap | 2q31.2 | |
| Gene Type | protein-coding | GO ID | GO:0007154 | UniProtAcc | Q9HCR9 |
Top |
Malignant transformation analysis |
| Identification of the aberrant gene expression in precancerous and cancerous lesions by comparing the gene expression of stem-like cells in diseased tissues with normal stem cells |
| Entrez ID | Symbol | Replicates | Species | Organ | Tissue | Adj P-value | Log2FC | Malignancy |
| 50940 | PDE11A | S41 | Human | Liver | Cirrhotic | 6.50e-04 | 3.03e-01 | -0.0343 |
| 50940 | PDE11A | HCC1_Meng | Human | Liver | HCC | 5.42e-05 | -1.81e-03 | 0.0246 |
| 50940 | PDE11A | HCC2_Meng | Human | Liver | HCC | 3.32e-03 | 3.68e-02 | 0.0107 |
| 50940 | PDE11A | HCC1 | Human | Liver | HCC | 3.64e-20 | 1.99e+00 | 0.5336 |
| 50940 | PDE11A | HCC2 | Human | Liver | HCC | 9.17e-41 | 2.16e+00 | 0.5341 |
| 50940 | PDE11A | HCC5 | Human | Liver | HCC | 1.62e-58 | 2.61e+00 | 0.4932 |
| 50940 | PDE11A | S015 | Human | Liver | HCC | 1.62e-08 | 3.17e-01 | 0.2375 |
| 50940 | PDE11A | S016 | Human | Liver | HCC | 5.33e-06 | 1.59e-01 | 0.2243 |
| Page: 1 |
| Tissue | Expression Dynamics | Abbreviation |
| Liver | 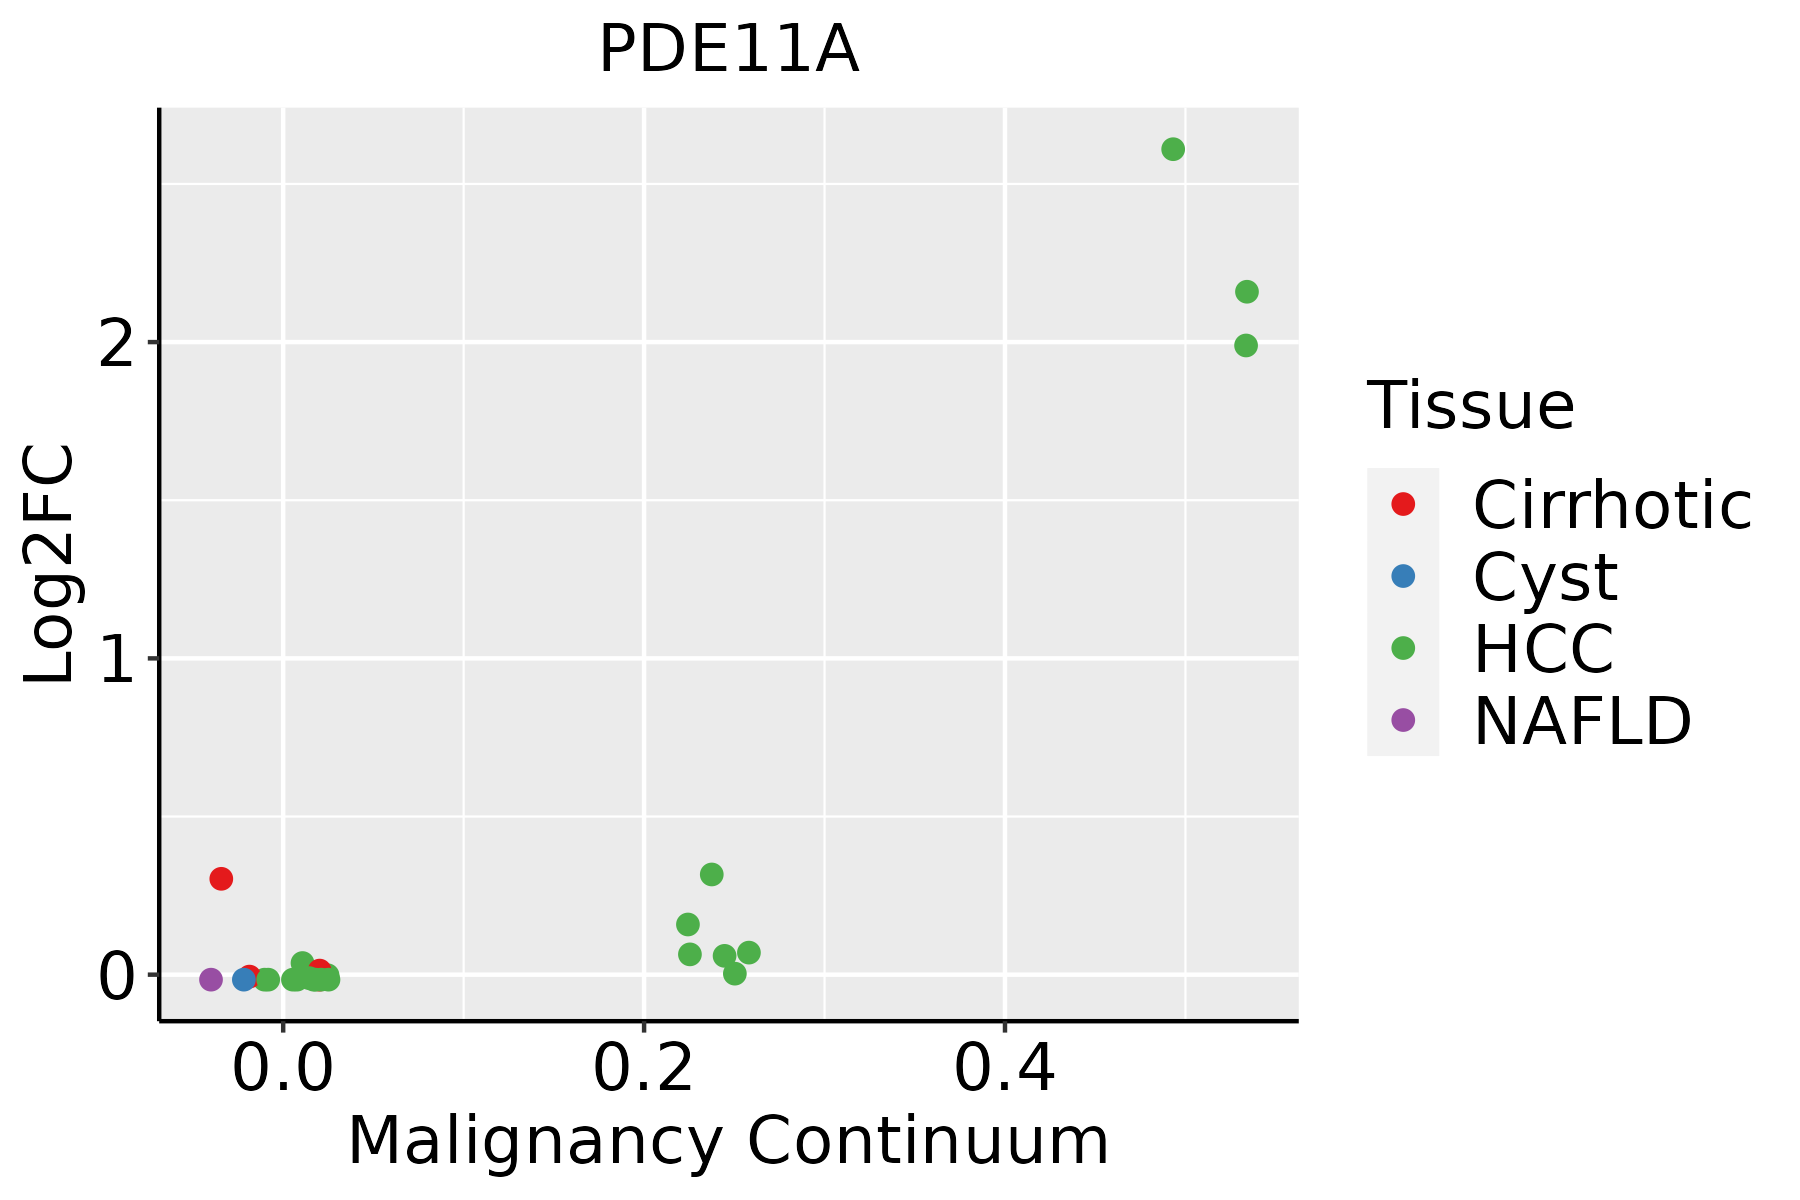 | HCC: Hepatocellular carcinoma |
| NAFLD: Non-alcoholic fatty liver disease |
| ∗log2FC in expression of this searched gene in stem-like cells from each diseased tissue sample relative to stem-like cells in normal samples in each tissue plotted against the malignancy continuum. Samples are colored based on if they are from different disease stage. |
Top |
Malignant transformation related pathway analysis |
| Find out the enriched GO biological processes and KEGG pathways involved in transition from healthy to precancer to cancer |
| Tissue | Disease Stage | Enriched GO biological Processes |
| Colorectum | AD |  |
| Colorectum | SER |  |
| Colorectum | MSS |  |
| Colorectum | MSI-H |  |
| Colorectum | FAP |  |
| ∗Top 15 enriched GO BP terms are showed in the bar plot of each disease state in each tissue. Each row represents a significant GO biological process which is colored according to the -log10(p.adjust). |
| Page: 1 2 3 4 5 6 7 8 9 |
| GO ID | Tissue | Disease Stage | Description | Gene Ratio | Bg Ratio | pvalue | p.adjust | Count |
| Page: 1 |
| Pathway ID | Tissue | Disease Stage | Description | Gene Ratio | Bg Ratio | pvalue | p.adjust | qvalue | Count |
| Page: 1 |
Top |
Cell-cell communication analysis |
| Identification of potential cell-cell interactions between two cell types and their ligand-receptor pairs for different disease states |
| Ligand | Receptor | LRpair | Pathway | Tissue | Disease Stage |
| Page: 1 |
Top |
Single-cell gene regulatory network inference analysis |
| Find out the significant the regulons (TFs) and the target genes of each regulon across cell types for different disease states |
| TF | Cell Type | Tissue | Disease Stage | Target Gene | RSS | Regulon Activity |
| ∗The dot plots of a searched regulon are shown for all cell subpopulations in each disease state of each tissue based on the regulon specific score inferred using pySCENIC and by calculating the average expression. |
| Page: 1 |
Top |
Somatic mutation of malignant transformation related genes |
| Annotation of somatic variants for genes involved in malignant transformation |
| Hugo Symbol | Variant Class | Variant Classification | dbSNP RS | HGVSc | HGVSp | HGVSp Short | SWISSPROT | BIOTYPE | SIFT | PolyPhen | Tumor Sample Barcode | Tissue | Histology | Sex | Age | Stage | Therapy Types | Drugs | Outcome |
| PDE11A | SNV | Missense_Mutation | novel | c.2056C>G | p.Gln686Glu | p.Q686E | Q9HCR9 | protein_coding | tolerated(0.21) | benign(0.114) | TCGA-5L-AAT1-01 | Breast | breast invasive carcinoma | Female | <65 | III/IV | Hormone Therapy | letrozol | SD |
| PDE11A | SNV | Missense_Mutation | novel | c.1621N>A | p.Asp541Asn | p.D541N | Q9HCR9 | protein_coding | tolerated(0.06) | benign(0.075) | TCGA-A8-A082-01 | Breast | breast invasive carcinoma | Female | <65 | I/II | Chemotherapy | 5-fluorouracil | CR |
| PDE11A | SNV | Missense_Mutation | rs762697508 | c.1264N>T | p.Arg422Cys | p.R422C | Q9HCR9 | protein_coding | deleterious(0) | benign(0.175) | TCGA-A8-A096-01 | Breast | breast invasive carcinoma | Female | >=65 | I/II | Unknown | Unknown | SD |
| PDE11A | SNV | Missense_Mutation | novel | c.626N>G | p.Val209Gly | p.V209G | Q9HCR9 | protein_coding | deleterious(0) | probably_damaging(0.99) | TCGA-AN-A046-01 | Breast | breast invasive carcinoma | Female | >=65 | I/II | Unknown | Unknown | SD |
| PDE11A | SNV | Missense_Mutation | c.2165C>T | p.Ala722Val | p.A722V | Q9HCR9 | protein_coding | tolerated(0.12) | possibly_damaging(0.792) | TCGA-BH-A0EB-01 | Breast | breast invasive carcinoma | Female | >=65 | I/II | Hormone Therapy | arimidex | SD | |
| PDE11A | SNV | Missense_Mutation | c.496N>T | p.Pro166Ser | p.P166S | Q9HCR9 | protein_coding | deleterious(0.01) | possibly_damaging(0.7) | TCGA-BH-A0H3-01 | Breast | breast invasive carcinoma | Female | <65 | I/II | Unknown | Unknown | SD | |
| PDE11A | SNV | Missense_Mutation | c.1685N>C | p.Ile562Thr | p.I562T | Q9HCR9 | protein_coding | tolerated(0.24) | possibly_damaging(0.649) | TCGA-E9-A1NA-01 | Breast | breast invasive carcinoma | Female | <65 | I/II | Chemotherapy | cyclophosphamide | SD | |
| PDE11A | deletion | Frame_Shift_Del | novel | c.1243_1261delNNNNNNNNNNNNNNNNNNN | p.Gln415AsnfsTer8 | p.Q415Nfs*8 | Q9HCR9 | protein_coding | TCGA-AR-A0TS-01 | Breast | breast invasive carcinoma | Female | <65 | I/II | Chemotherapy | doxorubicin | SD | ||
| PDE11A | insertion | Frame_Shift_Ins | novel | c.1911_1912insAAAAAAAAAACTCTGCCTCATTT | p.Gln638LysfsTer23 | p.Q638Kfs*23 | Q9HCR9 | protein_coding | TCGA-B6-A0IN-01 | Breast | breast invasive carcinoma | Female | <65 | I/II | Unknown | Unknown | PD | ||
| PDE11A | deletion | Frame_Shift_Del | novel | c.406delN | p.Thr136ProfsTer6 | p.T136Pfs*6 | Q9HCR9 | protein_coding | TCGA-EW-A2FV-01 | Breast | breast invasive carcinoma | Female | <65 | III/IV | Chemotherapy | docetaxel | SD |
| Page: 1 2 3 4 5 6 7 8 9 10 11 12 13 |
Top |
Related drugs of malignant transformation related genes |
| Identification of chemicals and drugs interact with genes involved in malignant transfromation |
| (DGIdb 4.0) |
| Entrez ID | Symbol | Category | Interaction Types | Drug Claim Name | Drug Name | PMIDs |
| 50940 | PDE11A | DRUGGABLE GENOME, ENZYME | inhibitor | 178103173 | ||
| 50940 | PDE11A | DRUGGABLE GENOME, ENZYME | inhibitor | 178103872 | TADALAFIL |
| Page: 1 |

Copyright 2023-Present -The University of Texas Health Science Center at Houston |