
|
|||||
|
 | |
| |
| |
| |
| |
| |
|
Gene: PDE10A |
Gene summary for PDE10A |
| Gene information | Species | Human | Gene symbol | PDE10A | Gene ID | 10846 |
| Gene name | phosphodiesterase 10A | |
| Gene Alias | ADSD2 | |
| Cytomap | 6q27 | |
| Gene Type | protein-coding | GO ID | GO:0006139 | UniProtAcc | Q9Y233 |
Top |
Malignant transformation analysis |
| Identification of the aberrant gene expression in precancerous and cancerous lesions by comparing the gene expression of stem-like cells in diseased tissues with normal stem cells |
| Entrez ID | Symbol | Replicates | Species | Organ | Tissue | Adj P-value | Log2FC | Malignancy |
| 10846 | PDE10A | RNA-P7T1-P7T1-1 | Human | Lung | AIS | 9.39e-09 | 7.73e-01 | -0.0961 |
| 10846 | PDE10A | RNA-P7T1-P7T1-2 | Human | Lung | AIS | 8.94e-07 | 7.05e-01 | -0.0876 |
| 10846 | PDE10A | RNA-P7T1-P7T1-3 | Human | Lung | AIS | 3.20e-11 | 8.81e-01 | -0.0822 |
| 10846 | PDE10A | RNA-P7T1-P7T1-4 | Human | Lung | AIS | 6.36e-10 | 8.09e-01 | -0.0809 |
| 10846 | PDE10A | HTA12-15-2 | Human | Pancreas | PDAC | 4.09e-08 | 5.34e-01 | 0.2315 |
| 10846 | PDE10A | HTA12-16-2 | Human | Pancreas | PDAC | 1.71e-02 | 6.26e-01 | 0.0535 |
| 10846 | PDE10A | HTA12-23-1 | Human | Pancreas | PDAC | 3.85e-13 | 1.21e+00 | 0.3405 |
| 10846 | PDE10A | HTA12-25-1 | Human | Pancreas | PDAC | 2.04e-11 | 8.27e-01 | 0.313 |
| 10846 | PDE10A | HTA12-26-1 | Human | Pancreas | PDAC | 4.22e-23 | 1.16e+00 | 0.3728 |
| 10846 | PDE10A | HTA12-29-1 | Human | Pancreas | PDAC | 1.38e-67 | 1.39e+00 | 0.3722 |
| 10846 | PDE10A | HTA12-30-1 | Human | Pancreas | PDAC | 1.14e-02 | 7.46e-01 | 0.3671 |
| 10846 | PDE10A | HTA12-32-1 | Human | Pancreas | PDAC | 1.46e-03 | 9.49e-01 | 0.3624 |
| 10846 | PDE10A | HTA12-9-3 | Human | Pancreas | PDAC | 3.02e-08 | 8.68e-01 | 0.2045 |
| 10846 | PDE10A | GSM5252130_BPH340PrGF_Via | Human | Prostate | BPH | 6.35e-03 | 1.88e-01 | -0.1972 |
| 10846 | PDE10A | GSM5252131_BPH340PrSF_Via | Human | Prostate | BPH | 4.88e-03 | 1.80e-01 | -0.2126 |
| 10846 | PDE10A | GSM5252132_BPH389PrGF | Human | Prostate | BPH | 2.70e-15 | 4.89e-01 | -0.2247 |
| 10846 | PDE10A | GSM5252134_BPH511PrG_Fcol_3GEX | Human | Prostate | BPH | 5.05e-04 | 1.47e-01 | -0.1433 |
| 10846 | PDE10A | 047563_1562-all-cells | Human | Prostate | BPH | 3.62e-25 | 6.24e-01 | 0.0791 |
| 10846 | PDE10A | 048752_1579-all-cells | Human | Prostate | BPH | 1.21e-79 | 1.31e+00 | 0.1008 |
| 10846 | PDE10A | 052095_1628-all-cells | Human | Prostate | BPH | 3.17e-28 | 6.90e-01 | 0.1032 |
| Page: 1 2 |
| Tissue | Expression Dynamics | Abbreviation |
| Lung |  | AAH: Atypical adenomatous hyperplasia |
| AIS: Adenocarcinoma in situ | ||
| IAC: Invasive lung adenocarcinoma | ||
| MIA: Minimally invasive adenocarcinoma | ||
| Prostate | 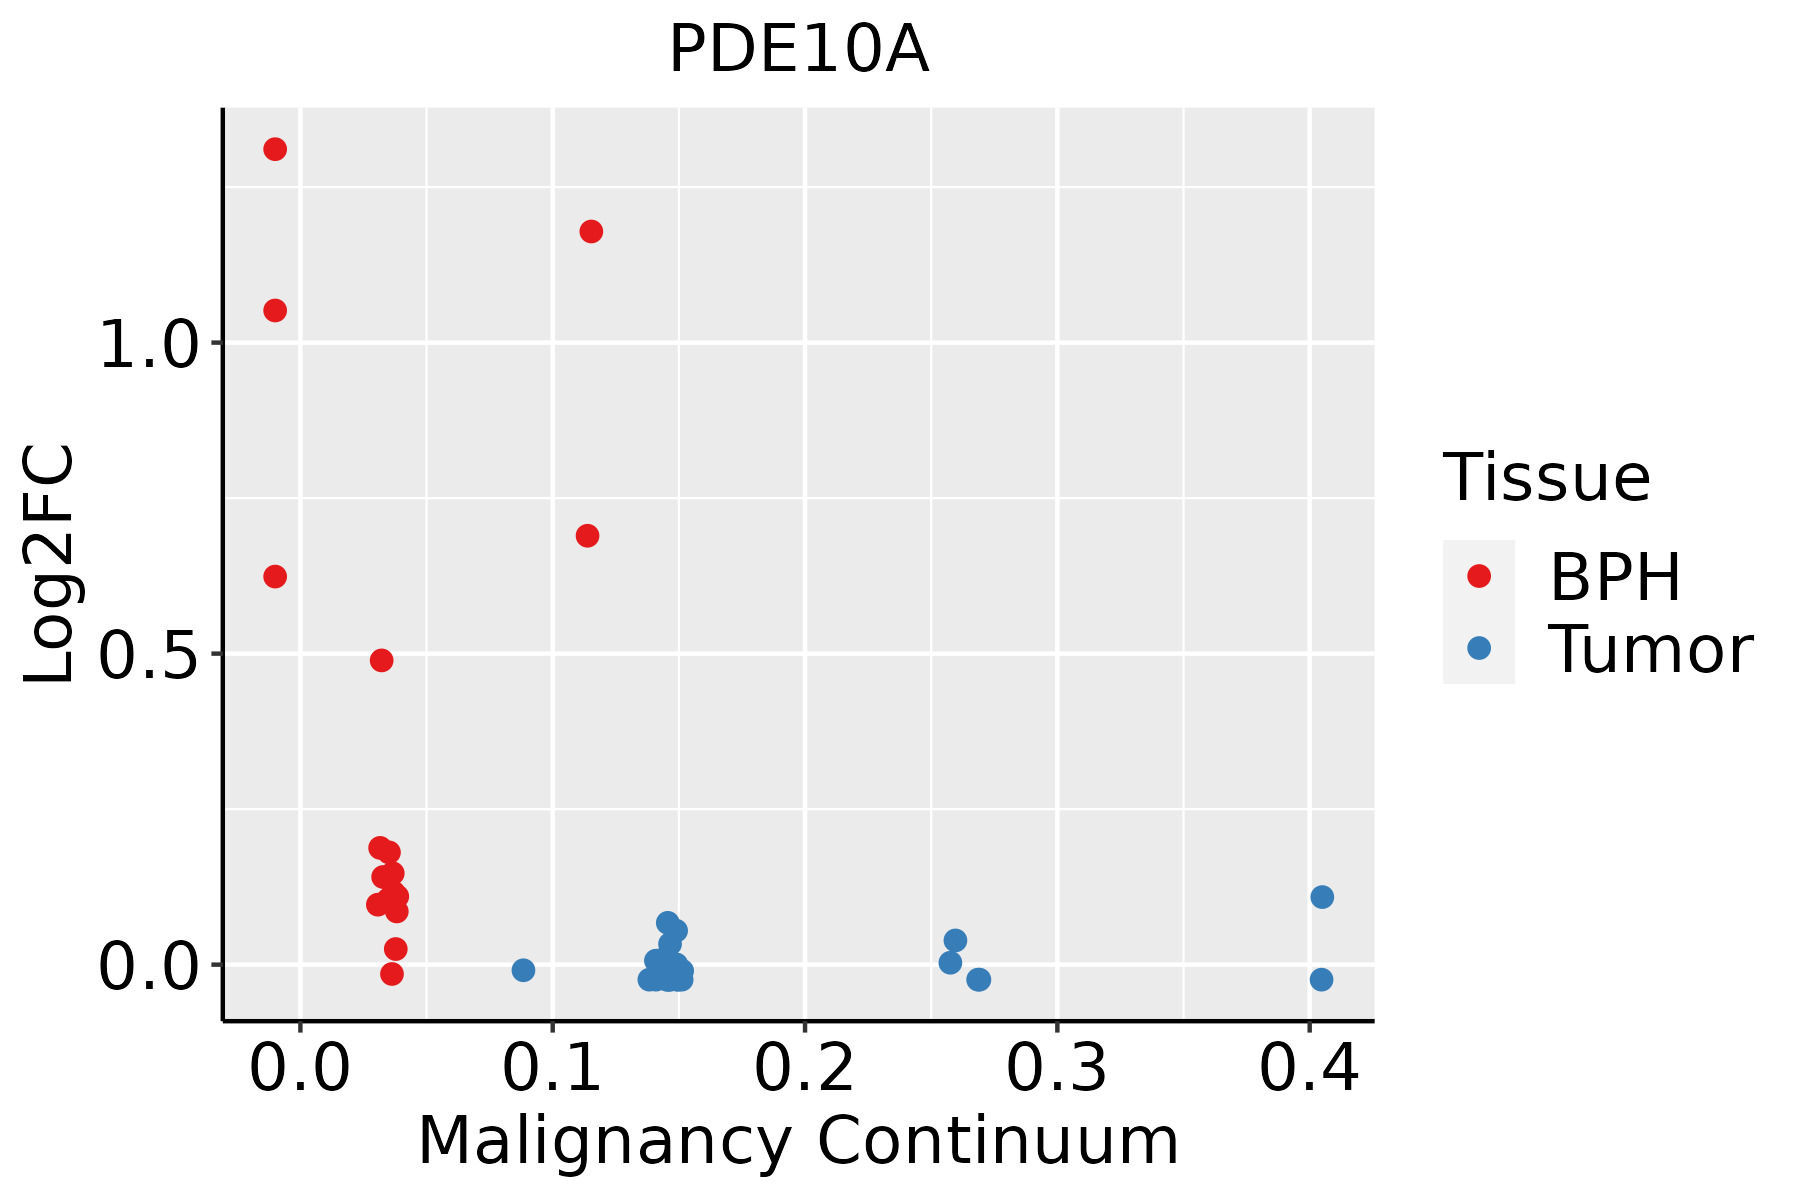 | BPH: Benign Prostatic Hyperplasia |
| ∗log2FC in expression of this searched gene in stem-like cells from each diseased tissue sample relative to stem-like cells in normal samples in each tissue plotted against the malignancy continuum. Samples are colored based on if they are from different disease stage. |
Top |
Malignant transformation related pathway analysis |
| Find out the enriched GO biological processes and KEGG pathways involved in transition from healthy to precancer to cancer |
| Tissue | Disease Stage | Enriched GO biological Processes |
| Colorectum | AD |  |
| Colorectum | SER |  |
| Colorectum | MSS |  |
| Colorectum | MSI-H |  |
| Colorectum | FAP |  |
| ∗Top 15 enriched GO BP terms are showed in the bar plot of each disease state in each tissue. Each row represents a significant GO biological process which is colored according to the -log10(p.adjust). |
| Page: 1 2 3 4 5 6 7 8 9 |
| GO ID | Tissue | Disease Stage | Description | Gene Ratio | Bg Ratio | pvalue | p.adjust | Count |
| GO:000915013 | Lung | AIS | purine ribonucleotide metabolic process | 58/1849 | 368/18723 | 2.33e-04 | 4.68e-03 | 58 |
| GO:000925913 | Lung | AIS | ribonucleotide metabolic process | 59/1849 | 385/18723 | 4.36e-04 | 7.41e-03 | 59 |
| GO:000616313 | Lung | AIS | purine nucleotide metabolic process | 59/1849 | 396/18723 | 8.91e-04 | 1.20e-02 | 59 |
| GO:001969313 | Lung | AIS | ribose phosphate metabolic process | 59/1849 | 396/18723 | 8.91e-04 | 1.20e-02 | 59 |
| GO:007252113 | Lung | AIS | purine-containing compound metabolic process | 61/1849 | 416/18723 | 1.10e-03 | 1.42e-02 | 61 |
| GO:0019932 | Lung | AIS | second-messenger-mediated signaling | 46/1849 | 312/18723 | 3.79e-03 | 3.52e-02 | 46 |
| GO:000915018 | Prostate | BPH | purine ribonucleotide metabolic process | 107/3107 | 368/18723 | 1.18e-09 | 5.19e-08 | 107 |
| GO:000925917 | Prostate | BPH | ribonucleotide metabolic process | 108/3107 | 385/18723 | 8.73e-09 | 2.97e-07 | 108 |
| GO:000616318 | Prostate | BPH | purine nucleotide metabolic process | 109/3107 | 396/18723 | 2.28e-08 | 6.94e-07 | 109 |
| GO:001969317 | Prostate | BPH | ribose phosphate metabolic process | 109/3107 | 396/18723 | 2.28e-08 | 6.94e-07 | 109 |
| GO:007252118 | Prostate | BPH | purine-containing compound metabolic process | 113/3107 | 416/18723 | 2.77e-08 | 8.13e-07 | 113 |
| GO:003465515 | Prostate | BPH | nucleobase-containing compound catabolic process | 107/3107 | 407/18723 | 3.79e-07 | 7.89e-06 | 107 |
| GO:004670010 | Prostate | BPH | heterocycle catabolic process | 111/3107 | 445/18723 | 3.58e-06 | 5.54e-05 | 111 |
| GO:004427014 | Prostate | BPH | cellular nitrogen compound catabolic process | 112/3107 | 451/18723 | 4.04e-06 | 6.12e-05 | 112 |
| GO:000911717 | Prostate | BPH | nucleotide metabolic process | 118/3107 | 489/18723 | 9.68e-06 | 1.35e-04 | 118 |
| GO:001943910 | Prostate | BPH | aromatic compound catabolic process | 113/3107 | 467/18723 | 1.30e-05 | 1.72e-04 | 113 |
| GO:190136110 | Prostate | BPH | organic cyclic compound catabolic process | 118/3107 | 495/18723 | 1.75e-05 | 2.17e-04 | 118 |
| GO:000675316 | Prostate | BPH | nucleoside phosphate metabolic process | 118/3107 | 497/18723 | 2.13e-05 | 2.58e-04 | 118 |
| Page: 1 |
| Pathway ID | Tissue | Disease Stage | Description | Gene Ratio | Bg Ratio | pvalue | p.adjust | qvalue | Count |
| Page: 1 |
Top |
Cell-cell communication analysis |
| Identification of potential cell-cell interactions between two cell types and their ligand-receptor pairs for different disease states |
| Ligand | Receptor | LRpair | Pathway | Tissue | Disease Stage |
| Page: 1 |
Top |
Single-cell gene regulatory network inference analysis |
| Find out the significant the regulons (TFs) and the target genes of each regulon across cell types for different disease states |
| TF | Cell Type | Tissue | Disease Stage | Target Gene | RSS | Regulon Activity |
| ∗The dot plots of a searched regulon are shown for all cell subpopulations in each disease state of each tissue based on the regulon specific score inferred using pySCENIC and by calculating the average expression. |
| Page: 1 |
Top |
Somatic mutation of malignant transformation related genes |
| Annotation of somatic variants for genes involved in malignant transformation |
| Hugo Symbol | Variant Class | Variant Classification | dbSNP RS | HGVSc | HGVSp | HGVSp Short | SWISSPROT | BIOTYPE | SIFT | PolyPhen | Tumor Sample Barcode | Tissue | Histology | Sex | Age | Stage | Therapy Types | Drugs | Outcome |
| PDE10A | SNV | Missense_Mutation | c.623G>T | p.Gly208Val | p.G208V | Q9Y233 | protein_coding | deleterious(0) | probably_damaging(1) | TCGA-A7-A26G-01 | Breast | breast invasive carcinoma | Female | <65 | I/II | Chemotherapy | taxotere | SD | |
| PDE10A | SNV | Missense_Mutation | c.2065N>A | p.Ala689Thr | p.A689T | Q9Y233 | protein_coding | deleterious(0.05) | probably_damaging(0.997) | TCGA-AC-A23C-01 | Breast | breast invasive carcinoma | Female | <65 | I/II | Chemotherapy | chemo | CR | |
| PDE10A | SNV | Missense_Mutation | c.121G>A | p.Asp41Asn | p.D41N | Q9Y233 | protein_coding | deleterious(0) | probably_damaging(0.971) | TCGA-AC-A23H-01 | Breast | breast invasive carcinoma | Female | >=65 | I/II | Unknown | Unknown | PD | |
| PDE10A | SNV | Missense_Mutation | c.1811A>T | p.Gln604Leu | p.Q604L | Q9Y233 | protein_coding | deleterious(0) | probably_damaging(0.97) | TCGA-AR-A24Z-01 | Breast | breast invasive carcinoma | Female | <65 | I/II | Chemotherapy | doxorubicin | SD | |
| PDE10A | SNV | Missense_Mutation | c.634N>A | p.Gly212Ser | p.G212S | Q9Y233 | protein_coding | deleterious(0.01) | possibly_damaging(0.514) | TCGA-C8-A26Y-01 | Breast | breast invasive carcinoma | Female | >=65 | I/II | Unknown | Unknown | SD | |
| PDE10A | SNV | Missense_Mutation | c.1892N>C | p.Ile631Thr | p.I631T | Q9Y233 | protein_coding | deleterious(0.04) | benign(0.384) | TCGA-E9-A1RF-01 | Breast | breast invasive carcinoma | Female | >=65 | III/IV | Hormone Therapy | tamoxiphen | SD | |
| PDE10A | SNV | Missense_Mutation | novel | c.1699N>T | p.His567Tyr | p.H567Y | Q9Y233 | protein_coding | deleterious(0) | probably_damaging(0.997) | TCGA-E9-A3Q9-01 | Breast | breast invasive carcinoma | Female | >=65 | III/IV | Chemotherapy | cyclophosphane | CR |
| PDE10A | SNV | Missense_Mutation | c.1169G>C | p.Gly390Ala | p.G390A | Q9Y233 | protein_coding | deleterious(0.04) | probably_damaging(0.999) | TCGA-EW-A1PB-01 | Breast | breast invasive carcinoma | Female | >=65 | III/IV | Unknown | Unknown | SD | |
| PDE10A | insertion | Nonsense_Mutation | novel | c.2340_2341insAGAGAAGCAAACATGTAGGAAAAAATATAAATCAGC | p.Val780_Ala781insArgGluAlaAsnMetTerGluLysIleTerIleSer | p.V780_A781insREANM*EKI*IS | Q9Y233 | protein_coding | TCGA-A8-A06P-01 | Breast | breast invasive carcinoma | Female | <65 | III/IV | Unspecific | SD | |||
| PDE10A | insertion | Nonsense_Mutation | novel | c.273_274insCATGTCCTAAAAACAAGTGTATCCTTCTAAA | p.Ile92HisfsTer10 | p.I92Hfs*10 | Q9Y233 | protein_coding | TCGA-AR-A0U0-01 | Breast | breast invasive carcinoma | Female | >=65 | I/II | Unknown | Unknown | SD |
| Page: 1 2 3 4 5 6 7 8 9 10 11 12 13 14 15 16 17 |
Top |
Related drugs of malignant transformation related genes |
| Identification of chemicals and drugs interact with genes involved in malignant transfromation |
| (DGIdb 4.0) |
| Entrez ID | Symbol | Category | Interaction Types | Drug Claim Name | Drug Name | PMIDs |
| 10846 | PDE10A | ENZYME, DRUGGABLE GENOME | PMID27321640-Compound-58 | |||
| 10846 | PDE10A | ENZYME, DRUGGABLE GENOME | 1-aryl-4-methyl-[1,2,4]triazolo[4,3-a]quinoxaline derivative 6 | |||
| 10846 | PDE10A | ENZYME, DRUGGABLE GENOME | Imidazo[5,1-c][1,2,4]benzotriazine derivative 2 | |||
| 10846 | PDE10A | ENZYME, DRUGGABLE GENOME | PMID27321640-Compound-59 | |||
| 10846 | PDE10A | ENZYME, DRUGGABLE GENOME | Triazolo-pyridine derivative 6 | |||
| 10846 | PDE10A | ENZYME, DRUGGABLE GENOME | inhibitor | CHEMBL932 | DIPYRIDAMOLE | |
| 10846 | PDE10A | ENZYME, DRUGGABLE GENOME | Triazolo-pyridine derivative 3 | |||
| 10846 | PDE10A | ENZYME, DRUGGABLE GENOME | Pyrido[1,2,4]triazolo[4,3-a]pyrazine derivative 2 | |||
| 10846 | PDE10A | ENZYME, DRUGGABLE GENOME | 1-aryl-4-methyl-[1,2,4]triazolo[4,3-a]quinoxaline derivative 4 | |||
| 10846 | PDE10A | ENZYME, DRUGGABLE GENOME | Pyrido[1,2,4]triazolo[4,3-a]pyrazine derivative 1 |
| Page: 1 2 3 4 5 |

Copyright 2023-Present -The University of Texas Health Science Center at Houston |