
|
|||||
|
 | |
| |
| |
| |
| |
| |
|
Gene: PDDC1 |
Gene summary for PDDC1 |
| Gene information | Species | Human | Gene symbol | PDDC1 | Gene ID | 347862 |
| Gene name | glutamine amidotransferase class 1 domain containing 1 | |
| Gene Alias | PDDC1 | |
| Cytomap | 11p15.5 | |
| Gene Type | protein-coding | GO ID | GO:0008150 | UniProtAcc | B7Z1J9 |
Top |
Malignant transformation analysis |
| Identification of the aberrant gene expression in precancerous and cancerous lesions by comparing the gene expression of stem-like cells in diseased tissues with normal stem cells |
| Entrez ID | Symbol | Replicates | Species | Organ | Tissue | Adj P-value | Log2FC | Malignancy |
| 347862 | PDDC1 | HCC1_Meng | Human | Liver | HCC | 5.76e-32 | 1.86e-02 | 0.0246 |
| 347862 | PDDC1 | HCC2_Meng | Human | Liver | HCC | 2.26e-05 | 2.35e-02 | 0.0107 |
| 347862 | PDDC1 | HCC1 | Human | Liver | HCC | 2.98e-21 | 2.74e+00 | 0.5336 |
| 347862 | PDDC1 | HCC2 | Human | Liver | HCC | 3.33e-33 | 3.32e+00 | 0.5341 |
| 347862 | PDDC1 | HCC5 | Human | Liver | HCC | 5.42e-33 | 2.37e+00 | 0.4932 |
| 347862 | PDDC1 | P1_cSCC | Human | Skin | cSCC | 2.89e-15 | 4.32e-01 | 0.0292 |
| 347862 | PDDC1 | P2_cSCC | Human | Skin | cSCC | 3.46e-04 | 1.86e-01 | -0.024 |
| 347862 | PDDC1 | P4_cSCC | Human | Skin | cSCC | 2.13e-06 | 1.75e-01 | -0.00290000000000005 |
| 347862 | PDDC1 | P10_cSCC | Human | Skin | cSCC | 6.70e-17 | 3.66e-01 | 0.1017 |
| Page: 1 |
| Tissue | Expression Dynamics | Abbreviation |
| Liver | 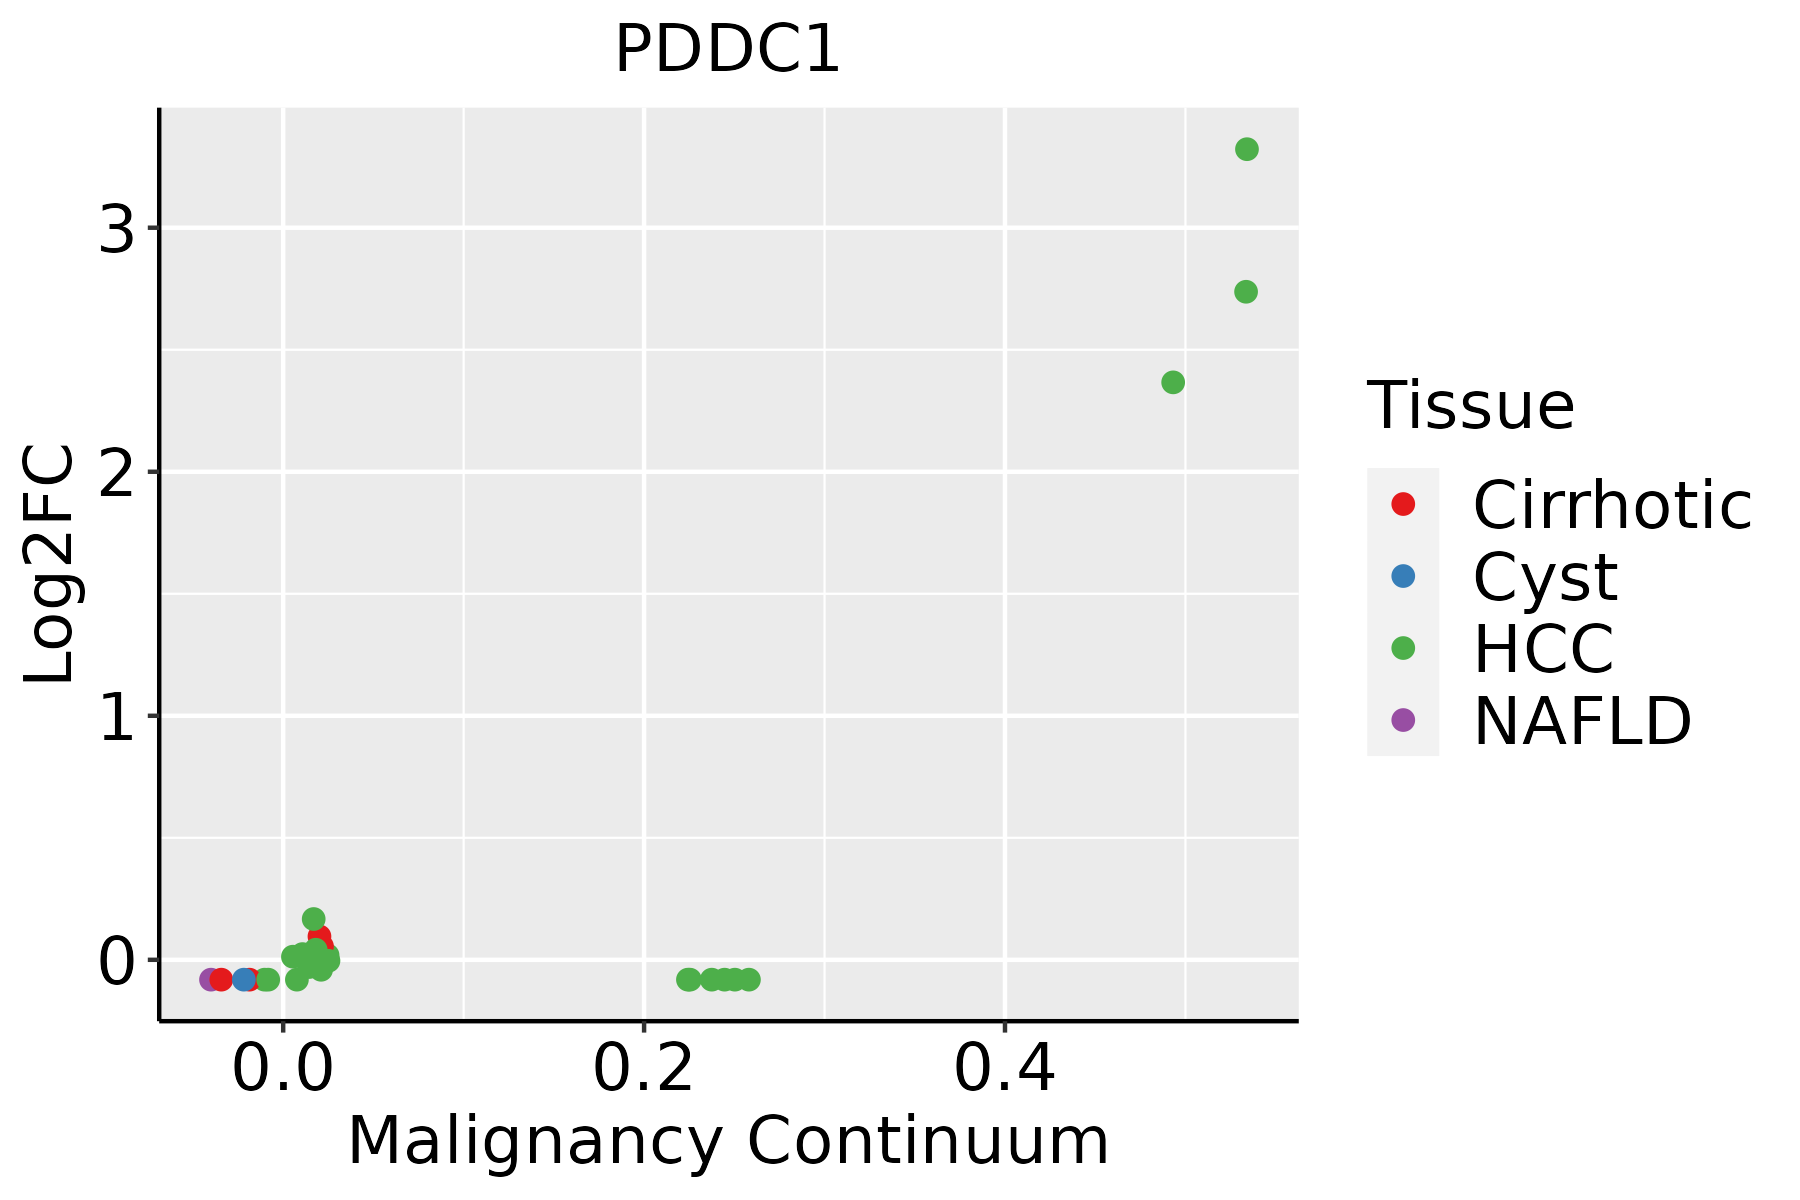 | HCC: Hepatocellular carcinoma |
| NAFLD: Non-alcoholic fatty liver disease | ||
| Skin | 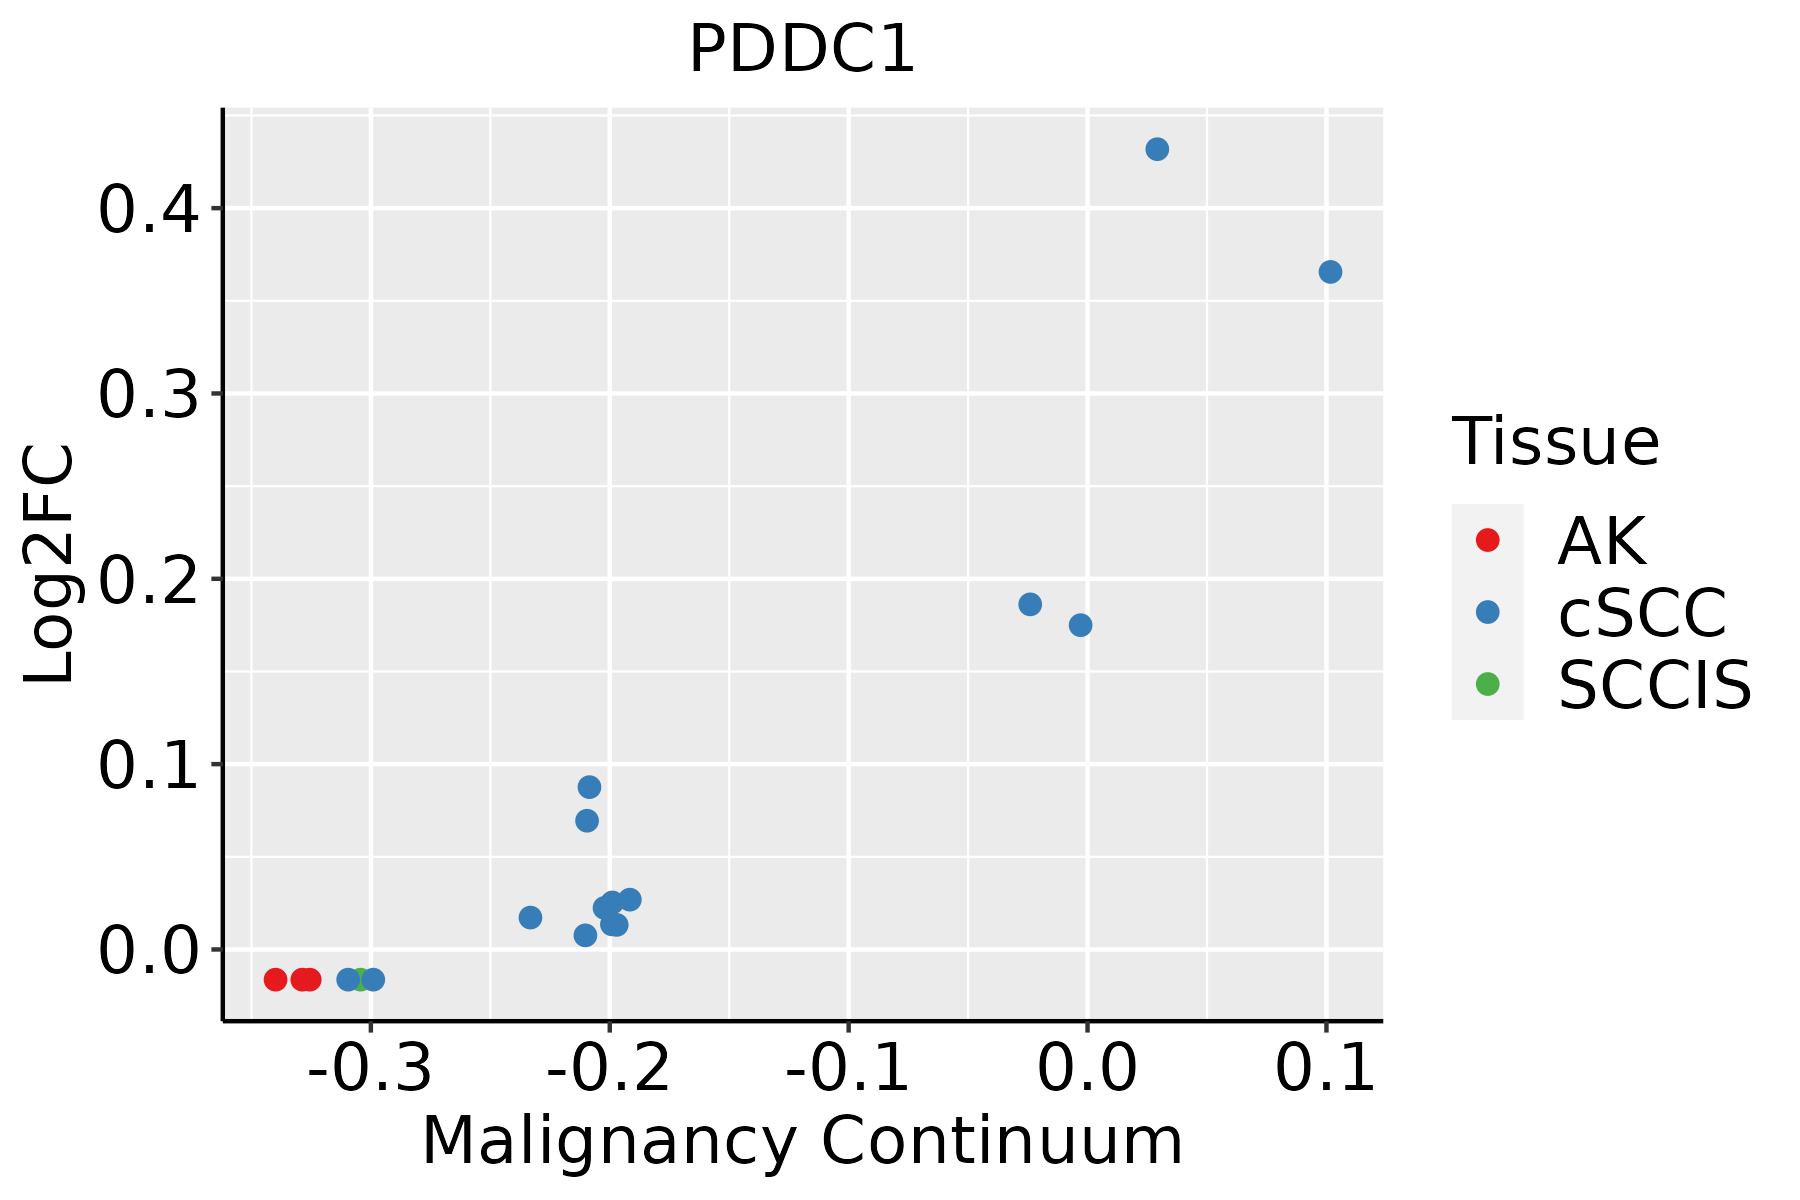 | AK: Actinic keratosis |
| cSCC: Cutaneous squamous cell carcinoma | ||
| SCCIS:squamous cell carcinoma in situ |
| ∗log2FC in expression of this searched gene in stem-like cells from each diseased tissue sample relative to stem-like cells in normal samples in each tissue plotted against the malignancy continuum. Samples are colored based on if they are from different disease stage. |
Top |
Malignant transformation related pathway analysis |
| Find out the enriched GO biological processes and KEGG pathways involved in transition from healthy to precancer to cancer |
| Tissue | Disease Stage | Enriched GO biological Processes |
| Colorectum | AD |  |
| Colorectum | SER |  |
| Colorectum | MSS |  |
| Colorectum | MSI-H |  |
| Colorectum | FAP |  |
| ∗Top 15 enriched GO BP terms are showed in the bar plot of each disease state in each tissue. Each row represents a significant GO biological process which is colored according to the -log10(p.adjust). |
| Page: 1 2 3 4 5 6 7 8 9 |
| GO ID | Tissue | Disease Stage | Description | Gene Ratio | Bg Ratio | pvalue | p.adjust | Count |
| Page: 1 |
| Pathway ID | Tissue | Disease Stage | Description | Gene Ratio | Bg Ratio | pvalue | p.adjust | qvalue | Count |
| Page: 1 |
Top |
Cell-cell communication analysis |
| Identification of potential cell-cell interactions between two cell types and their ligand-receptor pairs for different disease states |
| Ligand | Receptor | LRpair | Pathway | Tissue | Disease Stage |
| Page: 1 |
Top |
Single-cell gene regulatory network inference analysis |
| Find out the significant the regulons (TFs) and the target genes of each regulon across cell types for different disease states |
| TF | Cell Type | Tissue | Disease Stage | Target Gene | RSS | Regulon Activity |
| ∗The dot plots of a searched regulon are shown for all cell subpopulations in each disease state of each tissue based on the regulon specific score inferred using pySCENIC and by calculating the average expression. |
| Page: 1 |
Top |
Somatic mutation of malignant transformation related genes |
| Annotation of somatic variants for genes involved in malignant transformation |
| Hugo Symbol | Variant Class | Variant Classification | dbSNP RS | HGVSc | HGVSp | HGVSp Short | SWISSPROT | BIOTYPE | SIFT | PolyPhen | Tumor Sample Barcode | Tissue | Histology | Sex | Age | Stage | Therapy Types | Drugs | Outcome |
| PDDC1 | SNV | Missense_Mutation | novel | c.212N>T | p.Ala71Val | p.A71V | Q8NB37 | protein_coding | tolerated(0.08) | benign(0.02) | TCGA-2W-A8YY-01 | Cervix | cervical & endocervical cancer | Female | <65 | I/II | Chemotherapy | cisplatin | CR |
| PDDC1 | SNV | Missense_Mutation | rs758640162 | c.580N>T | p.Arg194Cys | p.R194C | Q8NB37 | protein_coding | deleterious(0) | probably_damaging(0.999) | TCGA-VS-A9UZ-01 | Cervix | cervical & endocervical cancer | Female | <65 | I/II | Unknown | Unknown | SD |
| PDDC1 | SNV | Missense_Mutation | c.623N>T | p.Ala208Val | p.A208V | Q8NB37 | protein_coding | deleterious(0) | probably_damaging(0.981) | TCGA-G4-6588-01 | Colorectum | colon adenocarcinoma | Female | <65 | I/II | Unknown | Unknown | SD | |
| PDDC1 | SNV | Missense_Mutation | c.571N>A | p.Val191Met | p.V191M | Q8NB37 | protein_coding | deleterious(0) | probably_damaging(0.997) | TCGA-WS-AB45-01 | Colorectum | colon adenocarcinoma | Female | <65 | I/II | Unknown | Unknown | SD | |
| PDDC1 | SNV | Missense_Mutation | novel | c.579C>A | p.Asp193Glu | p.D193E | Q8NB37 | protein_coding | deleterious(0) | probably_damaging(1) | TCGA-A5-A0G1-01 | Endometrium | uterine corpus endometrioid carcinoma | Female | >=65 | I/II | Unknown | Unknown | SD |
| PDDC1 | SNV | Missense_Mutation | c.158T>G | p.Phe53Cys | p.F53C | Q8NB37 | protein_coding | deleterious(0) | probably_damaging(0.935) | TCGA-AX-A0J0-01 | Endometrium | uterine corpus endometrioid carcinoma | Female | <65 | I/II | Unknown | Unknown | SD | |
| PDDC1 | SNV | Missense_Mutation | novel | c.473G>T | p.Arg158Met | p.R158M | Q8NB37 | protein_coding | deleterious(0) | possibly_damaging(0.907) | TCGA-BG-A2L7-01 | Endometrium | uterine corpus endometrioid carcinoma | Female | >=65 | I/II | Chemotherapy | carboplatin | CR |
| PDDC1 | SNV | Missense_Mutation | novel | c.646N>G | p.Cys216Gly | p.C216G | Q8NB37 | protein_coding | tolerated(0.06) | benign(0.176) | TCGA-FI-A2F4-01 | Endometrium | uterine corpus endometrioid carcinoma | Female | <65 | I/II | Unknown | Unknown | SD |
| PDDC1 | SNV | Missense_Mutation | c.344N>T | p.His115Leu | p.H115L | Q8NB37 | protein_coding | tolerated(0.66) | benign(0) | TCGA-55-A494-01 | Lung | lung adenocarcinoma | Female | <65 | I/II | Unknown | Unknown | SD | |
| PDDC1 | SNV | Missense_Mutation | c.275C>G | p.Pro92Arg | p.P92R | Q8NB37 | protein_coding | deleterious(0) | probably_damaging(0.982) | TCGA-69-7765-01 | Lung | lung adenocarcinoma | Male | <65 | III/IV | Chemotherapy | carboplatin | SD |
| Page: 1 2 |
Top |
Related drugs of malignant transformation related genes |
| Identification of chemicals and drugs interact with genes involved in malignant transfromation |
| (DGIdb 4.0) |
| Entrez ID | Symbol | Category | Interaction Types | Drug Claim Name | Drug Name | PMIDs |
| Page: 1 |

Copyright 2023-Present -The University of Texas Health Science Center at Houston |