
|
|||||
|
 | |
| |
| |
| |
| |
| |
|
Gene: PDCL3 |
Gene summary for PDCL3 |
| Gene information | Species | Human | Gene symbol | PDCL3 | Gene ID | 79031 |
| Gene name | phosducin like 3 | |
| Gene Alias | HTPHLP | |
| Cytomap | 2q11.2 | |
| Gene Type | protein-coding | GO ID | GO:0001525 | UniProtAcc | Q9H2J4 |
Top |
Malignant transformation analysis |
| Identification of the aberrant gene expression in precancerous and cancerous lesions by comparing the gene expression of stem-like cells in diseased tissues with normal stem cells |
| Entrez ID | Symbol | Replicates | Species | Organ | Tissue | Adj P-value | Log2FC | Malignancy |
| 79031 | PDCL3 | LZE2T | Human | Esophagus | ESCC | 4.49e-03 | 7.05e-01 | 0.082 |
| 79031 | PDCL3 | LZE4T | Human | Esophagus | ESCC | 4.51e-23 | 6.32e-01 | 0.0811 |
| 79031 | PDCL3 | LZE7T | Human | Esophagus | ESCC | 5.00e-12 | 7.34e-01 | 0.0667 |
| 79031 | PDCL3 | LZE8T | Human | Esophagus | ESCC | 5.87e-12 | 2.15e-01 | 0.067 |
| 79031 | PDCL3 | LZE20T | Human | Esophagus | ESCC | 1.25e-08 | 2.69e-01 | 0.0662 |
| 79031 | PDCL3 | LZE21D1 | Human | Esophagus | HGIN | 2.41e-02 | 1.85e-01 | 0.0632 |
| 79031 | PDCL3 | LZE22T | Human | Esophagus | ESCC | 1.51e-04 | 4.50e-01 | 0.068 |
| 79031 | PDCL3 | LZE24D1 | Human | Esophagus | HGIN | 3.32e-02 | 3.74e-01 | 0.054 |
| 79031 | PDCL3 | LZE24T | Human | Esophagus | ESCC | 5.28e-15 | 4.60e-01 | 0.0596 |
| 79031 | PDCL3 | LZE21T | Human | Esophagus | ESCC | 2.96e-03 | 3.78e-01 | 0.0655 |
| 79031 | PDCL3 | LZE6T | Human | Esophagus | ESCC | 8.05e-18 | 7.03e-01 | 0.0845 |
| 79031 | PDCL3 | P1T-E | Human | Esophagus | ESCC | 4.26e-08 | 5.58e-01 | 0.0875 |
| 79031 | PDCL3 | P2T-E | Human | Esophagus | ESCC | 1.19e-41 | 7.91e-01 | 0.1177 |
| 79031 | PDCL3 | P4T-E | Human | Esophagus | ESCC | 1.89e-49 | 1.07e+00 | 0.1323 |
| 79031 | PDCL3 | P5T-E | Human | Esophagus | ESCC | 1.31e-37 | 7.71e-01 | 0.1327 |
| 79031 | PDCL3 | P8T-E | Human | Esophagus | ESCC | 1.67e-25 | 5.29e-01 | 0.0889 |
| 79031 | PDCL3 | P9T-E | Human | Esophagus | ESCC | 4.17e-36 | 8.11e-01 | 0.1131 |
| 79031 | PDCL3 | P10T-E | Human | Esophagus | ESCC | 1.45e-48 | 8.38e-01 | 0.116 |
| 79031 | PDCL3 | P11T-E | Human | Esophagus | ESCC | 7.87e-20 | 1.17e+00 | 0.1426 |
| 79031 | PDCL3 | P12T-E | Human | Esophagus | ESCC | 3.58e-51 | 8.79e-01 | 0.1122 |
| Page: 1 2 3 4 5 6 |
| Tissue | Expression Dynamics | Abbreviation |
| Esophagus | 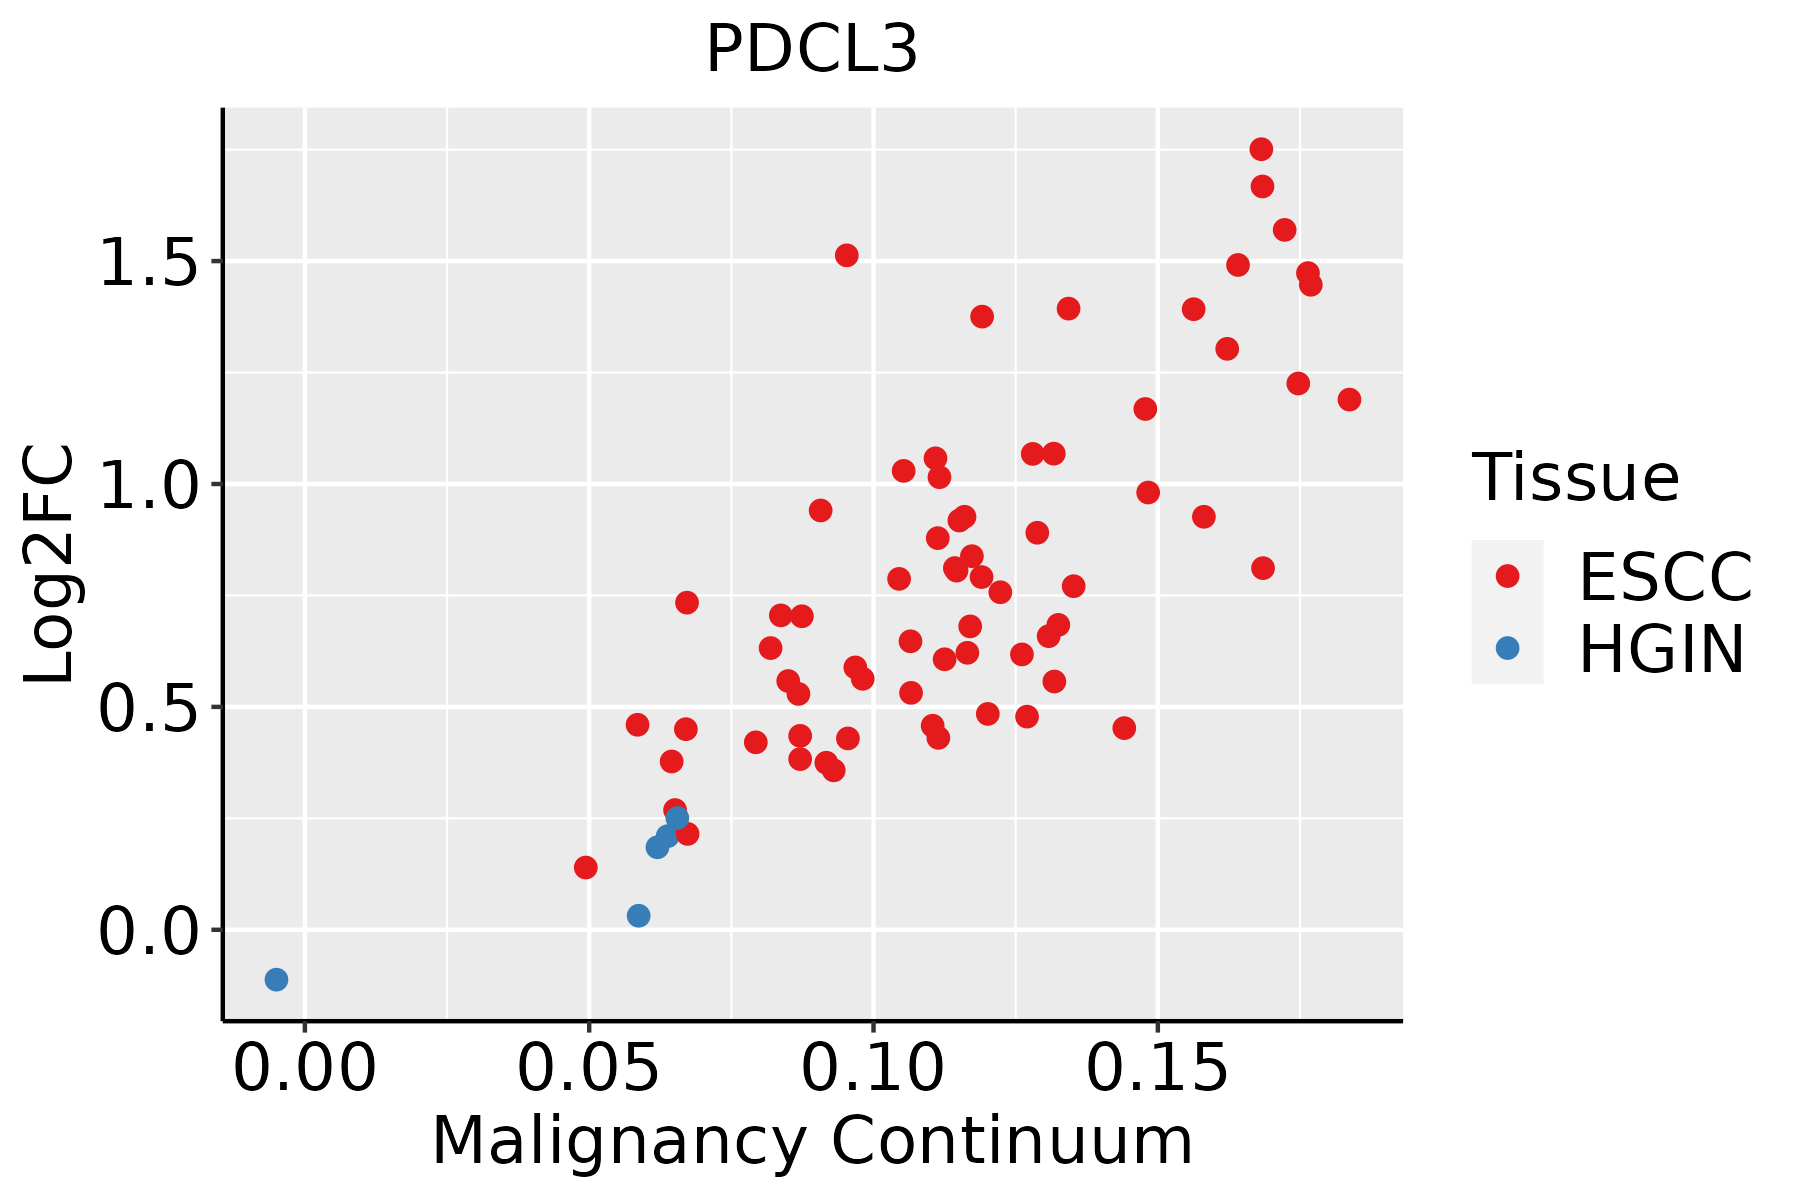 | ESCC: Esophageal squamous cell carcinoma |
| HGIN: High-grade intraepithelial neoplasias | ||
| LGIN: Low-grade intraepithelial neoplasias | ||
| Liver |  | HCC: Hepatocellular carcinoma |
| NAFLD: Non-alcoholic fatty liver disease | ||
| Oral Cavity | 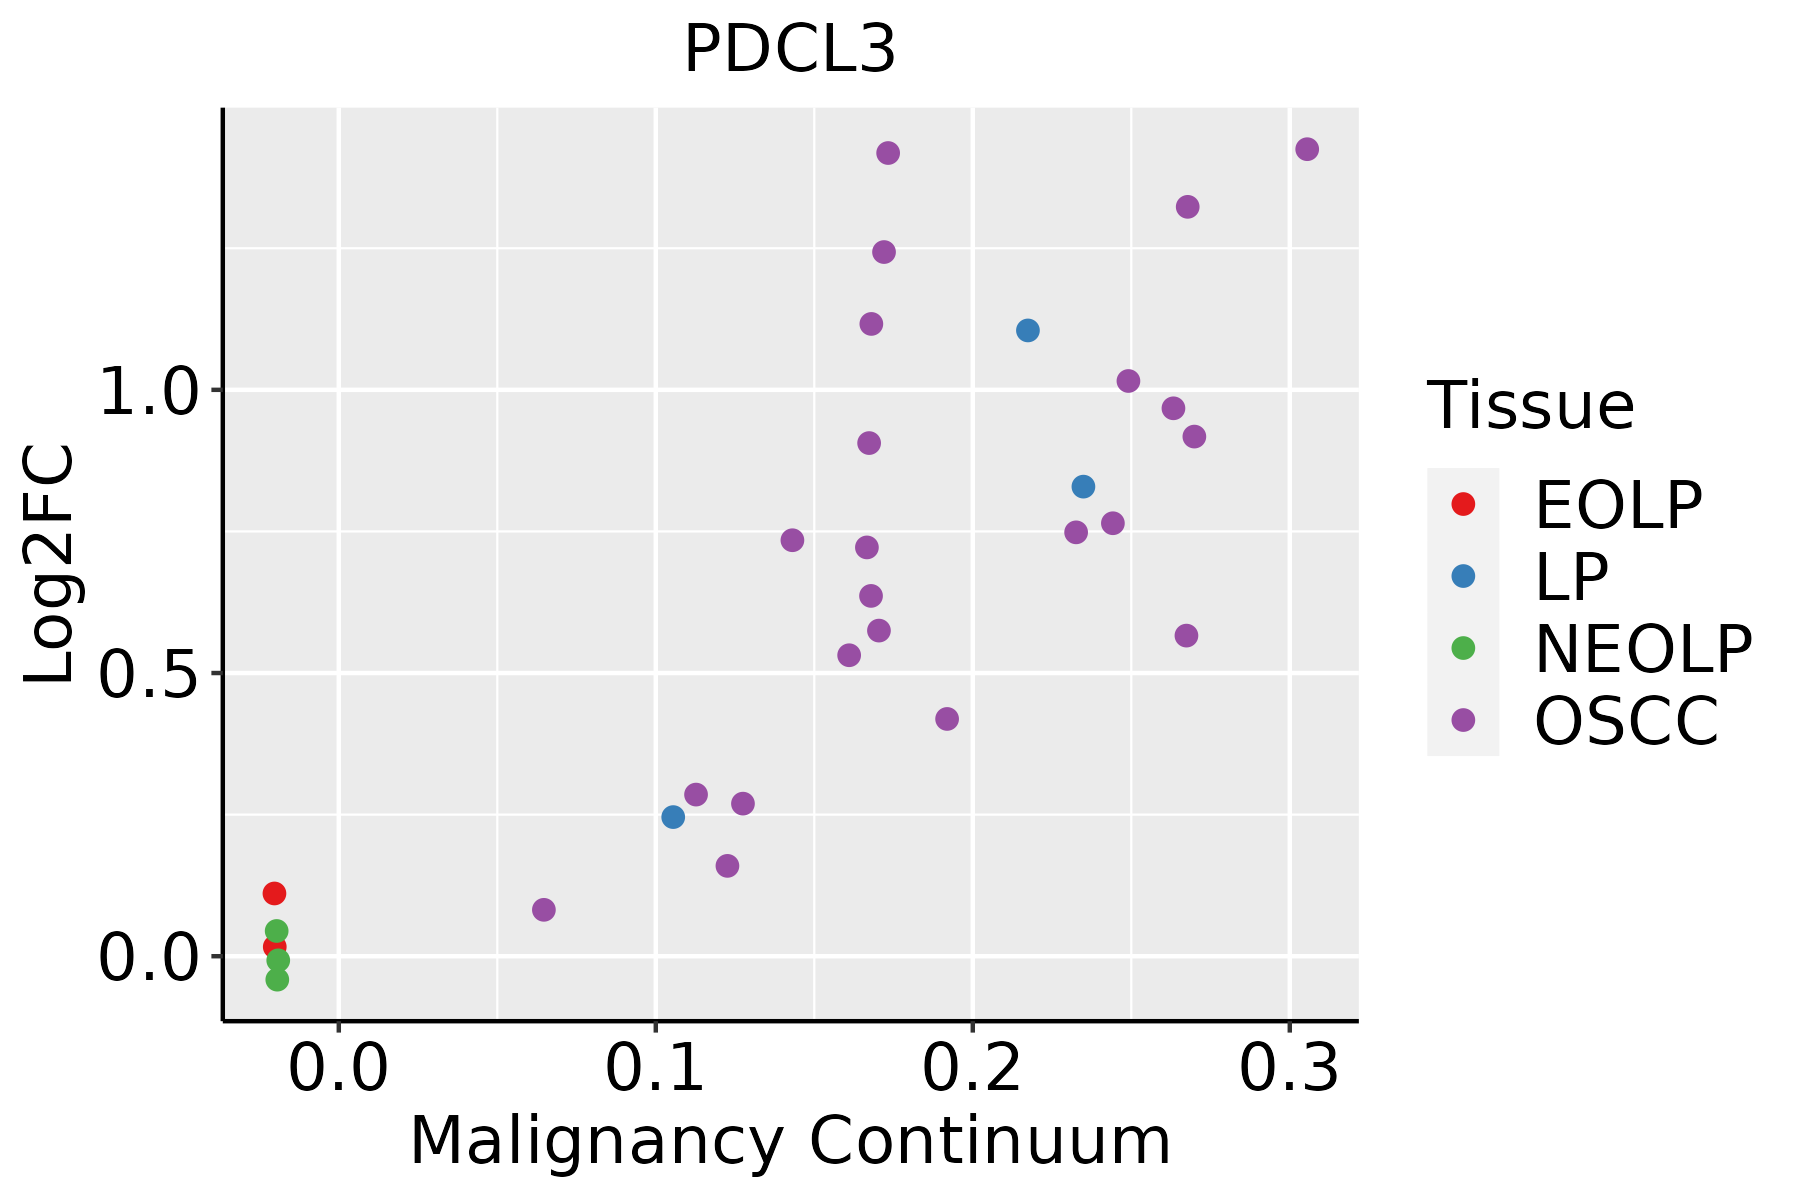 | EOLP: Erosive Oral lichen planus |
| LP: leukoplakia | ||
| NEOLP: Non-erosive oral lichen planus | ||
| OSCC: Oral squamous cell carcinoma | ||
| Skin |  | AK: Actinic keratosis |
| cSCC: Cutaneous squamous cell carcinoma | ||
| SCCIS:squamous cell carcinoma in situ |
| ∗log2FC in expression of this searched gene in stem-like cells from each diseased tissue sample relative to stem-like cells in normal samples in each tissue plotted against the malignancy continuum. Samples are colored based on if they are from different disease stage. |
Top |
Malignant transformation related pathway analysis |
| Find out the enriched GO biological processes and KEGG pathways involved in transition from healthy to precancer to cancer |
| Tissue | Disease Stage | Enriched GO biological Processes |
| Colorectum | AD |  |
| Colorectum | SER |  |
| Colorectum | MSS |  |
| Colorectum | MSI-H |  |
| Colorectum | FAP |  |
| ∗Top 15 enriched GO BP terms are showed in the bar plot of each disease state in each tissue. Each row represents a significant GO biological process which is colored according to the -log10(p.adjust). |
| Page: 1 2 3 4 5 6 7 8 9 |
| GO ID | Tissue | Disease Stage | Description | Gene Ratio | Bg Ratio | pvalue | p.adjust | Count |
| GO:004217627 | Esophagus | HGIN | regulation of protein catabolic process | 119/2587 | 391/18723 | 8.09e-18 | 2.43e-15 | 119 |
| GO:003164727 | Esophagus | HGIN | regulation of protein stability | 96/2587 | 298/18723 | 2.21e-16 | 5.76e-14 | 96 |
| GO:000645720 | Esophagus | HGIN | protein folding | 75/2587 | 212/18723 | 1.61e-15 | 3.86e-13 | 75 |
| GO:190336227 | Esophagus | HGIN | regulation of cellular protein catabolic process | 81/2587 | 255/18723 | 1.16e-13 | 1.93e-11 | 81 |
| GO:005082127 | Esophagus | HGIN | protein stabilization | 64/2587 | 191/18723 | 3.11e-12 | 4.24e-10 | 64 |
| GO:190305027 | Esophagus | HGIN | regulation of proteolysis involved in cellular protein catabolic process | 70/2587 | 221/18723 | 6.21e-12 | 7.76e-10 | 70 |
| GO:000989520 | Esophagus | HGIN | negative regulation of catabolic process | 87/2587 | 320/18723 | 1.74e-10 | 1.68e-08 | 87 |
| GO:003133026 | Esophagus | HGIN | negative regulation of cellular catabolic process | 74/2587 | 262/18723 | 6.27e-10 | 5.30e-08 | 74 |
| GO:200005827 | Esophagus | HGIN | regulation of ubiquitin-dependent protein catabolic process | 53/2587 | 164/18723 | 9.89e-10 | 8.13e-08 | 53 |
| GO:003460520 | Esophagus | HGIN | cellular response to heat | 30/2587 | 69/18723 | 1.78e-09 | 1.35e-07 | 30 |
| GO:006107720 | Esophagus | HGIN | chaperone-mediated protein folding | 27/2587 | 67/18723 | 7.99e-08 | 4.20e-06 | 27 |
| GO:004217720 | Esophagus | HGIN | negative regulation of protein catabolic process | 37/2587 | 121/18723 | 1.47e-06 | 5.56e-05 | 37 |
| GO:000940819 | Esophagus | HGIN | response to heat | 34/2587 | 110/18723 | 2.94e-06 | 1.01e-04 | 34 |
| GO:000926618 | Esophagus | HGIN | response to temperature stimulus | 42/2587 | 178/18723 | 2.91e-04 | 4.98e-03 | 42 |
| GO:190336319 | Esophagus | HGIN | negative regulation of cellular protein catabolic process | 22/2587 | 75/18723 | 3.62e-04 | 5.68e-03 | 22 |
| GO:200005920 | Esophagus | HGIN | negative regulation of ubiquitin-dependent protein catabolic process | 16/2587 | 48/18723 | 4.73e-04 | 6.93e-03 | 16 |
| GO:190305119 | Esophagus | HGIN | negative regulation of proteolysis involved in cellular protein catabolic process | 18/2587 | 64/18723 | 2.03e-03 | 2.13e-02 | 18 |
| GO:004586126 | Esophagus | HGIN | negative regulation of proteolysis | 68/2587 | 351/18723 | 2.21e-03 | 2.28e-02 | 68 |
| GO:0042176111 | Esophagus | ESCC | regulation of protein catabolic process | 280/8552 | 391/18723 | 8.65e-26 | 2.39e-23 | 280 |
| GO:0031647111 | Esophagus | ESCC | regulation of protein stability | 223/8552 | 298/18723 | 5.76e-25 | 1.52e-22 | 223 |
| Page: 1 2 3 4 5 6 7 8 |
| Pathway ID | Tissue | Disease Stage | Description | Gene Ratio | Bg Ratio | pvalue | p.adjust | qvalue | Count |
| Page: 1 |
Top |
Cell-cell communication analysis |
| Identification of potential cell-cell interactions between two cell types and their ligand-receptor pairs for different disease states |
| Ligand | Receptor | LRpair | Pathway | Tissue | Disease Stage |
| Page: 1 |
Top |
Single-cell gene regulatory network inference analysis |
| Find out the significant the regulons (TFs) and the target genes of each regulon across cell types for different disease states |
| TF | Cell Type | Tissue | Disease Stage | Target Gene | RSS | Regulon Activity |
| ∗The dot plots of a searched regulon are shown for all cell subpopulations in each disease state of each tissue based on the regulon specific score inferred using pySCENIC and by calculating the average expression. |
| Page: 1 |
Top |
Somatic mutation of malignant transformation related genes |
| Annotation of somatic variants for genes involved in malignant transformation |
| Hugo Symbol | Variant Class | Variant Classification | dbSNP RS | HGVSc | HGVSp | HGVSp Short | SWISSPROT | BIOTYPE | SIFT | PolyPhen | Tumor Sample Barcode | Tissue | Histology | Sex | Age | Stage | Therapy Types | Drugs | Outcome |
| PDCL3 | SNV | Missense_Mutation | novel | c.574N>C | p.Asp192His | p.D192H | Q9H2J4 | protein_coding | deleterious(0) | probably_damaging(0.963) | TCGA-A2-A0CR-01 | Breast | breast invasive carcinoma | Female | <65 | I/II | Chemotherapy | adriamycin | CR |
| PDCL3 | SNV | Missense_Mutation | c.517N>C | p.Asp173His | p.D173H | Q9H2J4 | protein_coding | deleterious(0.03) | possibly_damaging(0.894) | TCGA-AC-A23H-01 | Breast | breast invasive carcinoma | Female | >=65 | I/II | Unknown | Unknown | PD | |
| PDCL3 | SNV | Missense_Mutation | c.478N>C | p.Asp160His | p.D160H | Q9H2J4 | protein_coding | deleterious(0) | probably_damaging(1) | TCGA-BH-A1EV-01 | Breast | breast invasive carcinoma | Female | <65 | III/IV | Unknown | Unknown | PD | |
| PDCL3 | SNV | Missense_Mutation | novel | c.181N>C | p.Asp61His | p.D61H | Q9H2J4 | protein_coding | deleterious(0) | probably_damaging(1) | TCGA-C8-A8HQ-01 | Breast | breast invasive carcinoma | Female | <65 | I/II | Unknown | Unknown | SD |
| PDCL3 | SNV | Missense_Mutation | novel | c.241N>A | p.Glu81Lys | p.E81K | Q9H2J4 | protein_coding | deleterious(0) | benign(0.034) | TCGA-MY-A5BE-01 | Cervix | cervical & endocervical cancer | Female | <65 | I/II | Unknown | Unknown | SD |
| PDCL3 | SNV | Missense_Mutation | novel | c.572N>A | p.Arg191Lys | p.R191K | Q9H2J4 | protein_coding | tolerated(0.89) | benign(0.001) | TCGA-VS-A8EL-01 | Cervix | cervical & endocervical cancer | Female | <65 | I/II | Chemotherapy | cisplatin | CR |
| PDCL3 | SNV | Missense_Mutation | rs750858703 | c.44N>A | p.Arg15His | p.R15H | Q9H2J4 | protein_coding | deleterious(0.02) | benign(0.024) | TCGA-A6-6654-01 | Colorectum | colon adenocarcinoma | Female | >=65 | III/IV | Chemotherapy | oxaliplatin | SD |
| PDCL3 | SNV | Missense_Mutation | rs771734941 | c.673N>T | p.Arg225Trp | p.R225W | Q9H2J4 | protein_coding | tolerated(0.06) | benign(0.035) | TCGA-AA-3492-01 | Colorectum | colon adenocarcinoma | Female | >=65 | I/II | Unknown | Unknown | SD |
| PDCL3 | SNV | Missense_Mutation | rs763398924 | c.227N>A | p.Arg76Gln | p.R76Q | Q9H2J4 | protein_coding | tolerated(1) | benign(0.003) | TCGA-AA-3930-01 | Colorectum | colon adenocarcinoma | Male | >=65 | III/IV | Chemotherapy | capecitabine | PD |
| PDCL3 | SNV | Missense_Mutation | c.588N>T | p.Trp196Cys | p.W196C | Q9H2J4 | protein_coding | deleterious(0) | probably_damaging(0.987) | TCGA-AA-A022-01 | Colorectum | colon adenocarcinoma | Female | >=65 | I/II | Unknown | Unknown | SD |
| Page: 1 2 3 4 |
Top |
Related drugs of malignant transformation related genes |
| Identification of chemicals and drugs interact with genes involved in malignant transfromation |
| (DGIdb 4.0) |
| Entrez ID | Symbol | Category | Interaction Types | Drug Claim Name | Drug Name | PMIDs |
| Page: 1 |

Copyright 2023-Present -The University of Texas Health Science Center at Houston |