
|
|||||
|
 | |
| |
| |
| |
| |
| |
|
Gene: PDCD4 |
Gene summary for PDCD4 |
| Gene information | Species | Human | Gene symbol | PDCD4 | Gene ID | 27250 |
| Gene name | programmed cell death 4 | |
| Gene Alias | H731 | |
| Cytomap | 10q25.2 | |
| Gene Type | protein-coding | GO ID | GO:0000165 | UniProtAcc | B4DKX4 |
Top |
Malignant transformation analysis |
| Identification of the aberrant gene expression in precancerous and cancerous lesions by comparing the gene expression of stem-like cells in diseased tissues with normal stem cells |
| Entrez ID | Symbol | Replicates | Species | Organ | Tissue | Adj P-value | Log2FC | Malignancy |
| 27250 | PDCD4 | GSM4909293 | Human | Breast | IDC | 5.25e-16 | 4.16e-01 | 0.1581 |
| 27250 | PDCD4 | GSM4909294 | Human | Breast | IDC | 1.60e-02 | 1.41e-01 | 0.2022 |
| 27250 | PDCD4 | GSM4909296 | Human | Breast | IDC | 7.85e-04 | -1.72e-01 | 0.1524 |
| 27250 | PDCD4 | GSM4909297 | Human | Breast | IDC | 5.25e-15 | -1.33e-01 | 0.1517 |
| 27250 | PDCD4 | GSM4909299 | Human | Breast | IDC | 1.12e-02 | 2.58e-01 | 0.035 |
| 27250 | PDCD4 | GSM4909303 | Human | Breast | IDC | 2.67e-09 | 6.36e-01 | 0.0438 |
| 27250 | PDCD4 | GSM4909305 | Human | Breast | IDC | 3.31e-07 | 4.07e-01 | 0.0436 |
| 27250 | PDCD4 | GSM4909306 | Human | Breast | IDC | 2.70e-18 | 4.65e-01 | 0.1564 |
| 27250 | PDCD4 | GSM4909311 | Human | Breast | IDC | 1.12e-18 | -2.53e-01 | 0.1534 |
| 27250 | PDCD4 | GSM4909312 | Human | Breast | IDC | 2.14e-08 | 6.63e-02 | 0.1552 |
| 27250 | PDCD4 | GSM4909317 | Human | Breast | IDC | 4.22e-09 | 4.05e-01 | 0.1355 |
| 27250 | PDCD4 | GSM4909318 | Human | Breast | IDC | 6.46e-04 | 3.07e-01 | 0.2031 |
| 27250 | PDCD4 | GSM4909319 | Human | Breast | IDC | 3.65e-32 | -2.44e-01 | 0.1563 |
| 27250 | PDCD4 | GSM4909320 | Human | Breast | IDC | 1.48e-05 | -4.41e-01 | 0.1575 |
| 27250 | PDCD4 | GSM4909321 | Human | Breast | IDC | 1.89e-12 | -3.71e-01 | 0.1559 |
| 27250 | PDCD4 | brca10 | Human | Breast | Precancer | 1.25e-09 | -4.40e-01 | -0.0029 |
| 27250 | PDCD4 | NCCBC11 | Human | Breast | DCIS | 7.02e-25 | 9.95e-01 | 0.1232 |
| 27250 | PDCD4 | NCCBC14 | Human | Breast | DCIS | 5.84e-16 | 4.02e-01 | 0.2021 |
| 27250 | PDCD4 | NCCBC3 | Human | Breast | DCIS | 3.11e-05 | 2.18e-01 | 0.1198 |
| 27250 | PDCD4 | NCCBC5 | Human | Breast | DCIS | 8.63e-06 | 7.17e-02 | 0.2046 |
| Page: 1 2 3 4 5 6 7 8 9 10 11 12 |
| Tissue | Expression Dynamics | Abbreviation |
| Breast | 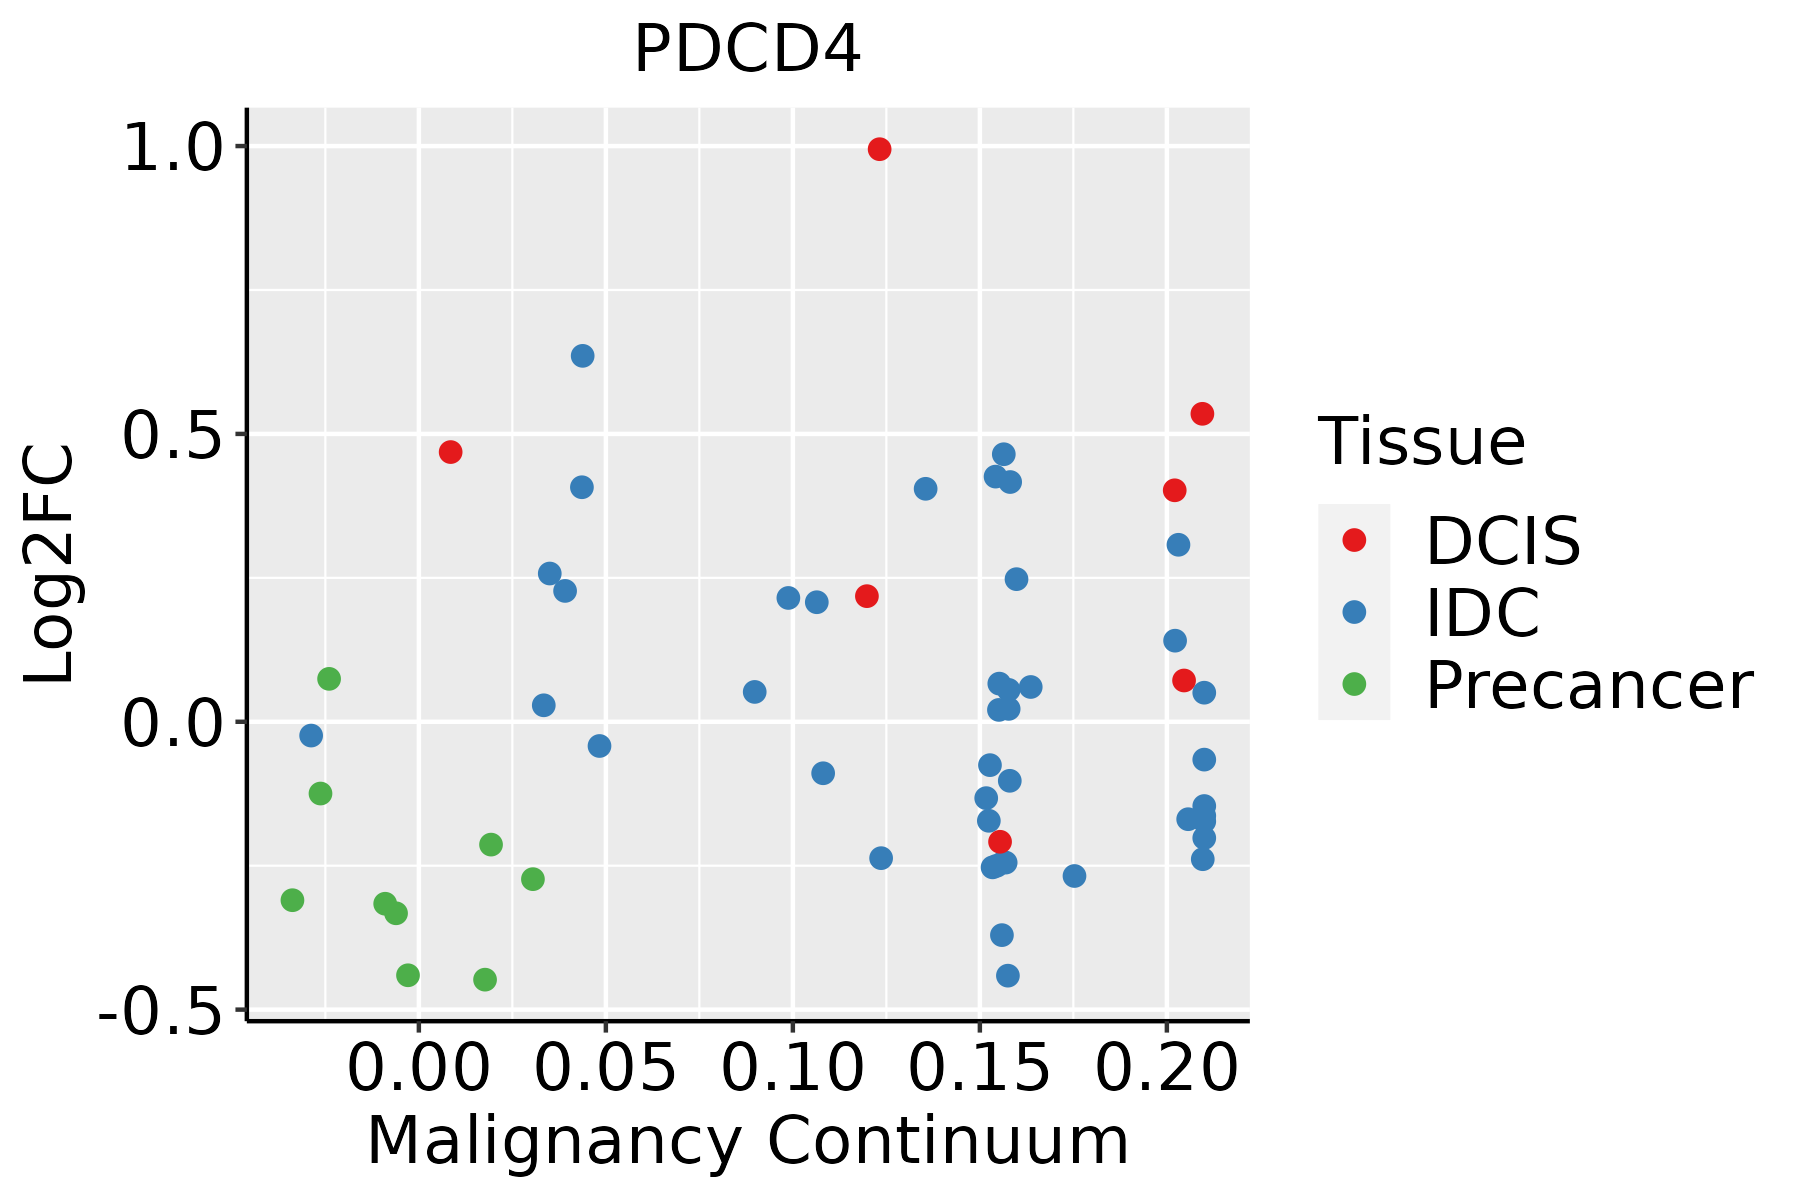 | IDC: Invasive ductal carcinoma |
| DCIS: Ductal carcinoma in situ | ||
| Precancer(BRCA1-mut): Precancerous lesion from BRCA1 mutation carriers | ||
| Colorectum (GSE201348) |  | FAP: Familial adenomatous polyposis |
| CRC: Colorectal cancer | ||
| Colorectum (HTA11) |  | AD: Adenomas |
| SER: Sessile serrated lesions | ||
| MSI-H: Microsatellite-high colorectal cancer | ||
| MSS: Microsatellite stable colorectal cancer | ||
| Endometrium |  | AEH: Atypical endometrial hyperplasia |
| EEC: Endometrioid Cancer | ||
| Esophagus | 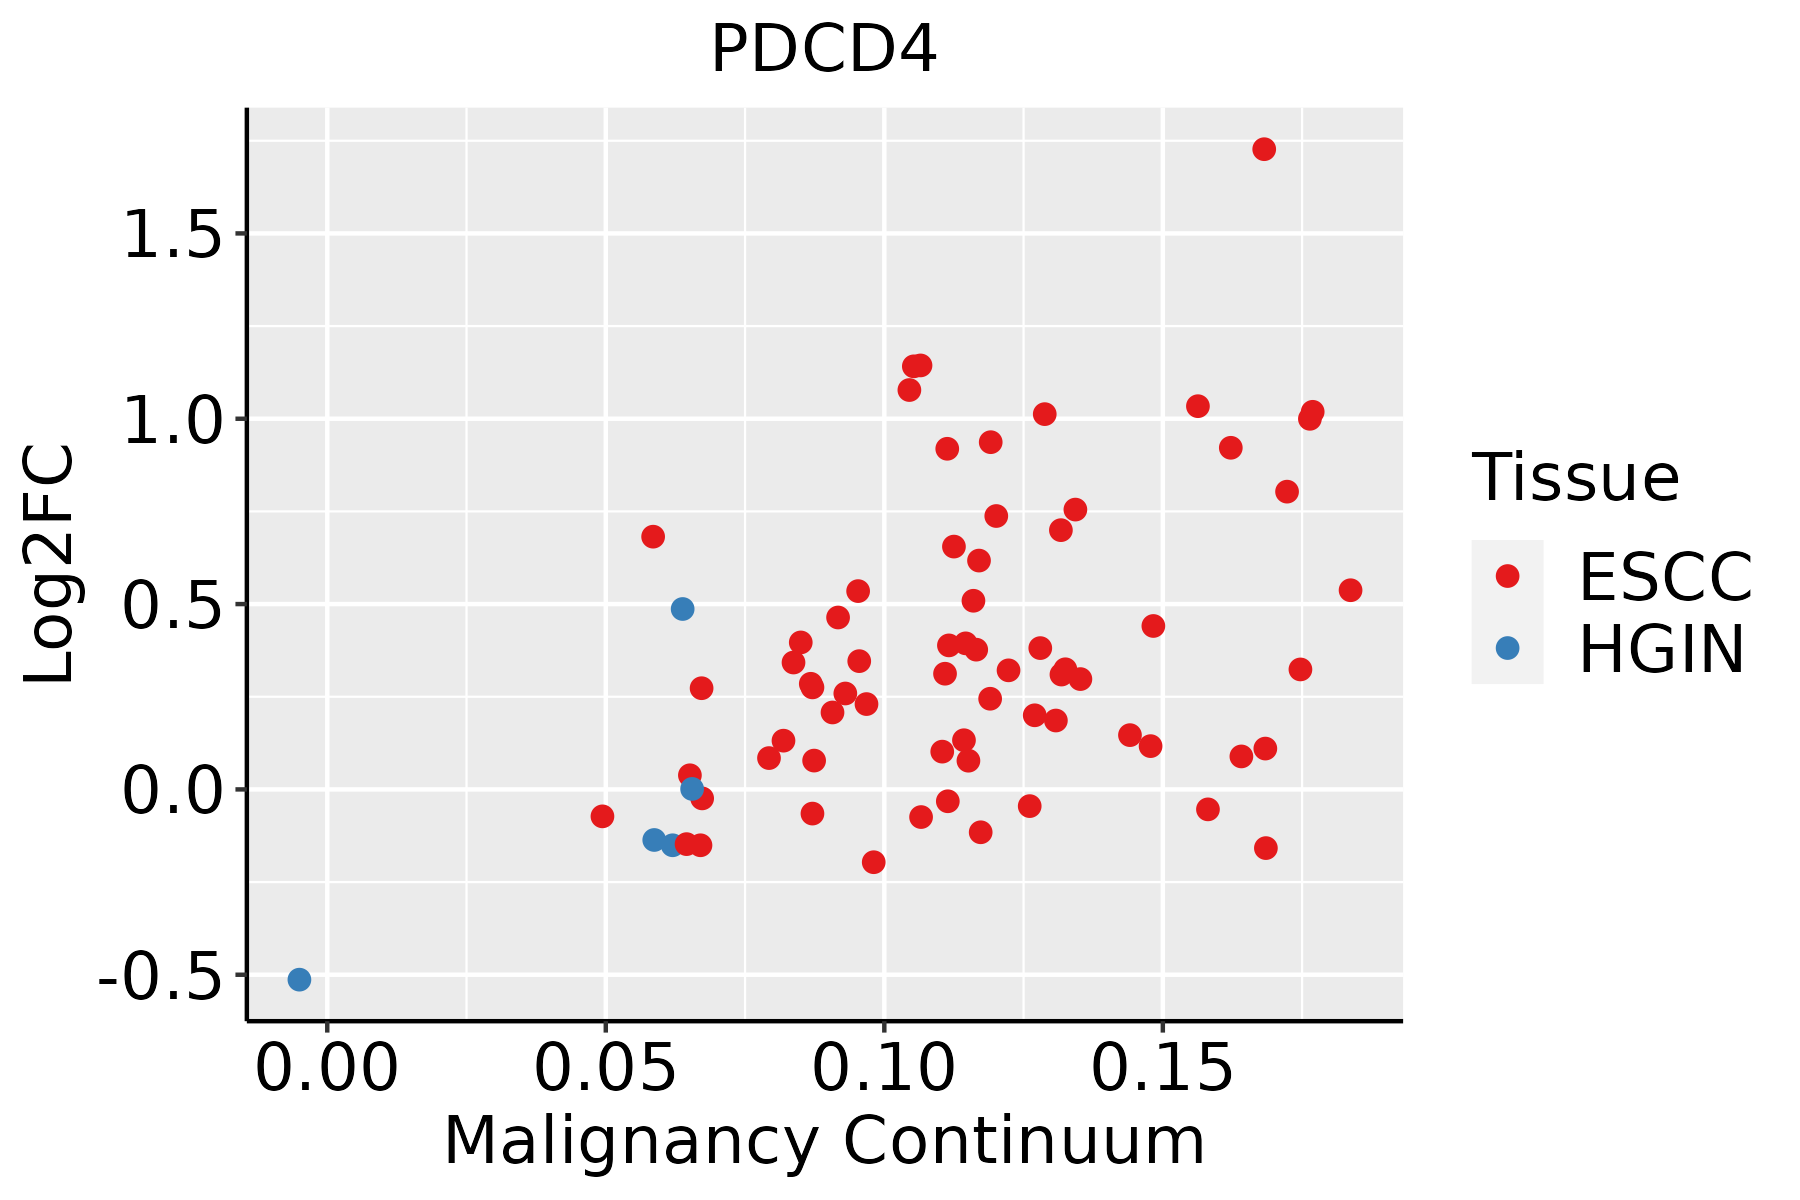 | ESCC: Esophageal squamous cell carcinoma |
| HGIN: High-grade intraepithelial neoplasias | ||
| LGIN: Low-grade intraepithelial neoplasias | ||
| Liver | 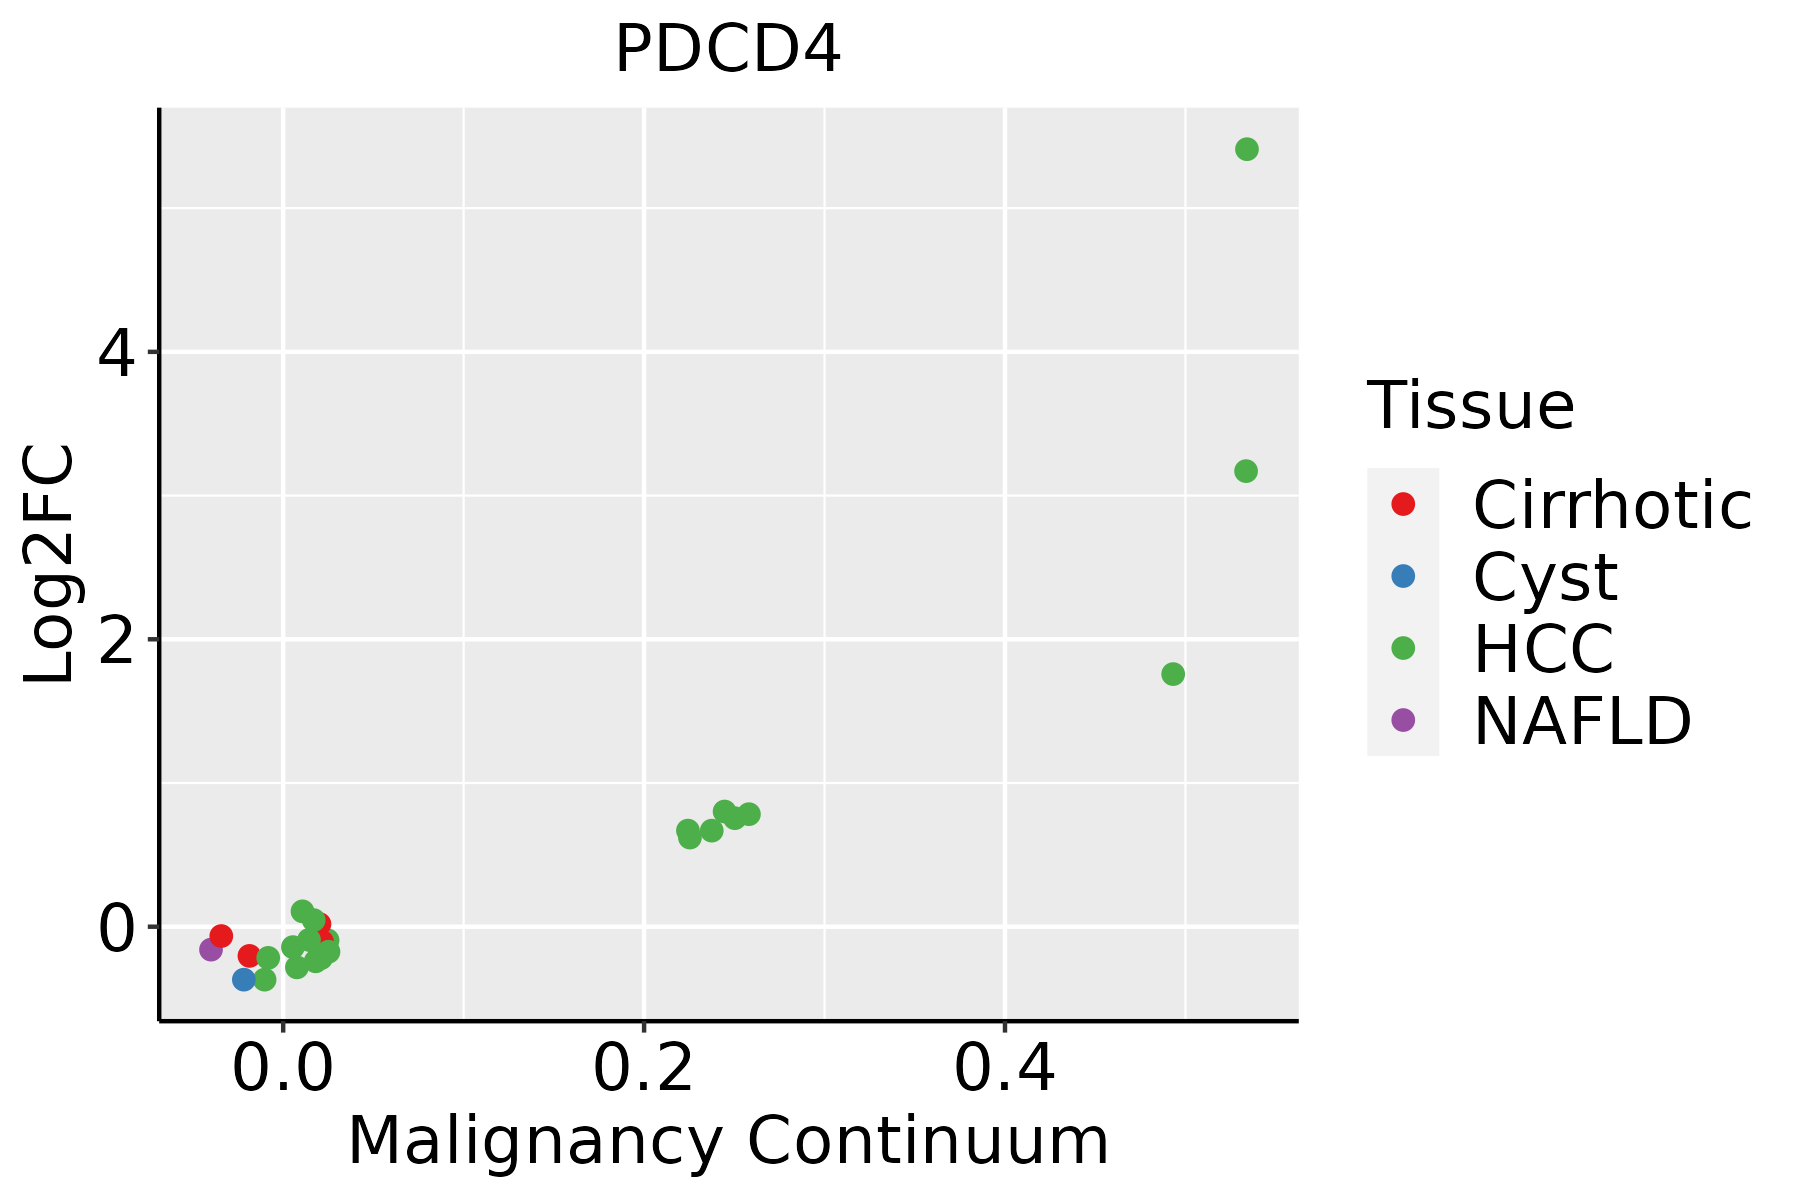 | HCC: Hepatocellular carcinoma |
| NAFLD: Non-alcoholic fatty liver disease | ||
| Oral Cavity | 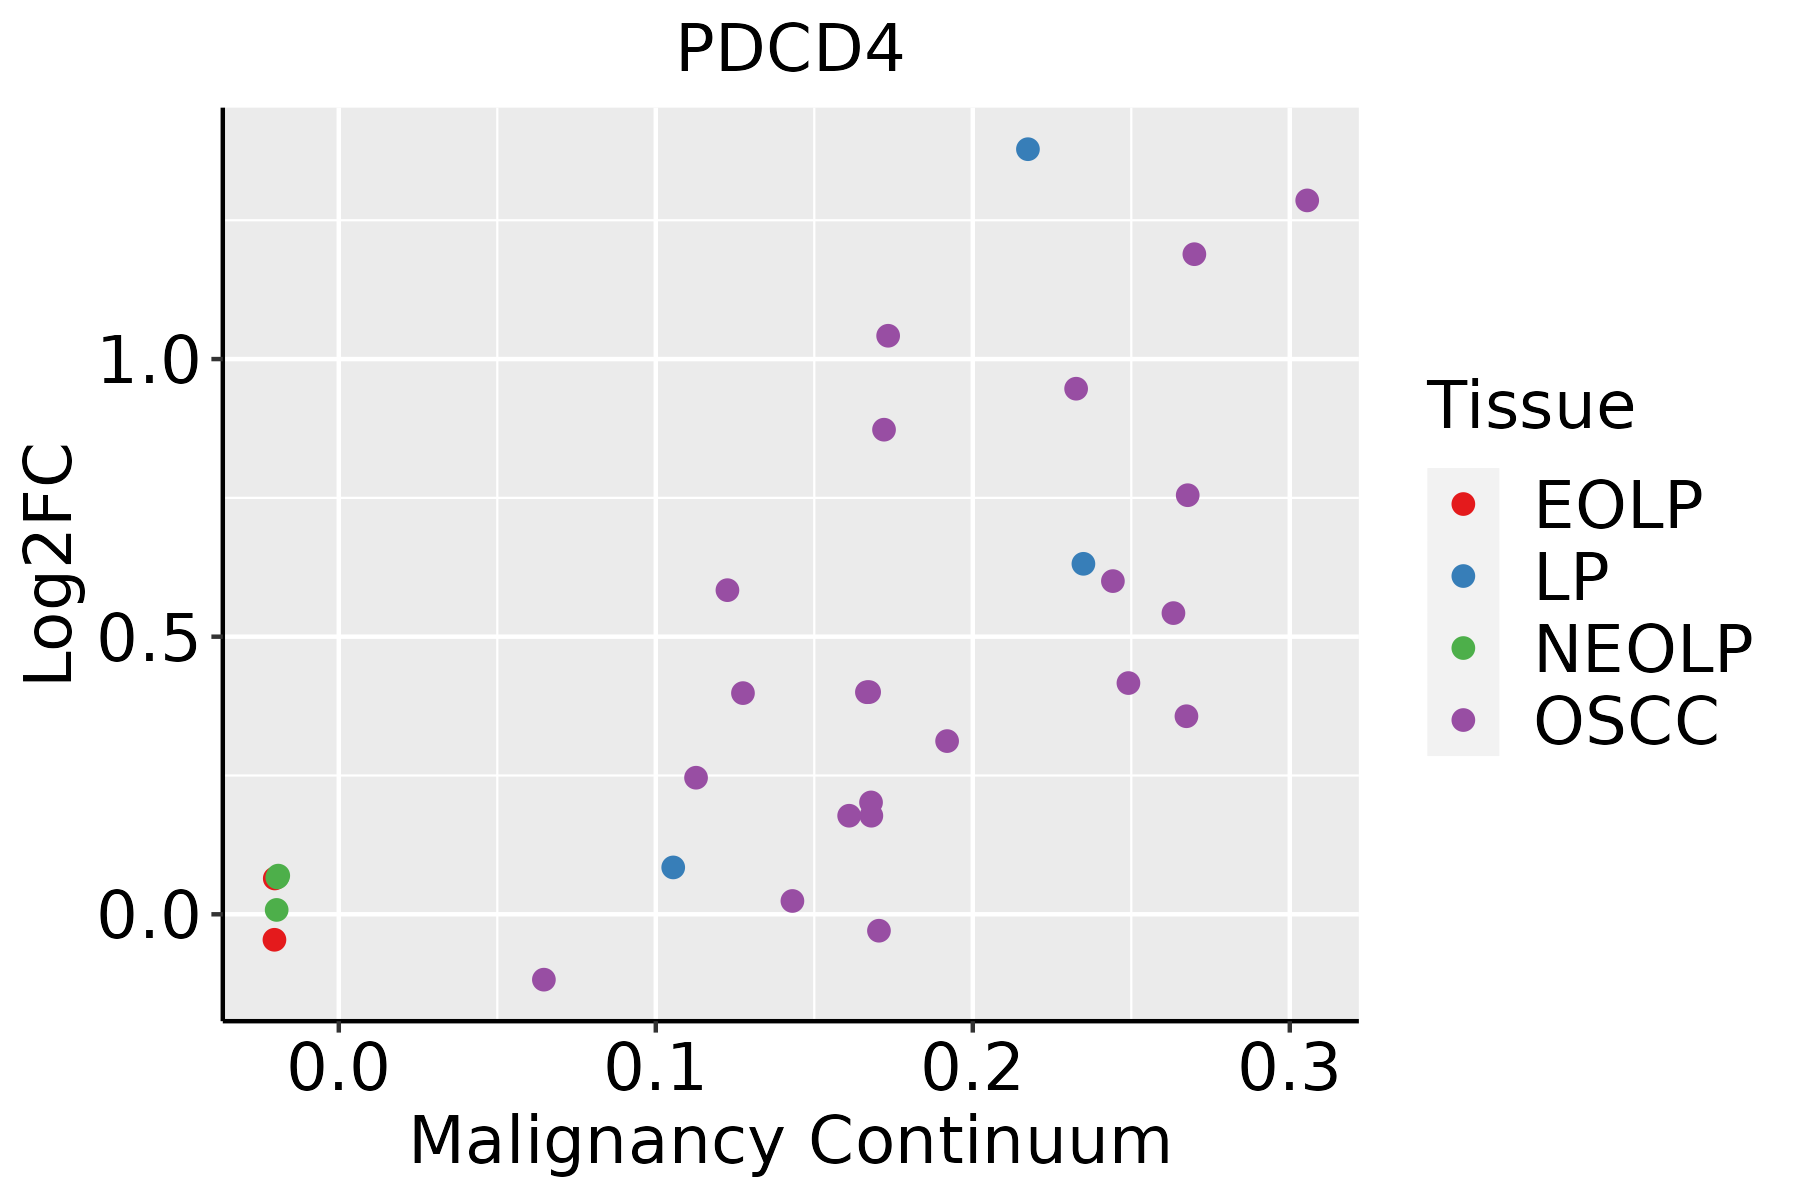 | EOLP: Erosive Oral lichen planus |
| LP: leukoplakia | ||
| NEOLP: Non-erosive oral lichen planus | ||
| OSCC: Oral squamous cell carcinoma | ||
| Prostate | 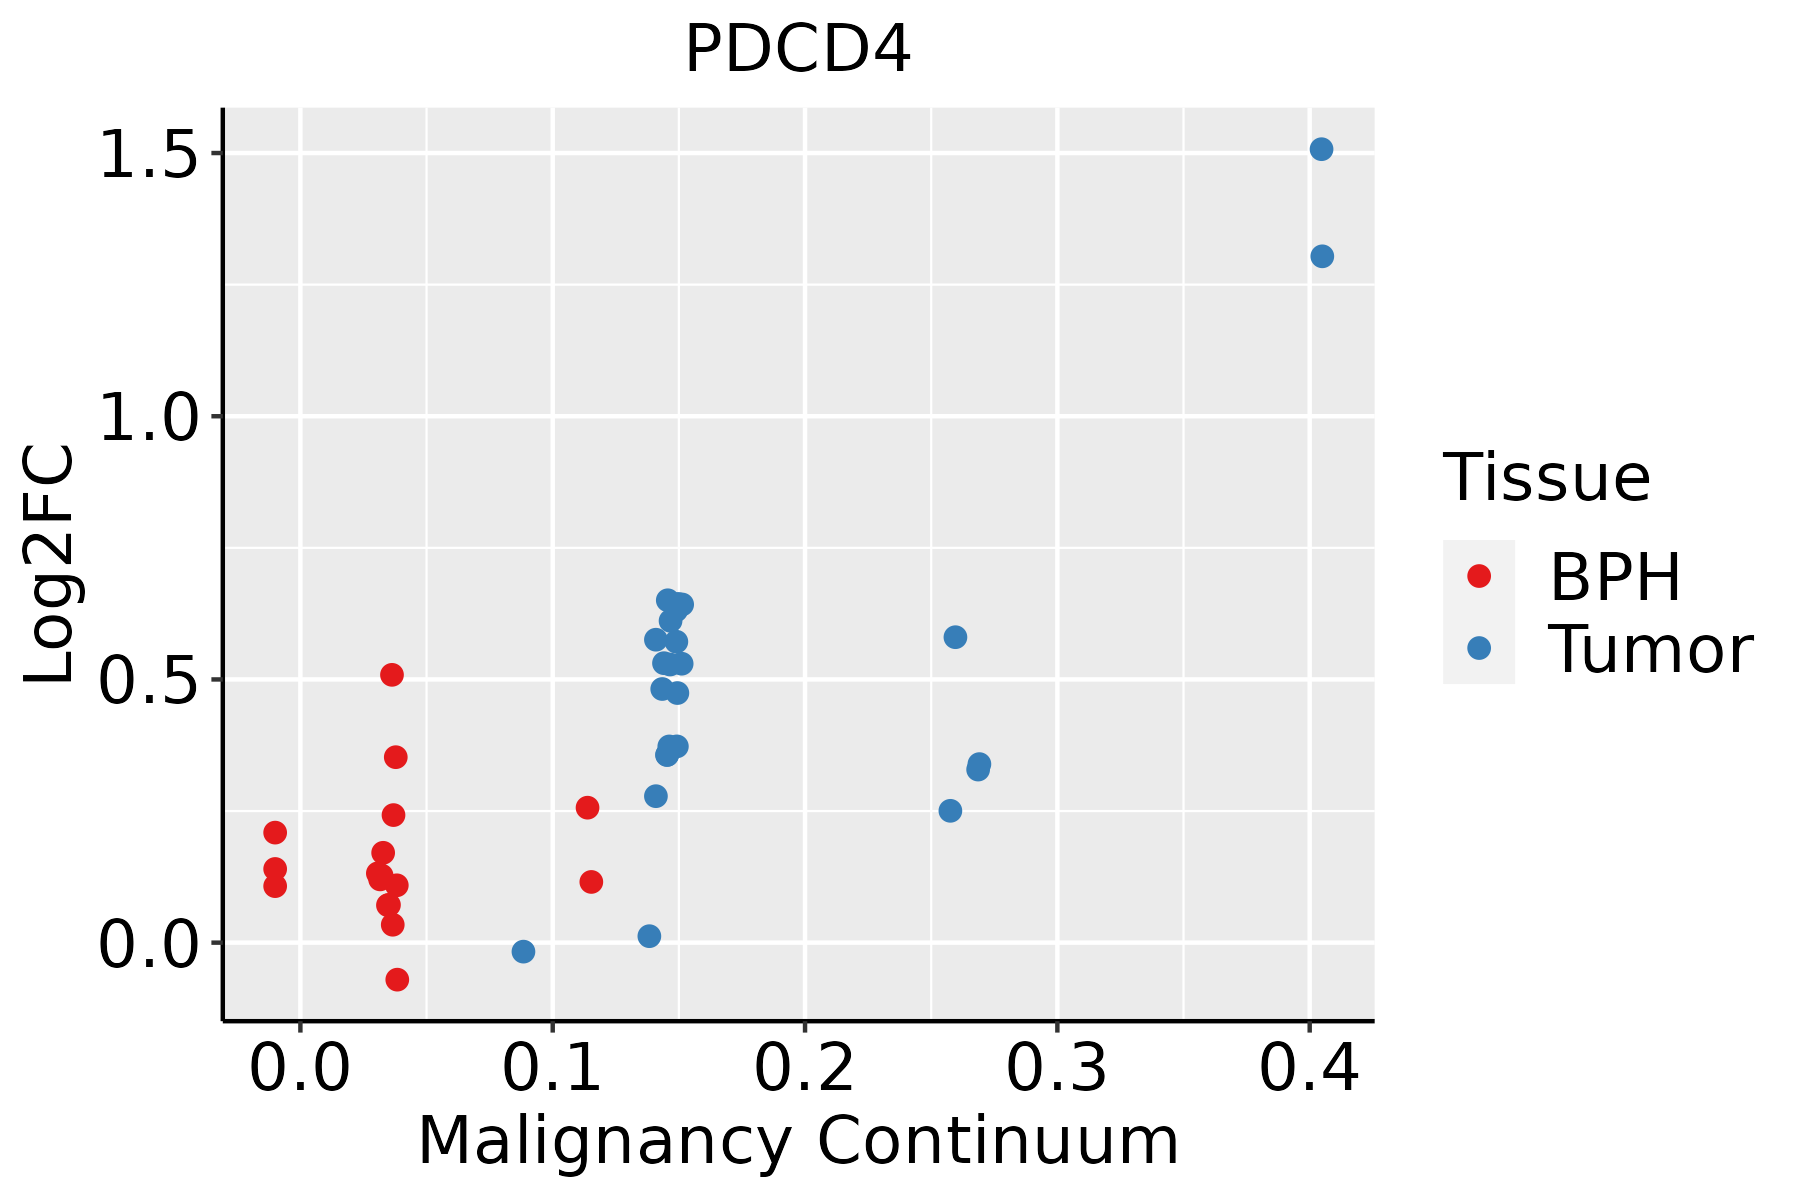 | BPH: Benign Prostatic Hyperplasia |
| Skin | 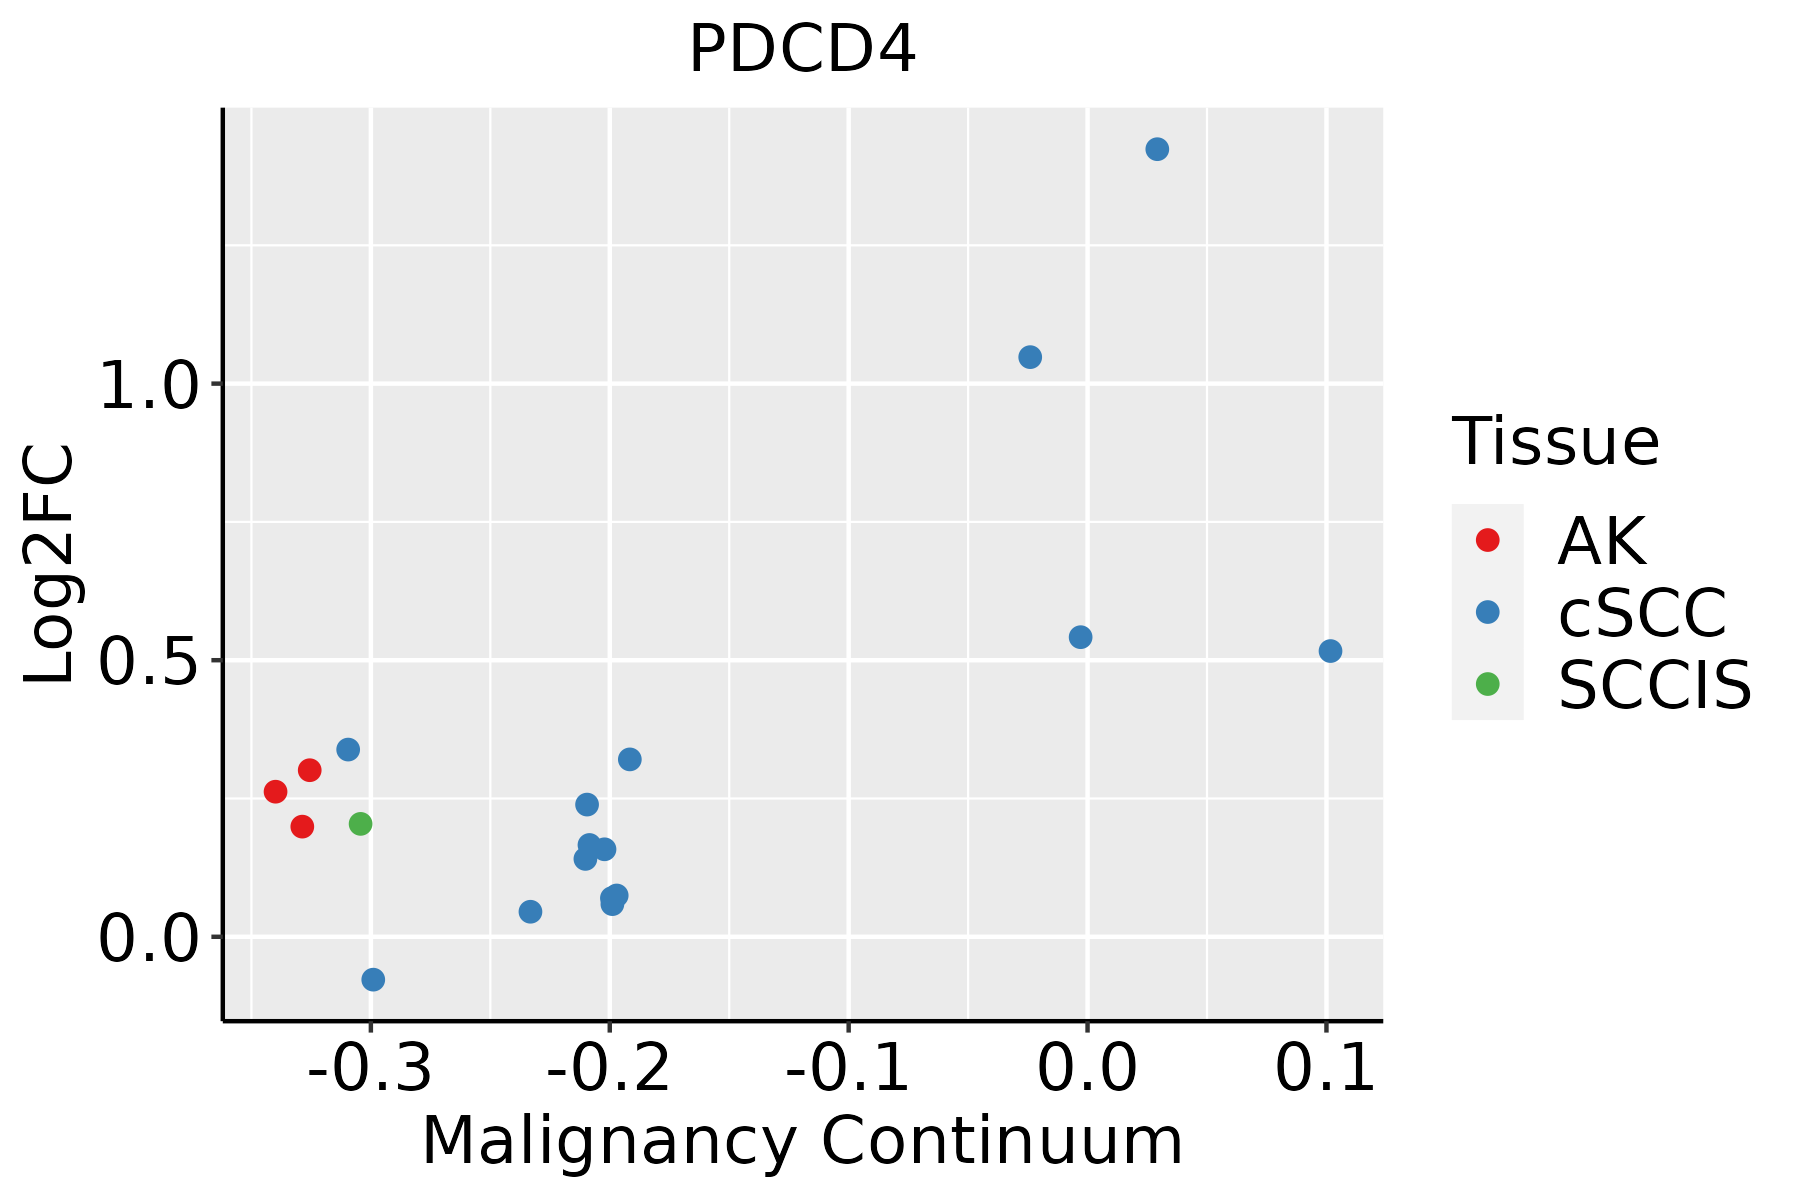 | AK: Actinic keratosis |
| cSCC: Cutaneous squamous cell carcinoma | ||
| SCCIS:squamous cell carcinoma in situ | ||
| Thyroid | 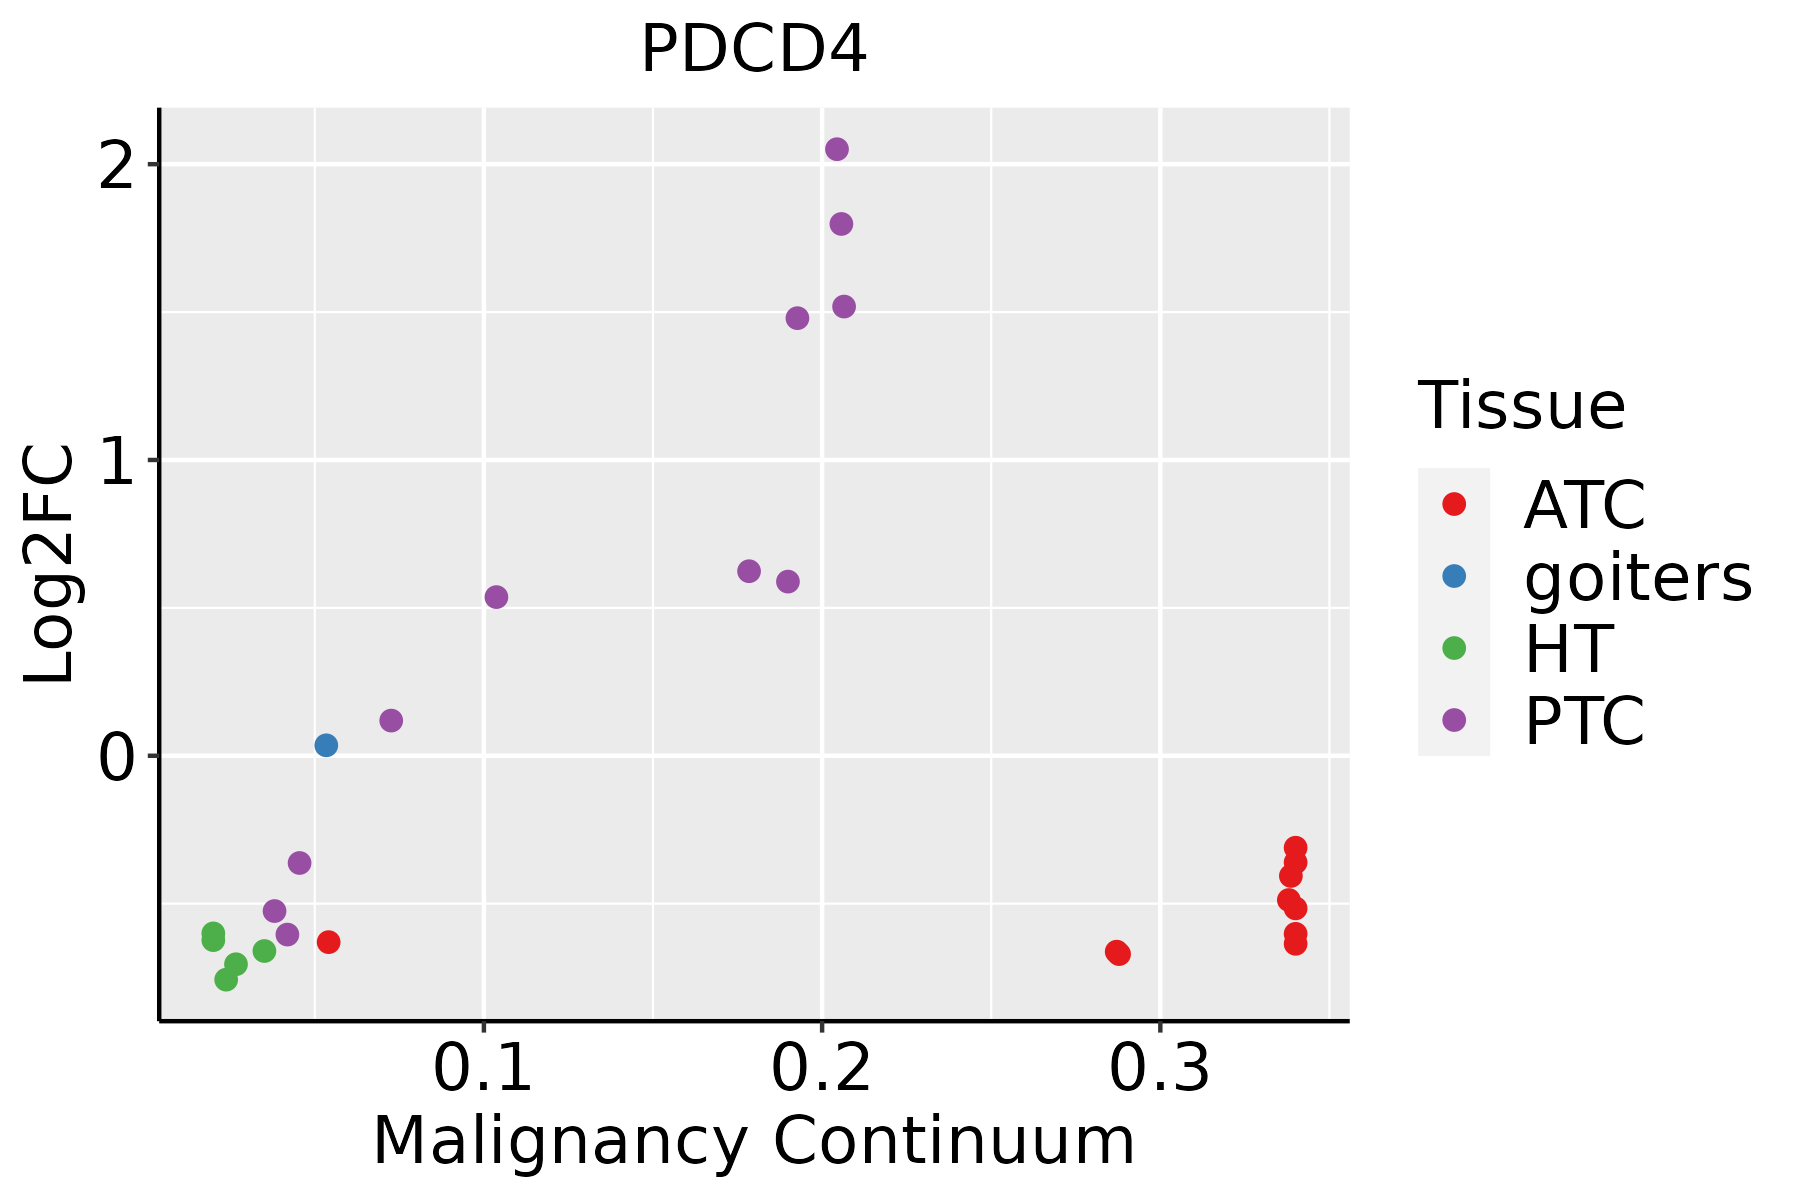 | ATC: Anaplastic thyroid cancer |
| HT: Hashimoto's thyroiditis | ||
| PTC: Papillary thyroid cancer |
| ∗log2FC in expression of this searched gene in stem-like cells from each diseased tissue sample relative to stem-like cells in normal samples in each tissue plotted against the malignancy continuum. Samples are colored based on if they are from different disease stage. |
Top |
Malignant transformation related pathway analysis |
| Find out the enriched GO biological processes and KEGG pathways involved in transition from healthy to precancer to cancer |
| Tissue | Disease Stage | Enriched GO biological Processes |
| Colorectum | AD |  |
| Colorectum | SER |  |
| Colorectum | MSS |  |
| Colorectum | MSI-H |  |
| Colorectum | FAP |  |
| ∗Top 15 enriched GO BP terms are showed in the bar plot of each disease state in each tissue. Each row represents a significant GO biological process which is colored according to the -log10(p.adjust). |
| Page: 1 2 3 4 5 6 7 8 9 |
| GO ID | Tissue | Disease Stage | Description | Gene Ratio | Bg Ratio | pvalue | p.adjust | Count |
| GO:00075688 | Breast | Precancer | aging | 41/1080 | 339/18723 | 5.95e-06 | 1.71e-04 | 41 |
| GO:00022378 | Breast | Precancer | response to molecule of bacterial origin | 43/1080 | 363/18723 | 6.05e-06 | 1.72e-04 | 43 |
| GO:00507293 | Breast | Precancer | positive regulation of inflammatory response | 23/1080 | 142/18723 | 6.51e-06 | 1.81e-04 | 23 |
| GO:00324968 | Breast | Precancer | response to lipopolysaccharide | 41/1080 | 343/18723 | 7.94e-06 | 2.17e-04 | 41 |
| GO:0050727 | Breast | Precancer | regulation of inflammatory response | 44/1080 | 386/18723 | 1.26e-05 | 3.22e-04 | 44 |
| GO:00321034 | Breast | Precancer | positive regulation of response to external stimulus | 46/1080 | 427/18723 | 3.41e-05 | 7.40e-04 | 46 |
| GO:00313493 | Breast | Precancer | positive regulation of defense response | 33/1080 | 278/18723 | 6.79e-05 | 1.36e-03 | 33 |
| GO:00712227 | Breast | Precancer | cellular response to lipopolysaccharide | 25/1080 | 209/18723 | 4.41e-04 | 5.85e-03 | 25 |
| GO:00712167 | Breast | Precancer | cellular response to biotic stimulus | 28/1080 | 246/18723 | 4.67e-04 | 6.14e-03 | 28 |
| GO:19040193 | Breast | Precancer | epithelial cell apoptotic process | 17/1080 | 121/18723 | 5.76e-04 | 7.28e-03 | 17 |
| GO:00712197 | Breast | Precancer | cellular response to molecule of bacterial origin | 25/1080 | 221/18723 | 1.00e-03 | 1.12e-02 | 25 |
| GO:19040351 | Breast | Precancer | regulation of epithelial cell apoptotic process | 14/1080 | 96/18723 | 1.18e-03 | 1.28e-02 | 14 |
| GO:00075694 | Breast | Precancer | cell aging | 17/1080 | 132/18723 | 1.55e-03 | 1.59e-02 | 17 |
| GO:00018373 | Breast | Precancer | epithelial to mesenchymal transition | 19/1080 | 157/18723 | 1.78e-03 | 1.75e-02 | 19 |
| GO:00513489 | Breast | Precancer | negative regulation of transferase activity | 27/1080 | 268/18723 | 3.49e-03 | 2.90e-02 | 27 |
| GO:000756813 | Breast | IDC | aging | 52/1434 | 339/18723 | 1.14e-06 | 5.10e-05 | 52 |
| GO:003249612 | Breast | IDC | response to lipopolysaccharide | 47/1434 | 343/18723 | 7.13e-05 | 1.43e-03 | 47 |
| GO:000223712 | Breast | IDC | response to molecule of bacterial origin | 49/1434 | 363/18723 | 7.40e-05 | 1.47e-03 | 49 |
| GO:005134814 | Breast | IDC | negative regulation of transferase activity | 39/1434 | 268/18723 | 7.89e-05 | 1.56e-03 | 39 |
| GO:00313491 | Breast | IDC | positive regulation of defense response | 39/1434 | 278/18723 | 1.74e-04 | 2.95e-03 | 39 |
| Page: 1 2 3 4 5 6 7 8 9 10 11 12 13 14 15 16 17 18 19 20 21 22 23 24 25 26 27 28 29 30 31 32 33 |
| Pathway ID | Tissue | Disease Stage | Description | Gene Ratio | Bg Ratio | pvalue | p.adjust | qvalue | Count |
| hsa0520514 | Breast | Precancer | Proteoglycans in cancer | 30/684 | 205/8465 | 1.00e-03 | 7.18e-03 | 5.50e-03 | 30 |
| hsa0520515 | Breast | Precancer | Proteoglycans in cancer | 30/684 | 205/8465 | 1.00e-03 | 7.18e-03 | 5.50e-03 | 30 |
| hsa0520523 | Breast | IDC | Proteoglycans in cancer | 42/867 | 205/8465 | 7.69e-06 | 9.99e-05 | 7.48e-05 | 42 |
| hsa0520533 | Breast | IDC | Proteoglycans in cancer | 42/867 | 205/8465 | 7.69e-06 | 9.99e-05 | 7.48e-05 | 42 |
| hsa0520542 | Breast | DCIS | Proteoglycans in cancer | 39/846 | 205/8465 | 5.36e-05 | 5.58e-04 | 4.11e-04 | 39 |
| hsa0520552 | Breast | DCIS | Proteoglycans in cancer | 39/846 | 205/8465 | 5.36e-05 | 5.58e-04 | 4.11e-04 | 39 |
| hsa05205 | Colorectum | AD | Proteoglycans in cancer | 70/2092 | 205/8465 | 1.37e-03 | 8.46e-03 | 5.39e-03 | 70 |
| hsa052051 | Colorectum | AD | Proteoglycans in cancer | 70/2092 | 205/8465 | 1.37e-03 | 8.46e-03 | 5.39e-03 | 70 |
| hsa052052 | Colorectum | SER | Proteoglycans in cancer | 58/1580 | 205/8465 | 4.37e-04 | 3.82e-03 | 2.77e-03 | 58 |
| hsa052053 | Colorectum | SER | Proteoglycans in cancer | 58/1580 | 205/8465 | 4.37e-04 | 3.82e-03 | 2.77e-03 | 58 |
| hsa052054 | Colorectum | MSS | Proteoglycans in cancer | 65/1875 | 205/8465 | 8.66e-04 | 5.38e-03 | 3.29e-03 | 65 |
| hsa052055 | Colorectum | MSS | Proteoglycans in cancer | 65/1875 | 205/8465 | 8.66e-04 | 5.38e-03 | 3.29e-03 | 65 |
| hsa052056 | Colorectum | FAP | Proteoglycans in cancer | 57/1404 | 205/8465 | 3.05e-05 | 3.29e-04 | 2.00e-04 | 57 |
| hsa052057 | Colorectum | FAP | Proteoglycans in cancer | 57/1404 | 205/8465 | 3.05e-05 | 3.29e-04 | 2.00e-04 | 57 |
| hsa052058 | Colorectum | CRC | Proteoglycans in cancer | 47/1091 | 205/8465 | 4.43e-05 | 8.70e-04 | 5.90e-04 | 47 |
| hsa052059 | Colorectum | CRC | Proteoglycans in cancer | 47/1091 | 205/8465 | 4.43e-05 | 8.70e-04 | 5.90e-04 | 47 |
| hsa0520518 | Endometrium | AEH | Proteoglycans in cancer | 53/1197 | 205/8465 | 5.43e-06 | 6.53e-05 | 4.78e-05 | 53 |
| hsa0520519 | Endometrium | AEH | Proteoglycans in cancer | 53/1197 | 205/8465 | 5.43e-06 | 6.53e-05 | 4.78e-05 | 53 |
| hsa0520524 | Endometrium | EEC | Proteoglycans in cancer | 52/1237 | 205/8465 | 3.01e-05 | 3.19e-04 | 2.38e-04 | 52 |
| hsa0520534 | Endometrium | EEC | Proteoglycans in cancer | 52/1237 | 205/8465 | 3.01e-05 | 3.19e-04 | 2.38e-04 | 52 |
| Page: 1 2 |
Top |
Cell-cell communication analysis |
| Identification of potential cell-cell interactions between two cell types and their ligand-receptor pairs for different disease states |
| Ligand | Receptor | LRpair | Pathway | Tissue | Disease Stage |
| Page: 1 |
Top |
Single-cell gene regulatory network inference analysis |
| Find out the significant the regulons (TFs) and the target genes of each regulon across cell types for different disease states |
| TF | Cell Type | Tissue | Disease Stage | Target Gene | RSS | Regulon Activity |
| ∗The dot plots of a searched regulon are shown for all cell subpopulations in each disease state of each tissue based on the regulon specific score inferred using pySCENIC and by calculating the average expression. |
| Page: 1 |
Top |
Somatic mutation of malignant transformation related genes |
| Annotation of somatic variants for genes involved in malignant transformation |
| Hugo Symbol | Variant Class | Variant Classification | dbSNP RS | HGVSc | HGVSp | HGVSp Short | SWISSPROT | BIOTYPE | SIFT | PolyPhen | Tumor Sample Barcode | Tissue | Histology | Sex | Age | Stage | Therapy Types | Drugs | Outcome |
| PDCD4 | SNV | Missense_Mutation | c.785N>T | p.Gly262Val | p.G262V | Q53EL6 | protein_coding | deleterious(0) | probably_damaging(0.976) | TCGA-A2-A25A-01 | Breast | breast invasive carcinoma | Female | <65 | I/II | Unspecific | Cytoxan | SD | |
| PDCD4 | SNV | Missense_Mutation | c.499N>C | p.Thr167Pro | p.T167P | Q53EL6 | protein_coding | tolerated(0.12) | benign(0.388) | TCGA-A8-A09M-01 | Breast | breast invasive carcinoma | Female | >=65 | III/IV | Chemotherapy | paclitaxel | CR | |
| PDCD4 | SNV | Missense_Mutation | novel | c.923N>C | p.Gly308Ala | p.G308A | Q53EL6 | protein_coding | tolerated(0.07) | benign(0) | TCGA-AC-A3QP-01 | Breast | breast invasive carcinoma | Female | >=65 | I/II | Hormone Therapy | femara | SD |
| PDCD4 | SNV | Missense_Mutation | novel | c.1203N>T | p.Met401Ile | p.M401I | Q53EL6 | protein_coding | tolerated(0.07) | benign(0.076) | TCGA-AN-A046-01 | Breast | breast invasive carcinoma | Female | >=65 | I/II | Unknown | Unknown | SD |
| PDCD4 | SNV | Missense_Mutation | novel | c.8N>C | p.Val3Ala | p.V3A | Q53EL6 | protein_coding | tolerated_low_confidence(0.53) | benign(0) | TCGA-B6-A0IJ-01 | Breast | breast invasive carcinoma | Female | <65 | I/II | Unknown | Unknown | SD |
| PDCD4 | SNV | Missense_Mutation | rs376713943 | c.943N>G | p.Trp315Gly | p.W315G | Q53EL6 | protein_coding | deleterious(0) | probably_damaging(0.981) | TCGA-C5-A1BQ-01 | Cervix | cervical & endocervical cancer | Female | >=65 | III/IV | Chemotherapy | cisplatin | CR |
| PDCD4 | SNV | Missense_Mutation | c.356G>C | p.Gly119Ala | p.G119A | Q53EL6 | protein_coding | deleterious(0) | probably_damaging(0.998) | TCGA-DG-A2KM-01 | Cervix | cervical & endocervical cancer | Female | <65 | I/II | Chemotherapy | cisplatin | SD | |
| PDCD4 | SNV | Missense_Mutation | novel | c.703N>A | p.Asp235Asn | p.D235N | Q53EL6 | protein_coding | deleterious(0.05) | benign(0.229) | TCGA-HM-A4S6-01 | Cervix | cervical & endocervical cancer | Female | <65 | III/IV | Chemotherapy | cisplatin | CR |
| PDCD4 | SNV | Missense_Mutation | c.888N>A | p.Asp296Glu | p.D296E | Q53EL6 | protein_coding | tolerated(0.25) | benign(0) | TCGA-LP-A4AW-01 | Cervix | cervical & endocervical cancer | Female | <65 | I/II | Unknown | Unknown | SD | |
| PDCD4 | SNV | Missense_Mutation | rs375978756 | c.250N>A | p.Ala84Thr | p.A84T | Q53EL6 | protein_coding | tolerated(0.38) | benign(0) | TCGA-MA-AA42-01 | Cervix | cervical & endocervical cancer | Female | >=65 | I/II | Unknown | Unknown | SD |
| Page: 1 2 3 4 5 |
Top |
Related drugs of malignant transformation related genes |
| Identification of chemicals and drugs interact with genes involved in malignant transfromation |
| (DGIdb 4.0) |
| Entrez ID | Symbol | Category | Interaction Types | Drug Claim Name | Drug Name | PMIDs |
| 27250 | PDCD4 | KINASE, DRUGGABLE GENOME | PACLITAXEL | PACLITAXEL | 25928036 |
| Page: 1 |

Copyright 2023-Present -The University of Texas Health Science Center at Houston |