Schematic overview of the cellular and molecular mechanisms involved in the cancer progression, including the proposed cellular and molecular mechanisms in cancer cells trajectory. AT1: alveolar type 1 cells; AT2: alveolar type 2 cells; AAH: atypical adenomatous hyperplasia; AIS: adenocarcinoma in situ; MIA: minimally invasive adenocarcinoma; IA: invasive adenocarcinoma; EMT: epithelial-mesenchymal transition

Home

Download

Statistics

Help

Contact

Center for Computational Systems Medicine
leaf

Gene summary

leaf

Malignant transformation analysis

leaf

Malignant transformation related pathway analysis

leaf

Cell-cell communication analysis

leaf

Single-cell gene regulatory network inference analysis

leaf

Somatic mutation of malignant transformation related genes

leaf

Related drugs of malignant transformation related genes

Gene: PDCD2

Gene summary for PDCD2

check button Gene summary.

Gene informationSpeciesHuman
Gene symbol

PDCD2

Gene ID

5134

Gene nameprogrammed cell death 2
Gene AliasRP8
Cytomap6q27
Gene Typeprotein-coding
GO ID

GO:0002244

UniProtAcc

A0A087WYJ3


Top

Malignant transformation analysis

check button Identification of the aberrant gene expression in precancerous and cancerous lesions by comparing the gene expression of stem-like cells in diseased tissues with normal stem cells
check button Malignant transformation involving gene list.
Entrez IDSymbolReplicatesSpeciesOrganTissueAdj P-valueLog2FCMalignancy
5134PDCD2LZE2THumanEsophagusESCC1.58e-045.04e-010.082
5134PDCD2LZE7THumanEsophagusESCC2.95e-021.04e-020.0667
5134PDCD2LZE20THumanEsophagusESCC9.88e-031.74e-010.0662
5134PDCD2LZE22D1HumanEsophagusHGIN8.31e-092.29e-010.0595
5134PDCD2LZE22THumanEsophagusESCC1.99e-066.69e-010.068
5134PDCD2LZE24THumanEsophagusESCC2.12e-391.08e+000.0596
5134PDCD2LZE21THumanEsophagusESCC7.63e-102.60e-010.0655
5134PDCD2P1T-EHumanEsophagusESCC1.44e-105.36e-010.0875
5134PDCD2P2T-EHumanEsophagusESCC3.77e-336.81e-010.1177
5134PDCD2P4T-EHumanEsophagusESCC4.50e-461.29e+000.1323
5134PDCD2P5T-EHumanEsophagusESCC6.80e-317.86e-010.1327
5134PDCD2P8T-EHumanEsophagusESCC2.71e-296.15e-010.0889
5134PDCD2P9T-EHumanEsophagusESCC8.60e-195.26e-010.1131
5134PDCD2P10T-EHumanEsophagusESCC5.20e-428.56e-010.116
5134PDCD2P11T-EHumanEsophagusESCC3.28e-157.82e-010.1426
5134PDCD2P12T-EHumanEsophagusESCC6.25e-194.89e-010.1122
5134PDCD2P15T-EHumanEsophagusESCC9.46e-441.02e+000.1149
5134PDCD2P16T-EHumanEsophagusESCC1.20e-419.25e-010.1153
5134PDCD2P17T-EHumanEsophagusESCC1.17e-149.15e-010.1278
5134PDCD2P19T-EHumanEsophagusESCC3.95e-161.65e+000.1662
Page: 1 2 3 4 5 6 7 

check button Transcriptomic changes along malignancy continuum.
TissueExpression DynamicsAbbreviation
EsophagusThe image shows the transcriptomic changes along malignancy continuum.log2FC in expression of this searched gene in stem-like cells from each diseased tissue sample relative to stem-like cells in normal samples in each tissue plotted against the malignancy continuum. Samples are colored based on if they are from different disease stage.
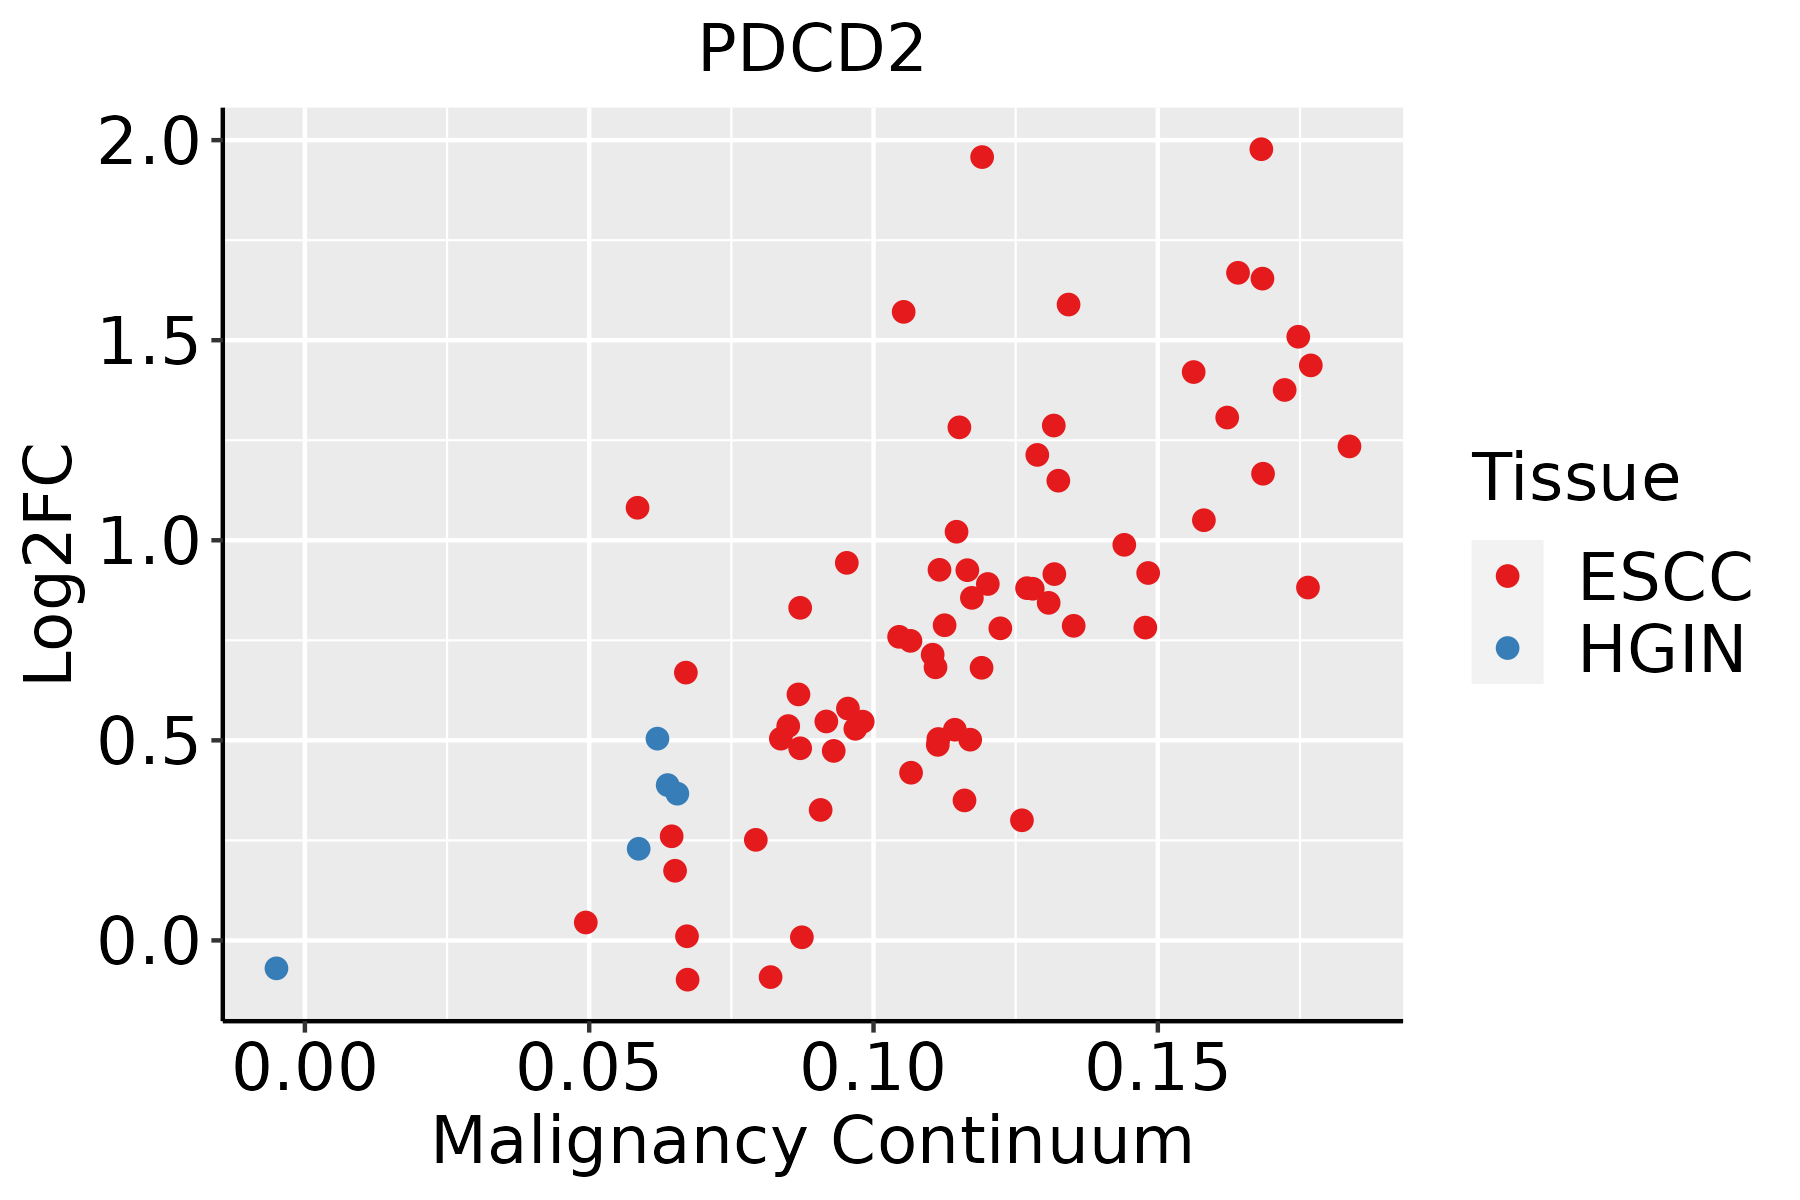
ESCC: Esophageal squamous cell carcinoma
HGIN: High-grade intraepithelial neoplasias
LGIN: Low-grade intraepithelial neoplasias
LiverThe image shows the transcriptomic changes along malignancy continuum.log2FC in expression of this searched gene in stem-like cells from each diseased tissue sample relative to stem-like cells in normal samples in each tissue plotted against the malignancy continuum. Samples are colored based on if they are from different disease stage.
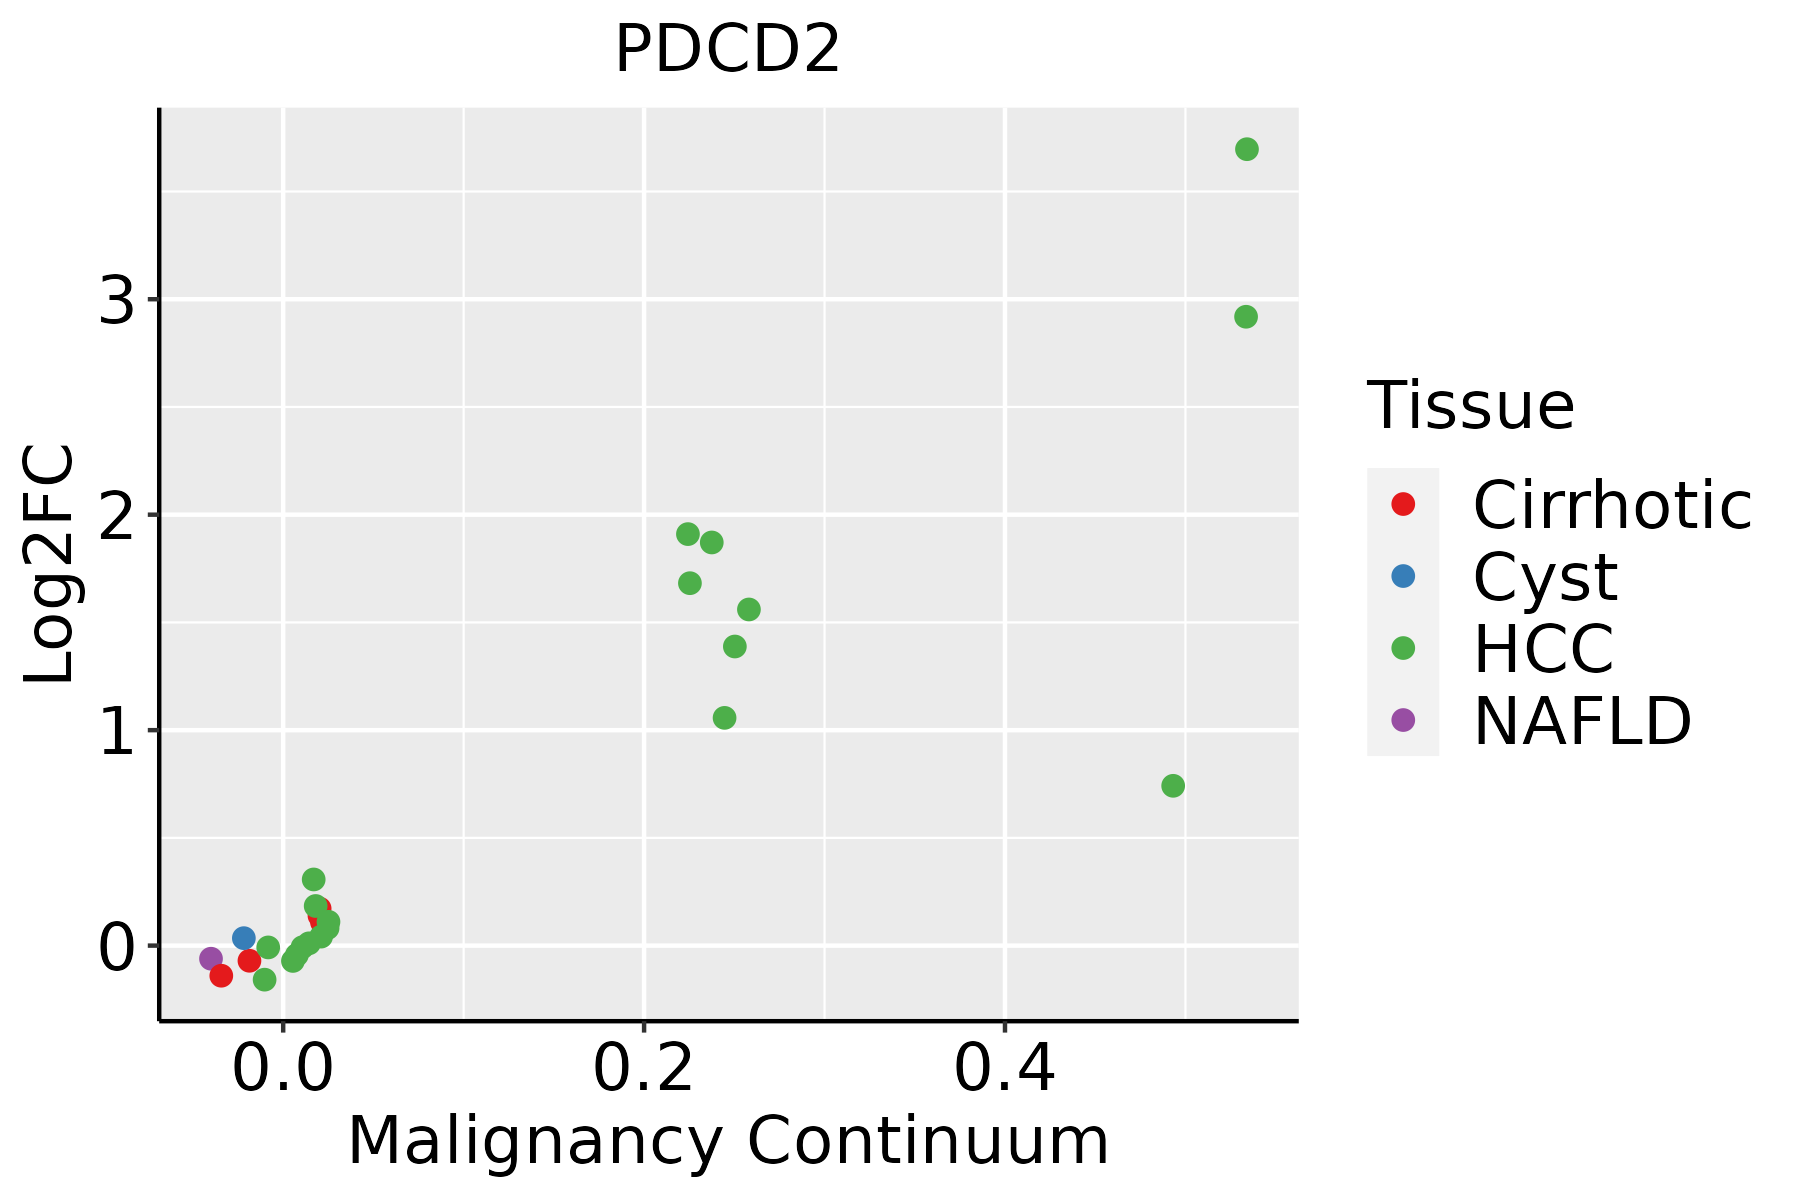
HCC: Hepatocellular carcinoma
NAFLD: Non-alcoholic fatty liver disease
Oral CavityThe image shows the transcriptomic changes along malignancy continuum.log2FC in expression of this searched gene in stem-like cells from each diseased tissue sample relative to stem-like cells in normal samples in each tissue plotted against the malignancy continuum. Samples are colored based on if they are from different disease stage.
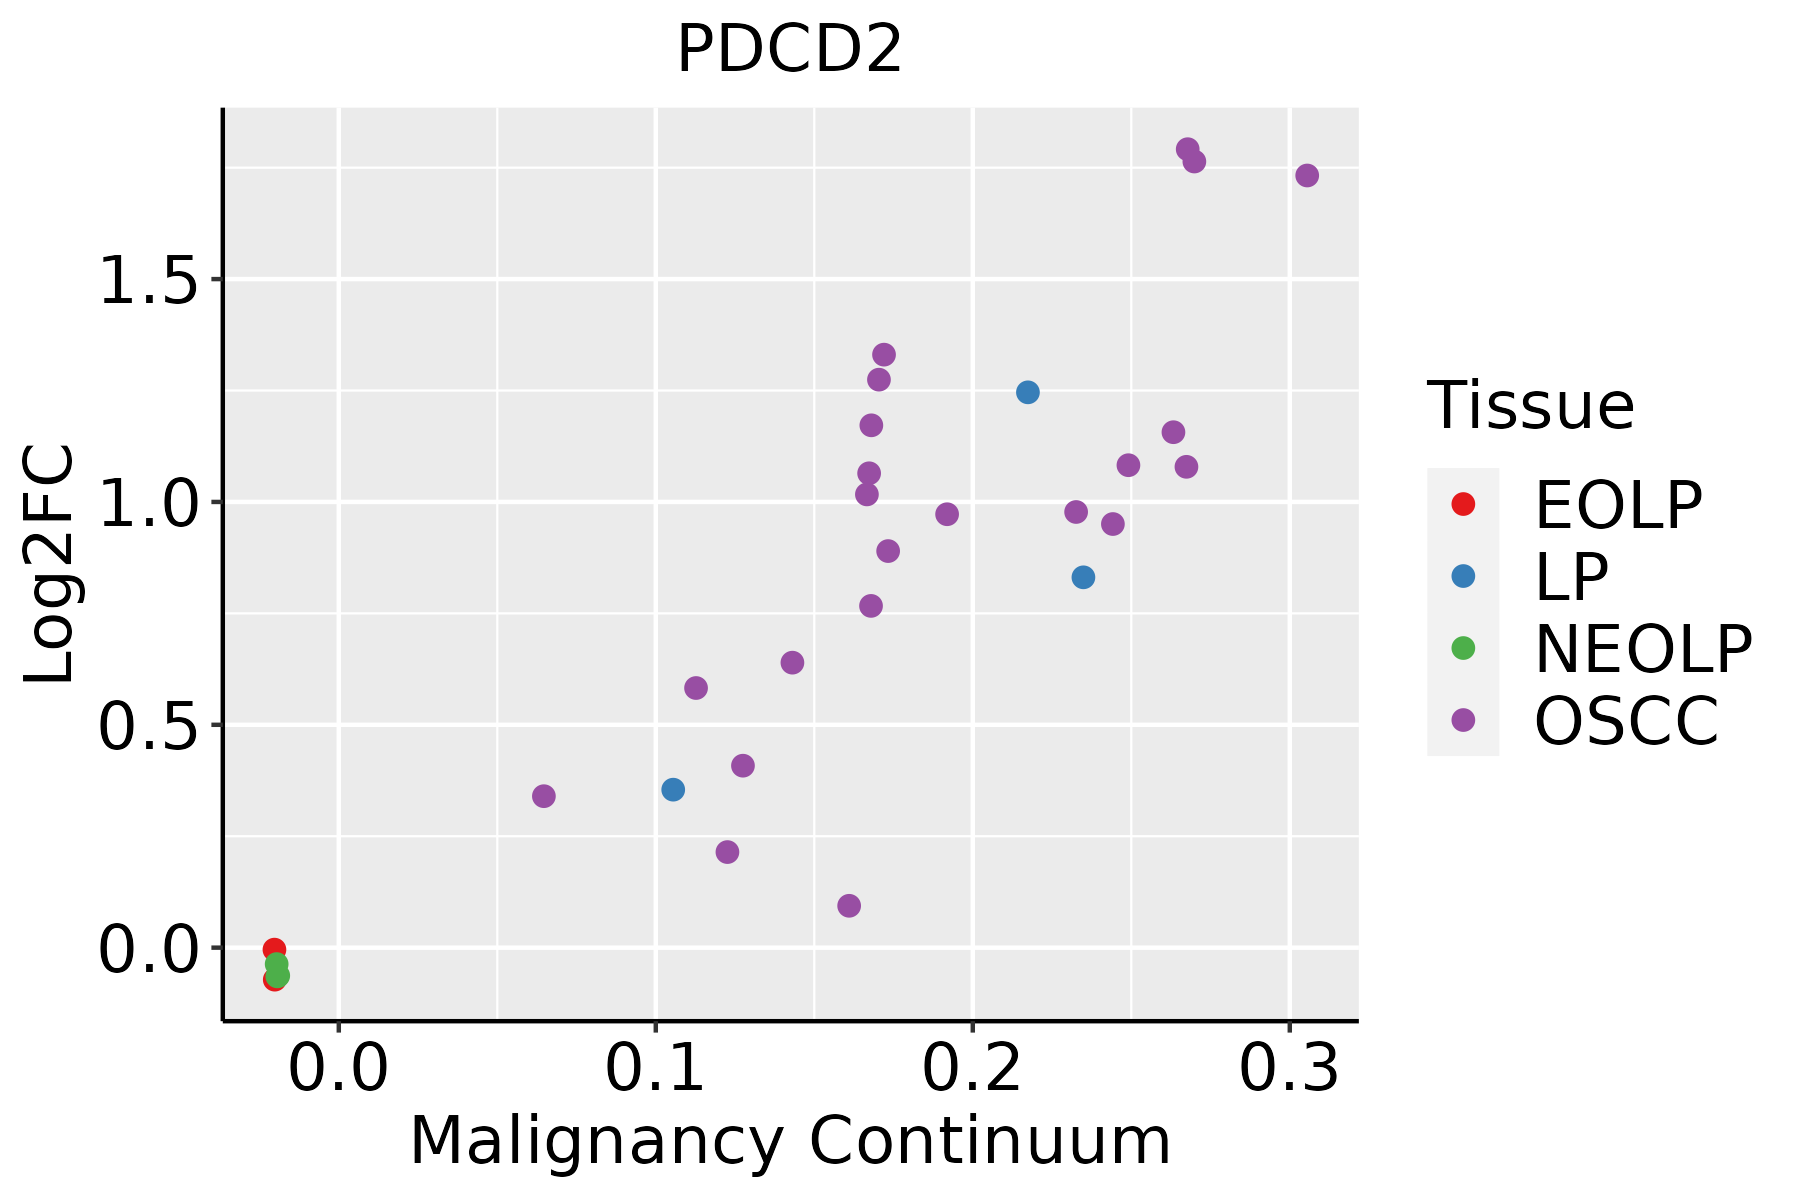
EOLP: Erosive Oral lichen planus
LP: leukoplakia
NEOLP: Non-erosive oral lichen planus
OSCC: Oral squamous cell carcinoma
SkinThe image shows the transcriptomic changes along malignancy continuum.log2FC in expression of this searched gene in stem-like cells from each diseased tissue sample relative to stem-like cells in normal samples in each tissue plotted against the malignancy continuum. Samples are colored based on if they are from different disease stage.AK: Actinic keratosis
cSCC: Cutaneous squamous cell carcinoma
SCCIS:squamous cell carcinoma in situ
ThyroidThe image shows the transcriptomic changes along malignancy continuum.log2FC in expression of this searched gene in stem-like cells from each diseased tissue sample relative to stem-like cells in normal samples in each tissue plotted against the malignancy continuum. Samples are colored based on if they are from different disease stage.
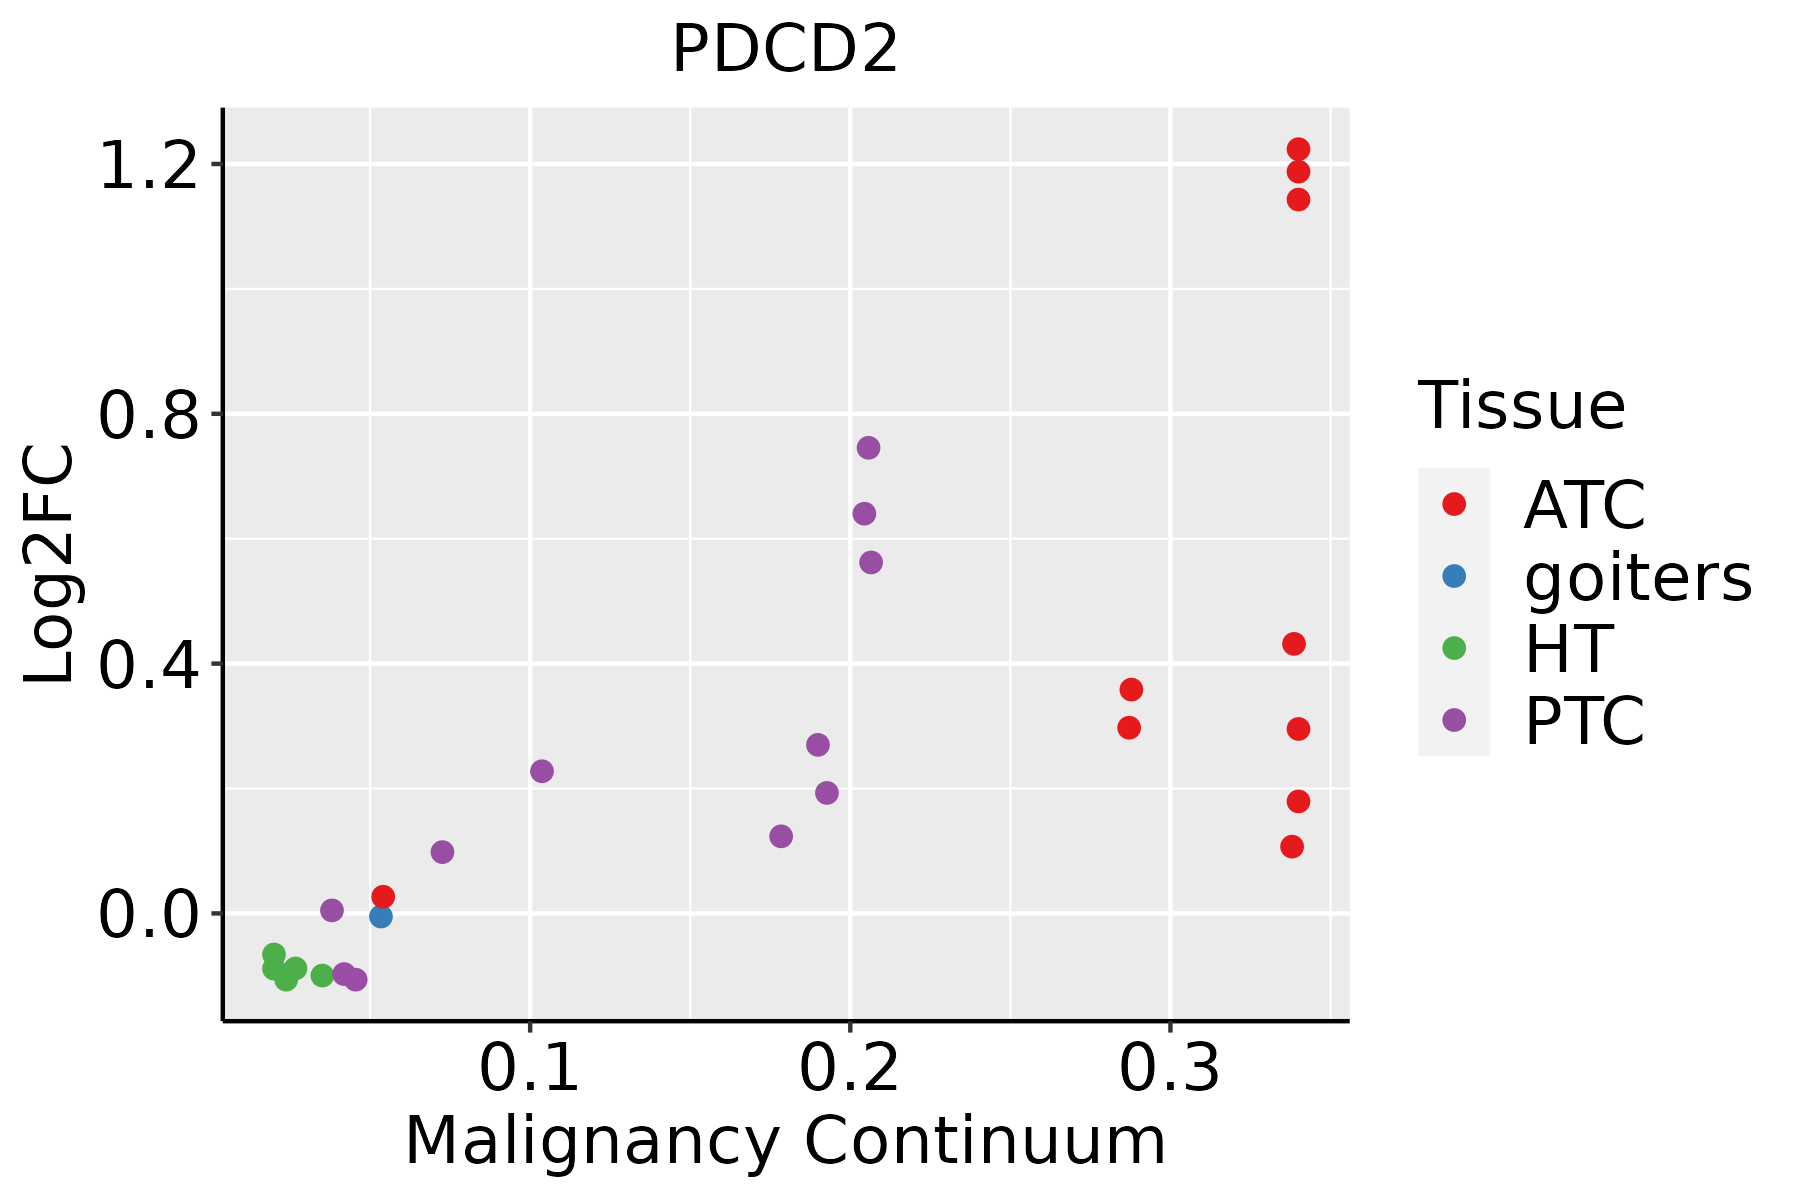
ATC: Anaplastic thyroid cancer
HT: Hashimoto's thyroiditis
PTC: Papillary thyroid cancer
∗log2FC in expression of this searched gene in stem-like cells from each diseased tissue sample relative to stem-like cells in normal samples in each tissue plotted against the malignancy continuum. Samples are colored based on if they are from different disease stage.

Top

Malignant transformation related pathway analysis

check buttonFind out the enriched GO biological processes and KEGG pathways involved in transition from healthy to precancer to cancer
check button Figure of enriched GO biological processes.
TissueDisease StageEnriched GO biological Processes
ColorectumADGO analysis - Figure of enriched GO biological processes: Top 15 enriched GO BP terms are showed in the bar plot of each disease state in each tissue. Each row represents a significant GO biological process which is colored according to the -log10(p.adjust).
ColorectumSERGO analysis - Figure of enriched GO biological processes: Top 15 enriched GO BP terms are showed in the bar plot of each disease state in each tissue. Each row represents a significant GO biological process which is colored according to the -log10(p.adjust).
ColorectumMSSGO analysis - Figure of enriched GO biological processes: Top 15 enriched GO BP terms are showed in the bar plot of each disease state in each tissue. Each row represents a significant GO biological process which is colored according to the -log10(p.adjust).
ColorectumMSI-HGO analysis - Figure of enriched GO biological processes: Top 15 enriched GO BP terms are showed in the bar plot of each disease state in each tissue. Each row represents a significant GO biological process which is colored according to the -log10(p.adjust).
ColorectumFAPGO analysis - Figure of enriched GO biological processes: Top 15 enriched GO BP terms are showed in the bar plot of each disease state in each tissue. Each row represents a significant GO biological process which is colored according to the -log10(p.adjust).
∗Top 15 enriched GO BP terms are showed in the bar plot of each disease state in each tissue. Each row represents a significant GO biological process which is colored according to the -log10(p.adjust).
Page: 1 2 3 4 5 6 7 8 9 

check button Enriched GO biological processes.
GO IDTissueDisease StageDescriptionGene RatioBg Ratiopvaluep.adjustCount
GO:004586227EsophagusHGINpositive regulation of proteolysis107/2587372/187232.61e-144.60e-12107
GO:004328126EsophagusHGINregulation of cysteine-type endopeptidase activity involved in apoptotic process59/2587209/187233.39e-081.97e-0659
GO:200011626EsophagusHGINregulation of cysteine-type endopeptidase activity63/2587235/187239.71e-085.02e-0663
GO:005254726EsophagusHGINregulation of peptidase activity102/2587461/187236.29e-072.72e-05102
GO:001095225EsophagusHGINpositive regulation of peptidase activity53/2587197/187238.70e-073.59e-0553
GO:005254826EsophagusHGINregulation of endopeptidase activity96/2587432/187231.09e-064.30e-0596
GO:004328020EsophagusHGINpositive regulation of cysteine-type endopeptidase activity involved in apoptotic process38/2587129/187232.92e-061.01e-0438
GO:200105620EsophagusHGINpositive regulation of cysteine-type endopeptidase activity41/2587148/187236.65e-062.07e-0441
GO:001095020EsophagusHGINpositive regulation of endopeptidase activity47/2587179/187237.23e-062.20e-0447
GO:00069197EsophagusHGINactivation of cysteine-type endopeptidase activity involved in apoptotic process21/258778/187231.65e-031.82e-0221
GO:0045862111EsophagusESCCpositive regulation of proteolysis256/8552372/187237.88e-209.43e-18256
GO:2000116111EsophagusESCCregulation of cysteine-type endopeptidase activity158/8552235/187231.67e-115.90e-10158
GO:0043281111EsophagusESCCregulation of cysteine-type endopeptidase activity involved in apoptotic process143/8552209/187232.12e-117.31e-10143
GO:0010952111EsophagusESCCpositive regulation of peptidase activity133/8552197/187234.31e-101.14e-08133
GO:0052547111EsophagusESCCregulation of peptidase activity275/8552461/187237.54e-101.88e-08275
GO:0052548111EsophagusESCCregulation of endopeptidase activity253/8552432/187233.68e-086.78e-07253
GO:0010950111EsophagusESCCpositive regulation of endopeptidase activity116/8552179/187231.77e-072.79e-06116
GO:0043280110EsophagusESCCpositive regulation of cysteine-type endopeptidase activity involved in apoptotic process84/8552129/187236.38e-066.55e-0584
GO:2001056110EsophagusESCCpositive regulation of cysteine-type endopeptidase activity94/8552148/187238.87e-068.59e-0594
GO:000691915EsophagusESCCactivation of cysteine-type endopeptidase activity involved in apoptotic process54/855278/187232.17e-051.87e-0454
Page: 1 2 3 4 5 

check button Enriched KEGG pathways.
Pathway IDTissueDisease StageDescriptionGene RatioBg Ratiopvaluep.adjustqvalueCount
Page: 1 

Top

Cell-cell communication analysis

check buttonIdentification of potential cell-cell interactions between two cell types and their ligand-receptor pairs for different disease states
LigandReceptorLRpairPathwayTissueDisease Stage
Page: 1 

Top

Single-cell gene regulatory network inference analysis

check buttonFind out the significant the regulons (TFs) and the target genes of each regulon across cell types for different disease states
TFCell TypeTissueDisease StageTarget GeneRSSRegulon Activity
∗The dot plots of a searched regulon are shown for all cell subpopulations in each disease state of each tissue based on the regulon specific score inferred using pySCENIC and by calculating the average expression.
Page: 1 

Top

Somatic mutation of malignant transformation related genes

check buttonAnnotation of somatic variants for genes involved in malignant transformation
Hugo SymbolVariant ClassVariant ClassificationdbSNP RSHGVScHGVSpHGVSp ShortSWISSPROTBIOTYPESIFTPolyPhenTumor Sample BarcodeTissueHistologySexAgeStageTherapy TypesDrugsOutcome
PDCD2SNVMissense_Mutationnovelc.335N>Ap.Pro112Hisp.P112HQ16342protein_codingdeleterious(0)probably_damaging(0.996)TCGA-AO-A128-01Breastbreast invasive carcinomaFemale<65I/IIChemotherapydoxorubicinSD
PDCD2SNVMissense_Mutationnovelc.416N>Ap.Gly139Aspp.G139DQ16342protein_codingdeleterious(0)probably_damaging(1)TCGA-S3-AA0Z-01Breastbreast invasive carcinomaFemale<65I/IIAncillaryneulastaCR
PDCD2insertionFrame_Shift_Insnovelc.363_364insTCTGTTTCTCGGGTCGGp.Glu122SerfsTer26p.E122Sfs*26Q16342protein_codingTCGA-A8-A06P-01Breastbreast invasive carcinomaFemale<65III/IVUnspecificSD
PDCD2insertionFrame_Shift_Insnovelc.362_363insTAAGTTCCTCTGGGTCGCAGp.Glu122LysfsTer27p.E122Kfs*27Q16342protein_codingTCGA-A8-A06P-01Breastbreast invasive carcinomaFemale<65III/IVUnspecificSD
PDCD2insertionFrame_Shift_Insnovelc.445_446insATATTTTp.Cys149TyrfsTer23p.C149Yfs*23Q16342protein_codingTCGA-B6-A0IK-01Breastbreast invasive carcinomaFemale<65III/IVUnknownUnknownPD
PDCD2SNVMissense_Mutationnovelc.724C>Gp.Gln242Glup.Q242EQ16342protein_codingtolerated(0.06)benign(0.068)TCGA-EA-A1QS-01Cervixcervical & endocervical cancerFemale<65I/IIUnknownUnknownSD
PDCD2SNVMissense_Mutationnovelc.635A>Gp.Tyr212Cysp.Y212CQ16342protein_codingtolerated(0.11)benign(0.202)TCGA-VS-A9U6-01Cervixcervical & endocervical cancerFemale<65I/IIChemotherapycisplatinPD
PDCD2SNVMissense_Mutationc.1027N>Gp.Thr343Alap.T343AQ16342protein_codingtolerated(0.16)benign(0.006)TCGA-AA-3811-01Colorectumcolon adenocarcinomaFemale>=65III/IVUnknownUnknownPD
PDCD2SNVMissense_Mutationc.394N>Ap.Ala132Thrp.A132TQ16342protein_codingtolerated(0.2)benign(0.018)TCGA-AD-A5EJ-01Colorectumcolon adenocarcinomaFemale>=65I/IIUnknownUnknownSD
PDCD2SNVMissense_Mutationnovelc.389N>Tp.Ser130Phep.S130FQ16342protein_codingdeleterious(0.04)benign(0.052)TCGA-A5-A0G2-01Endometriumuterine corpus endometrioid carcinomaFemale<65III/IVUnknownUnknownSD
Page: 1 2 3 

Top

Related drugs of malignant transformation related genes

check buttonIdentification of chemicals and drugs interact with genes involved in malignant transfromation
(DGIdb 4.0)
Entrez IDSymbolCategoryInteraction TypesDrug Claim NameDrug NamePMIDs
Page: 1