
|
|||||
|
 | |
| |
| |
| |
| |
| |
|
Gene: PDCD10 |
Gene summary for PDCD10 |
| Gene information | Species | Human | Gene symbol | PDCD10 | Gene ID | 11235 |
| Gene name | programmed cell death 10 | |
| Gene Alias | CCM3 | |
| Cytomap | 3q26.1 | |
| Gene Type | protein-coding | GO ID | GO:0000165 | UniProtAcc | Q9BUL8 |
Top |
Malignant transformation analysis |
| Identification of the aberrant gene expression in precancerous and cancerous lesions by comparing the gene expression of stem-like cells in diseased tissues with normal stem cells |
| Entrez ID | Symbol | Replicates | Species | Organ | Tissue | Adj P-value | Log2FC | Malignancy |
| 11235 | PDCD10 | CA_HPV_2 | Human | Cervix | CC | 5.33e-12 | 5.17e-01 | 0.0391 |
| 11235 | PDCD10 | CCI_2 | Human | Cervix | CC | 1.03e-06 | 8.51e-01 | 0.5249 |
| 11235 | PDCD10 | CCII_1 | Human | Cervix | CC | 3.09e-02 | -3.18e-01 | 0.3249 |
| 11235 | PDCD10 | Tumor | Human | Cervix | CC | 2.28e-09 | 3.62e-01 | 0.1241 |
| 11235 | PDCD10 | sample3 | Human | Cervix | CC | 2.28e-15 | 4.11e-01 | 0.1387 |
| 11235 | PDCD10 | L1 | Human | Cervix | CC | 7.76e-03 | 2.29e-01 | 0.0802 |
| 11235 | PDCD10 | T3 | Human | Cervix | CC | 8.20e-16 | 4.43e-01 | 0.1389 |
| 11235 | PDCD10 | LZE2T | Human | Esophagus | ESCC | 4.59e-08 | 1.12e+00 | 0.082 |
| 11235 | PDCD10 | LZE4T | Human | Esophagus | ESCC | 6.61e-24 | 1.02e+00 | 0.0811 |
| 11235 | PDCD10 | LZE5T | Human | Esophagus | ESCC | 8.67e-06 | 8.32e-01 | 0.0514 |
| 11235 | PDCD10 | LZE7T | Human | Esophagus | ESCC | 1.87e-10 | 8.76e-01 | 0.0667 |
| 11235 | PDCD10 | LZE8T | Human | Esophagus | ESCC | 4.97e-13 | 6.12e-01 | 0.067 |
| 11235 | PDCD10 | LZE20T | Human | Esophagus | ESCC | 3.38e-12 | 4.49e-01 | 0.0662 |
| 11235 | PDCD10 | LZE22T | Human | Esophagus | ESCC | 4.13e-02 | 5.93e-01 | 0.068 |
| 11235 | PDCD10 | LZE24T | Human | Esophagus | ESCC | 3.11e-35 | 1.24e+00 | 0.0596 |
| 11235 | PDCD10 | LZE21T | Human | Esophagus | ESCC | 5.29e-10 | 9.09e-01 | 0.0655 |
| 11235 | PDCD10 | LZE6T | Human | Esophagus | ESCC | 1.37e-15 | 9.87e-01 | 0.0845 |
| 11235 | PDCD10 | P1T-E | Human | Esophagus | ESCC | 1.78e-14 | 9.90e-01 | 0.0875 |
| 11235 | PDCD10 | P2T-E | Human | Esophagus | ESCC | 1.05e-66 | 1.34e+00 | 0.1177 |
| 11235 | PDCD10 | P4T-E | Human | Esophagus | ESCC | 2.62e-66 | 1.83e+00 | 0.1323 |
| Page: 1 2 3 4 5 6 7 |
| Tissue | Expression Dynamics | Abbreviation |
| Cervix |  | CC: Cervix cancer |
| HSIL_HPV: HPV-infected high-grade squamous intraepithelial lesions | ||
| N_HPV: HPV-infected normal cervix | ||
| Esophagus | 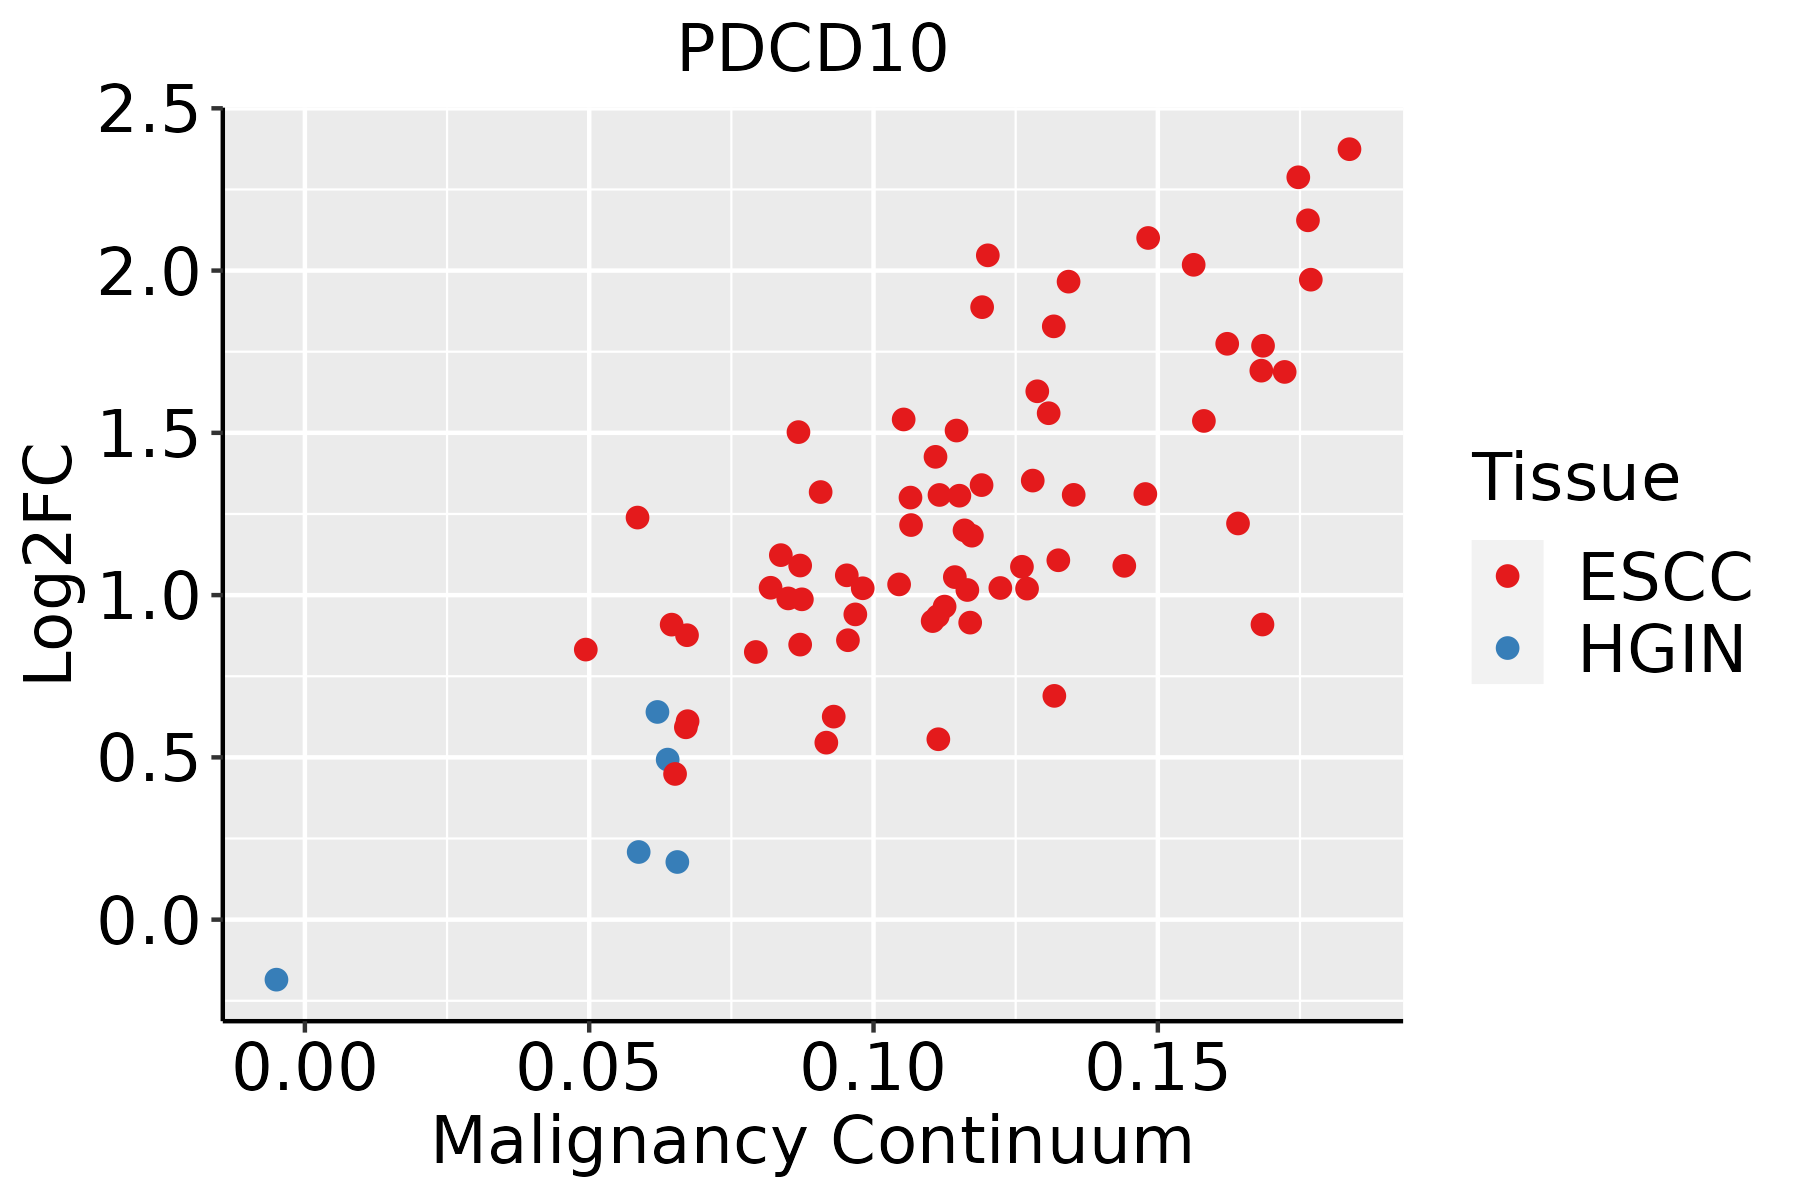 | ESCC: Esophageal squamous cell carcinoma |
| HGIN: High-grade intraepithelial neoplasias | ||
| LGIN: Low-grade intraepithelial neoplasias | ||
| Liver | 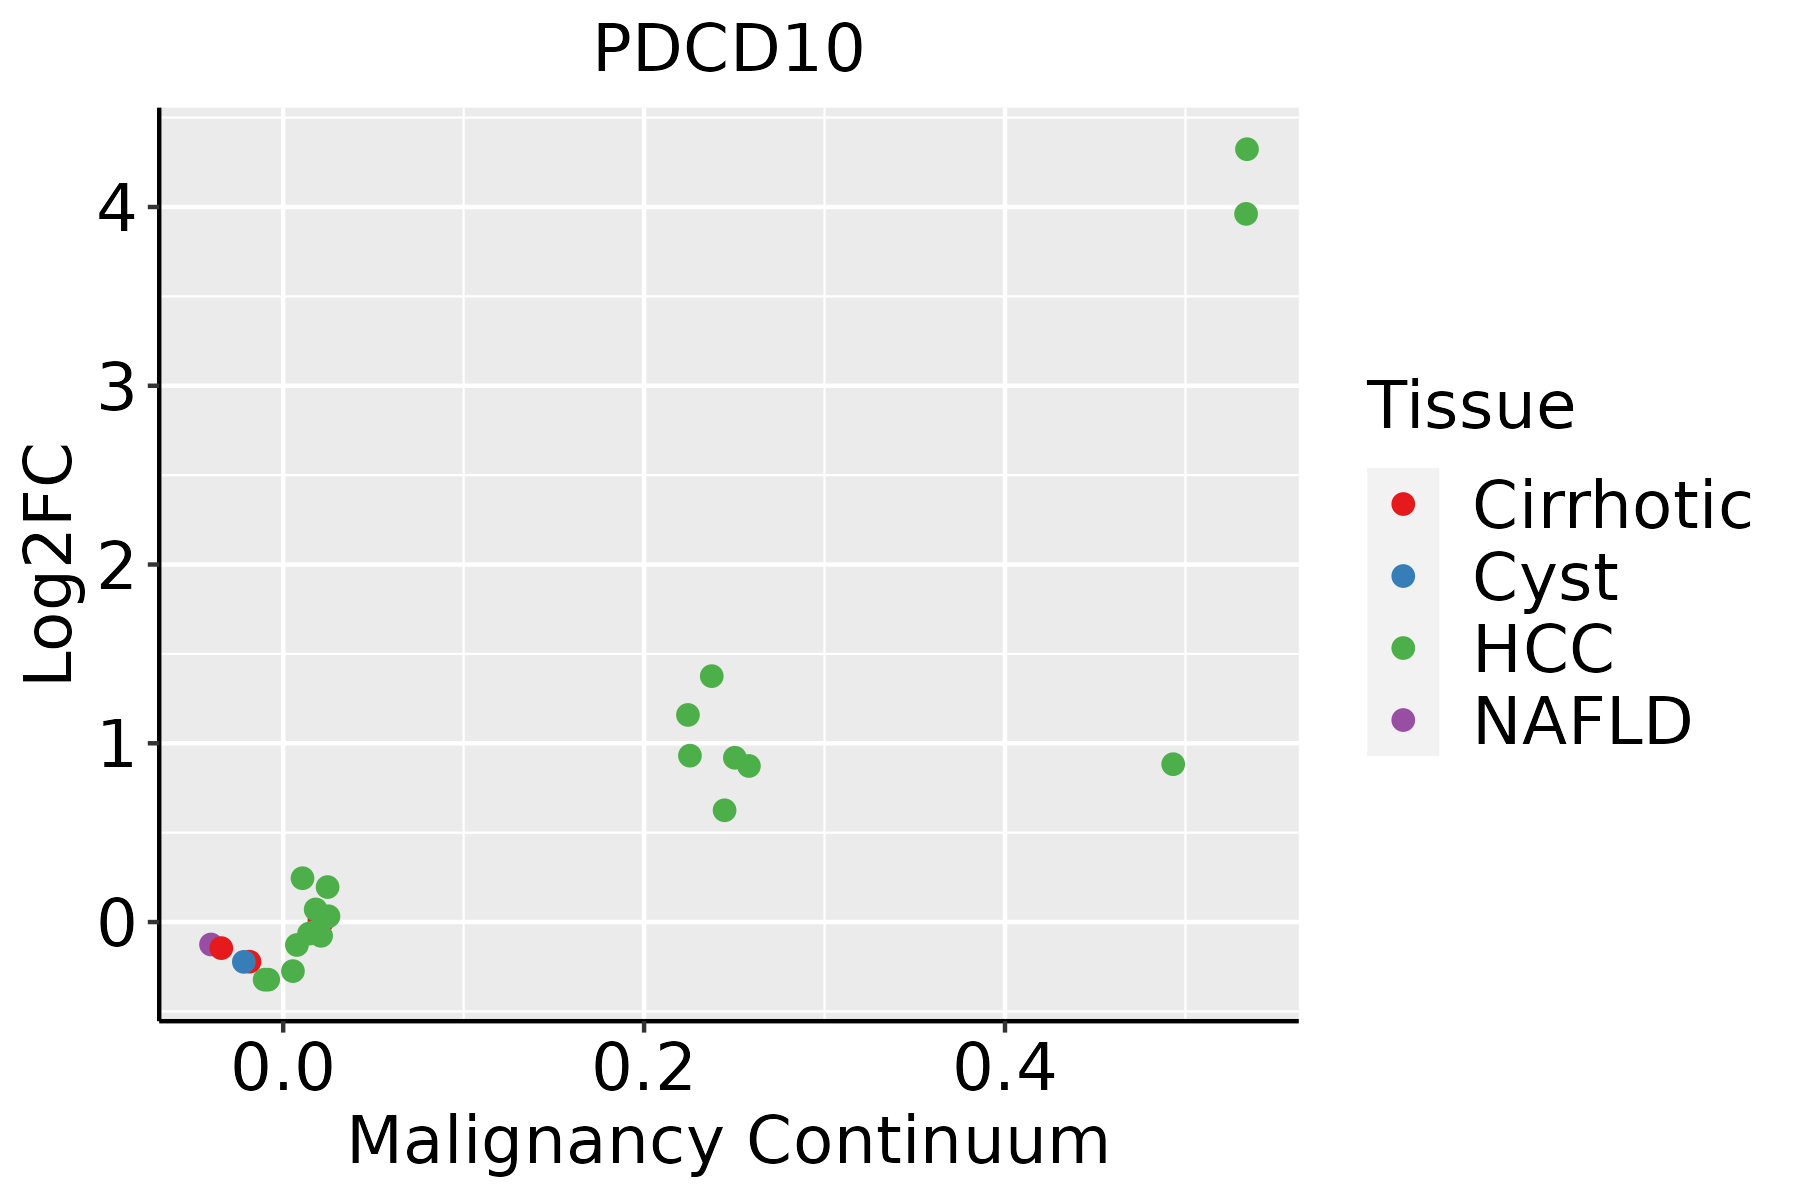 | HCC: Hepatocellular carcinoma |
| NAFLD: Non-alcoholic fatty liver disease | ||
| Oral Cavity |  | EOLP: Erosive Oral lichen planus |
| LP: leukoplakia | ||
| NEOLP: Non-erosive oral lichen planus | ||
| OSCC: Oral squamous cell carcinoma | ||
| Skin | 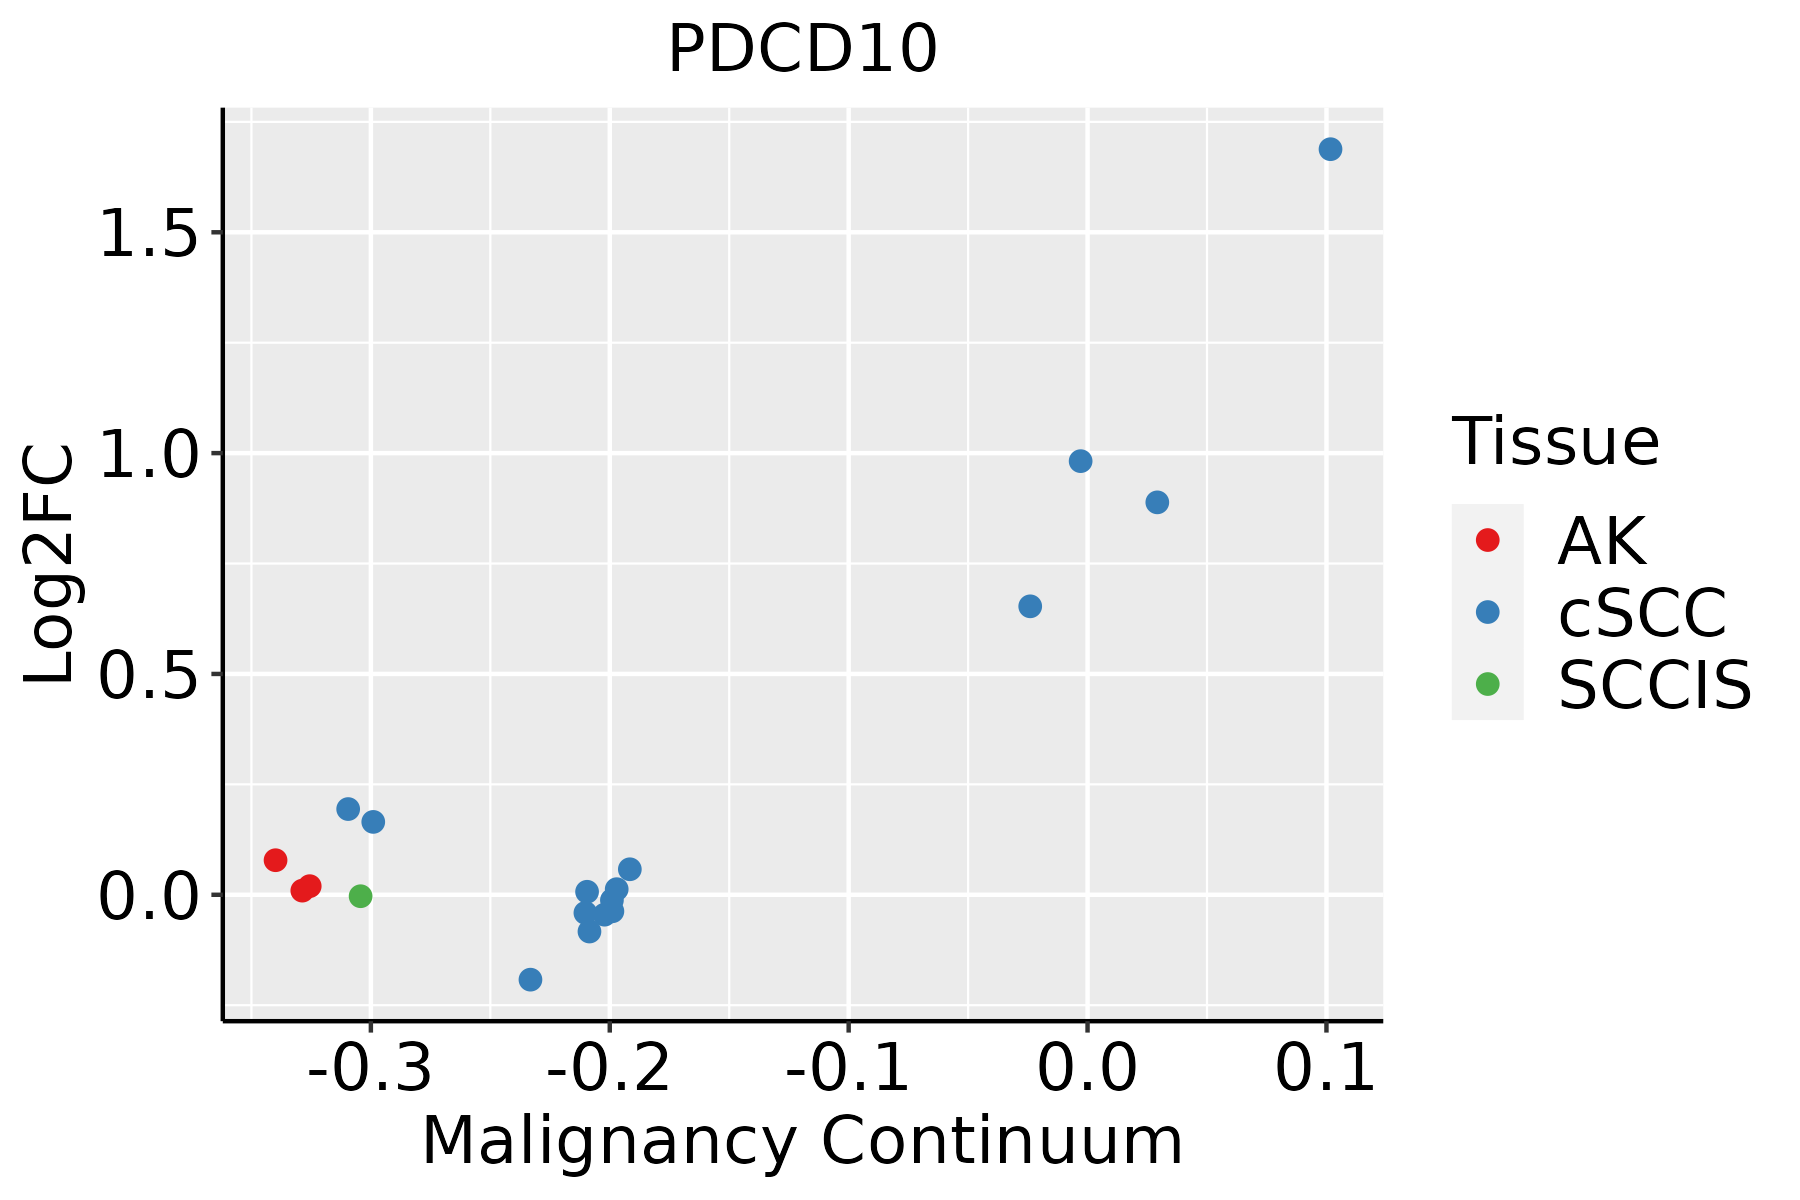 | AK: Actinic keratosis |
| cSCC: Cutaneous squamous cell carcinoma | ||
| SCCIS:squamous cell carcinoma in situ | ||
| Thyroid | 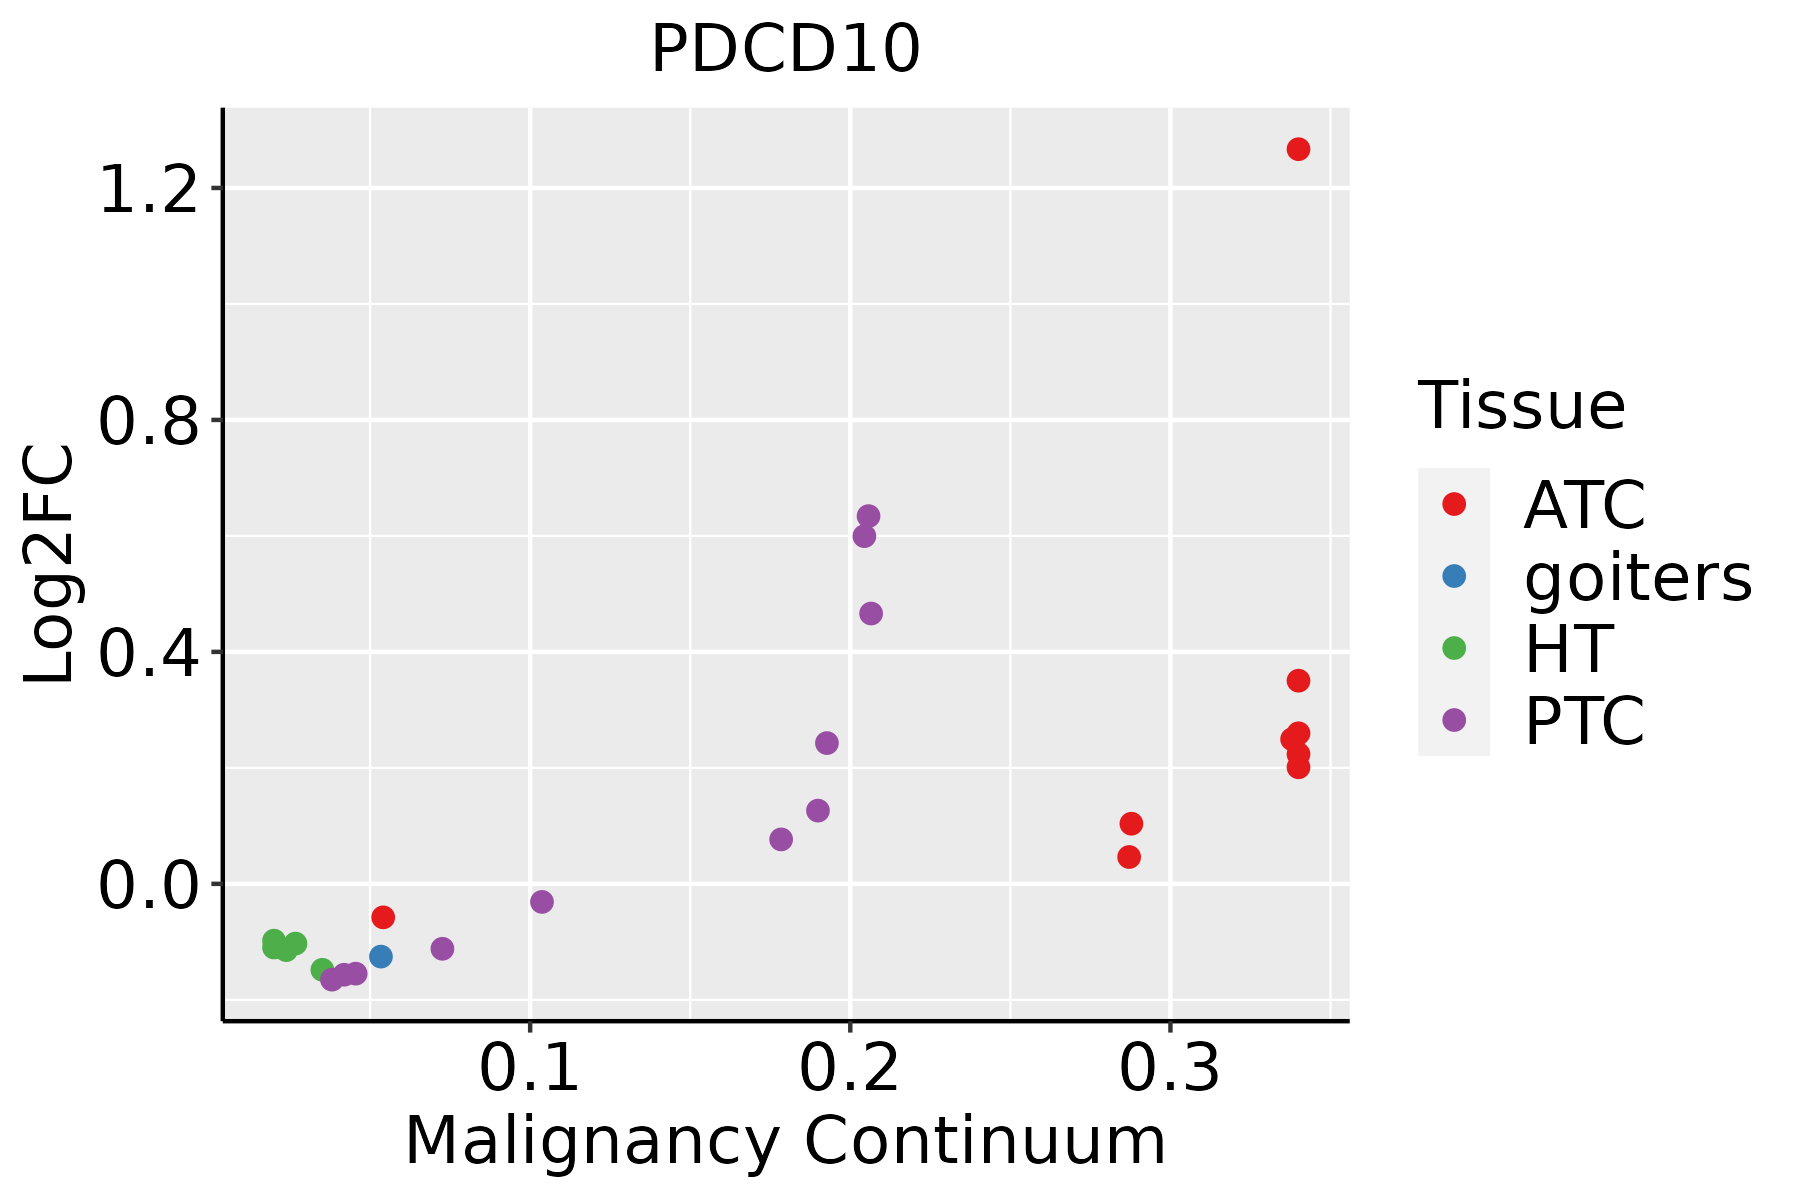 | ATC: Anaplastic thyroid cancer |
| HT: Hashimoto's thyroiditis | ||
| PTC: Papillary thyroid cancer |
| ∗log2FC in expression of this searched gene in stem-like cells from each diseased tissue sample relative to stem-like cells in normal samples in each tissue plotted against the malignancy continuum. Samples are colored based on if they are from different disease stage. |
Top |
Malignant transformation related pathway analysis |
| Find out the enriched GO biological processes and KEGG pathways involved in transition from healthy to precancer to cancer |
| Tissue | Disease Stage | Enriched GO biological Processes |
| Colorectum | AD |  |
| Colorectum | SER |  |
| Colorectum | MSS |  |
| Colorectum | MSI-H |  |
| Colorectum | FAP |  |
| ∗Top 15 enriched GO BP terms are showed in the bar plot of each disease state in each tissue. Each row represents a significant GO biological process which is colored according to the -log10(p.adjust). |
| Page: 1 2 3 4 5 6 7 8 9 |
| GO ID | Tissue | Disease Stage | Description | Gene Ratio | Bg Ratio | pvalue | p.adjust | Count |
| GO:009719310 | Cervix | CC | intrinsic apoptotic signaling pathway | 85/2311 | 288/18723 | 4.56e-15 | 6.46e-12 | 85 |
| GO:004206010 | Cervix | CC | wound healing | 109/2311 | 422/18723 | 1.84e-14 | 1.57e-11 | 109 |
| GO:009013210 | Cervix | CC | epithelium migration | 90/2311 | 360/18723 | 2.45e-11 | 6.11e-09 | 90 |
| GO:00016679 | Cervix | CC | ameboidal-type cell migration | 110/2311 | 475/18723 | 2.66e-11 | 6.36e-09 | 110 |
| GO:001063110 | Cervix | CC | epithelial cell migration | 89/2311 | 357/18723 | 3.72e-11 | 8.54e-09 | 89 |
| GO:009013010 | Cervix | CC | tissue migration | 90/2311 | 365/18723 | 5.42e-11 | 1.05e-08 | 90 |
| GO:000697910 | Cervix | CC | response to oxidative stress | 102/2311 | 446/18723 | 2.99e-10 | 4.36e-08 | 102 |
| GO:00506737 | Cervix | CC | epithelial cell proliferation | 98/2311 | 437/18723 | 2.01e-09 | 2.15e-07 | 98 |
| GO:001063210 | Cervix | CC | regulation of epithelial cell migration | 72/2311 | 292/18723 | 4.52e-09 | 4.43e-07 | 72 |
| GO:003367410 | Cervix | CC | positive regulation of kinase activity | 101/2311 | 467/18723 | 8.66e-09 | 7.22e-07 | 101 |
| GO:005122210 | Cervix | CC | positive regulation of protein transport | 72/2311 | 303/18723 | 2.36e-08 | 1.70e-06 | 72 |
| GO:00458608 | Cervix | CC | positive regulation of protein kinase activity | 85/2311 | 386/18723 | 5.61e-08 | 3.29e-06 | 85 |
| GO:190495110 | Cervix | CC | positive regulation of establishment of protein localization | 73/2311 | 319/18723 | 9.69e-08 | 5.25e-06 | 73 |
| GO:00443193 | Cervix | CC | wound healing, spreading of cells | 17/2311 | 34/18723 | 9.86e-08 | 5.25e-06 | 17 |
| GO:00905053 | Cervix | CC | epiboly involved in wound healing | 17/2311 | 34/18723 | 9.86e-08 | 5.25e-06 | 17 |
| GO:000030210 | Cervix | CC | response to reactive oxygen species | 56/2311 | 222/18723 | 1.00e-07 | 5.25e-06 | 56 |
| GO:006219710 | Cervix | CC | cellular response to chemical stress | 76/2311 | 337/18723 | 1.01e-07 | 5.25e-06 | 76 |
| GO:00506787 | Cervix | CC | regulation of epithelial cell proliferation | 83/2311 | 381/18723 | 1.31e-07 | 6.42e-06 | 83 |
| GO:00905043 | Cervix | CC | epiboly | 17/2311 | 35/18723 | 1.70e-07 | 7.93e-06 | 17 |
| GO:004254210 | Cervix | CC | response to hydrogen peroxide | 40/2311 | 146/18723 | 6.79e-07 | 2.46e-05 | 40 |
| Page: 1 2 3 4 5 6 7 8 9 10 11 12 13 14 15 16 17 18 19 20 21 22 |
| Pathway ID | Tissue | Disease Stage | Description | Gene Ratio | Bg Ratio | pvalue | p.adjust | qvalue | Count |
| hsa0452020 | Cervix | CC | Adherens junction | 33/1267 | 93/8465 | 6.99e-07 | 7.31e-06 | 4.32e-06 | 33 |
| hsa04520110 | Cervix | CC | Adherens junction | 33/1267 | 93/8465 | 6.99e-07 | 7.31e-06 | 4.32e-06 | 33 |
| hsa0452030 | Esophagus | ESCC | Adherens junction | 69/4205 | 93/8465 | 1.08e-06 | 6.83e-06 | 3.50e-06 | 69 |
| hsa04520114 | Esophagus | ESCC | Adherens junction | 69/4205 | 93/8465 | 1.08e-06 | 6.83e-06 | 3.50e-06 | 69 |
| hsa0452022 | Liver | Cirrhotic | Adherens junction | 52/2530 | 93/8465 | 1.36e-07 | 1.97e-06 | 1.21e-06 | 52 |
| hsa0452032 | Liver | Cirrhotic | Adherens junction | 52/2530 | 93/8465 | 1.36e-07 | 1.97e-06 | 1.21e-06 | 52 |
| hsa0452042 | Liver | HCC | Adherens junction | 68/4020 | 93/8465 | 3.99e-07 | 4.46e-06 | 2.48e-06 | 68 |
| hsa0452052 | Liver | HCC | Adherens junction | 68/4020 | 93/8465 | 3.99e-07 | 4.46e-06 | 2.48e-06 | 68 |
| hsa0452029 | Oral cavity | OSCC | Adherens junction | 62/3704 | 93/8465 | 6.34e-06 | 3.12e-05 | 1.59e-05 | 62 |
| hsa04520113 | Oral cavity | OSCC | Adherens junction | 62/3704 | 93/8465 | 6.34e-06 | 3.12e-05 | 1.59e-05 | 62 |
| Page: 1 |
Top |
Cell-cell communication analysis |
| Identification of potential cell-cell interactions between two cell types and their ligand-receptor pairs for different disease states |
| Ligand | Receptor | LRpair | Pathway | Tissue | Disease Stage |
| Page: 1 |
Top |
Single-cell gene regulatory network inference analysis |
| Find out the significant the regulons (TFs) and the target genes of each regulon across cell types for different disease states |
| TF | Cell Type | Tissue | Disease Stage | Target Gene | RSS | Regulon Activity |
| ∗The dot plots of a searched regulon are shown for all cell subpopulations in each disease state of each tissue based on the regulon specific score inferred using pySCENIC and by calculating the average expression. |
| Page: 1 |
Top |
Somatic mutation of malignant transformation related genes |
| Annotation of somatic variants for genes involved in malignant transformation |
| Hugo Symbol | Variant Class | Variant Classification | dbSNP RS | HGVSc | HGVSp | HGVSp Short | SWISSPROT | BIOTYPE | SIFT | PolyPhen | Tumor Sample Barcode | Tissue | Histology | Sex | Age | Stage | Therapy Types | Drugs | Outcome |
| PDCD10 | SNV | Missense_Mutation | c.487C>A | p.Gln163Lys | p.Q163K | Q9BUL8 | protein_coding | tolerated(0.15) | benign(0) | TCGA-A8-A09Z-01 | Breast | breast invasive carcinoma | Female | >=65 | I/II | Unknown | Unknown | SD | |
| PDCD10 | SNV | Missense_Mutation | c.24N>A | p.Met8Ile | p.M8I | Q9BUL8 | protein_coding | tolerated(0.08) | benign(0.352) | TCGA-AC-A23H-01 | Breast | breast invasive carcinoma | Female | >=65 | I/II | Unknown | Unknown | PD | |
| PDCD10 | SNV | Missense_Mutation | c.21N>C | p.Glu7Asp | p.E7D | Q9BUL8 | protein_coding | tolerated_low_confidence(0.61) | possibly_damaging(0.836) | TCGA-AR-A24U-01 | Breast | breast invasive carcinoma | Female | <65 | I/II | Chemotherapy | doxorubicin | SD | |
| PDCD10 | SNV | Missense_Mutation | novel | c.428N>G | p.Asp143Gly | p.D143G | Q9BUL8 | protein_coding | tolerated(0.07) | benign(0.155) | TCGA-EA-A3HU-01 | Cervix | cervical & endocervical cancer | Female | <65 | I/II | Unknown | Unknown | SD |
| PDCD10 | SNV | Missense_Mutation | c.200T>C | p.Leu67Ser | p.L67S | Q9BUL8 | protein_coding | tolerated(0.06) | probably_damaging(0.983) | TCGA-AA-3506-01 | Colorectum | colon adenocarcinoma | Male | >=65 | I/II | Unknown | Unknown | SD | |
| PDCD10 | SNV | Missense_Mutation | novel | c.400N>G | p.Ile134Val | p.I134V | Q9BUL8 | protein_coding | tolerated(0.06) | benign(0.119) | TCGA-A5-A0G1-01 | Endometrium | uterine corpus endometrioid carcinoma | Female | >=65 | I/II | Unknown | Unknown | SD |
| PDCD10 | SNV | Missense_Mutation | rs756441925 | c.284N>A | p.Arg95Gln | p.R95Q | Q9BUL8 | protein_coding | deleterious(0) | benign(0.205) | TCGA-A5-A0G2-01 | Endometrium | uterine corpus endometrioid carcinoma | Female | <65 | III/IV | Unknown | Unknown | SD |
| PDCD10 | SNV | Missense_Mutation | novel | c.634N>A | p.Ala212Thr | p.A212T | Q9BUL8 | protein_coding | tolerated_low_confidence(0.1) | possibly_damaging(0.869) | TCGA-A5-A1OF-01 | Endometrium | uterine corpus endometrioid carcinoma | Female | <65 | I/II | Unknown | Unknown | SD |
| PDCD10 | SNV | Missense_Mutation | novel | c.195N>C | p.Lys65Asn | p.K65N | Q9BUL8 | protein_coding | deleterious(0.04) | benign(0.322) | TCGA-A5-A2K5-01 | Endometrium | uterine corpus endometrioid carcinoma | Female | >=65 | I/II | Unknown | Unknown | SD |
| PDCD10 | SNV | Missense_Mutation | rs758197697 | c.313G>A | p.Glu105Lys | p.E105K | Q9BUL8 | protein_coding | tolerated(1) | benign(0.01) | TCGA-AP-A1E0-01 | Endometrium | uterine corpus endometrioid carcinoma | Female | <65 | III/IV | Chemotherapy | paclitaxel | SD |
| Page: 1 2 3 |
Top |
Related drugs of malignant transformation related genes |
| Identification of chemicals and drugs interact with genes involved in malignant transfromation |
| (DGIdb 4.0) |
| Entrez ID | Symbol | Category | Interaction Types | Drug Claim Name | Drug Name | PMIDs |
| Page: 1 |

Copyright 2023-Present -The University of Texas Health Science Center at Houston |