
|
|||||
|
 | |
| |
| |
| |
| |
| |
|
Gene: PCYT2 |
Gene summary for PCYT2 |
| Gene information | Species | Human | Gene symbol | PCYT2 | Gene ID | 5833 |
| Gene name | phosphate cytidylyltransferase 2, ethanolamine | |
| Gene Alias | ET | |
| Cytomap | 17q25.3 | |
| Gene Type | protein-coding | GO ID | GO:0006629 | UniProtAcc | Q99447 |
Top |
Malignant transformation analysis |
| Identification of the aberrant gene expression in precancerous and cancerous lesions by comparing the gene expression of stem-like cells in diseased tissues with normal stem cells |
| Entrez ID | Symbol | Replicates | Species | Organ | Tissue | Adj P-value | Log2FC | Malignancy |
| 5833 | PCYT2 | LZE22D1 | Human | Esophagus | HGIN | 8.65e-03 | 2.43e-01 | 0.0595 |
| 5833 | PCYT2 | LZE24T | Human | Esophagus | ESCC | 1.34e-16 | 4.94e-01 | 0.0596 |
| 5833 | PCYT2 | LZE21T | Human | Esophagus | ESCC | 1.41e-04 | 2.87e-01 | 0.0655 |
| 5833 | PCYT2 | P1T-E | Human | Esophagus | ESCC | 2.63e-12 | 3.52e-01 | 0.0875 |
| 5833 | PCYT2 | P2T-E | Human | Esophagus | ESCC | 5.73e-11 | 2.43e-01 | 0.1177 |
| 5833 | PCYT2 | P4T-E | Human | Esophagus | ESCC | 1.67e-16 | 3.50e-01 | 0.1323 |
| 5833 | PCYT2 | P5T-E | Human | Esophagus | ESCC | 1.02e-16 | 3.52e-01 | 0.1327 |
| 5833 | PCYT2 | P8T-E | Human | Esophagus | ESCC | 2.93e-18 | 3.29e-01 | 0.0889 |
| 5833 | PCYT2 | P9T-E | Human | Esophagus | ESCC | 4.59e-15 | 2.65e-01 | 0.1131 |
| 5833 | PCYT2 | P10T-E | Human | Esophagus | ESCC | 1.44e-19 | 4.03e-01 | 0.116 |
| 5833 | PCYT2 | P11T-E | Human | Esophagus | ESCC | 1.22e-19 | 7.55e-01 | 0.1426 |
| 5833 | PCYT2 | P12T-E | Human | Esophagus | ESCC | 3.78e-14 | 3.20e-01 | 0.1122 |
| 5833 | PCYT2 | P15T-E | Human | Esophagus | ESCC | 7.85e-15 | 3.03e-01 | 0.1149 |
| 5833 | PCYT2 | P16T-E | Human | Esophagus | ESCC | 5.97e-13 | 3.52e-01 | 0.1153 |
| 5833 | PCYT2 | P17T-E | Human | Esophagus | ESCC | 7.27e-05 | 2.25e-01 | 0.1278 |
| 5833 | PCYT2 | P19T-E | Human | Esophagus | ESCC | 2.52e-03 | 3.32e-01 | 0.1662 |
| 5833 | PCYT2 | P20T-E | Human | Esophagus | ESCC | 2.72e-29 | 6.09e-01 | 0.1124 |
| 5833 | PCYT2 | P21T-E | Human | Esophagus | ESCC | 8.68e-30 | 5.73e-01 | 0.1617 |
| 5833 | PCYT2 | P22T-E | Human | Esophagus | ESCC | 1.34e-22 | 4.18e-01 | 0.1236 |
| 5833 | PCYT2 | P23T-E | Human | Esophagus | ESCC | 8.57e-14 | 3.50e-01 | 0.108 |
| Page: 1 2 3 4 5 |
| Tissue | Expression Dynamics | Abbreviation |
| Esophagus | 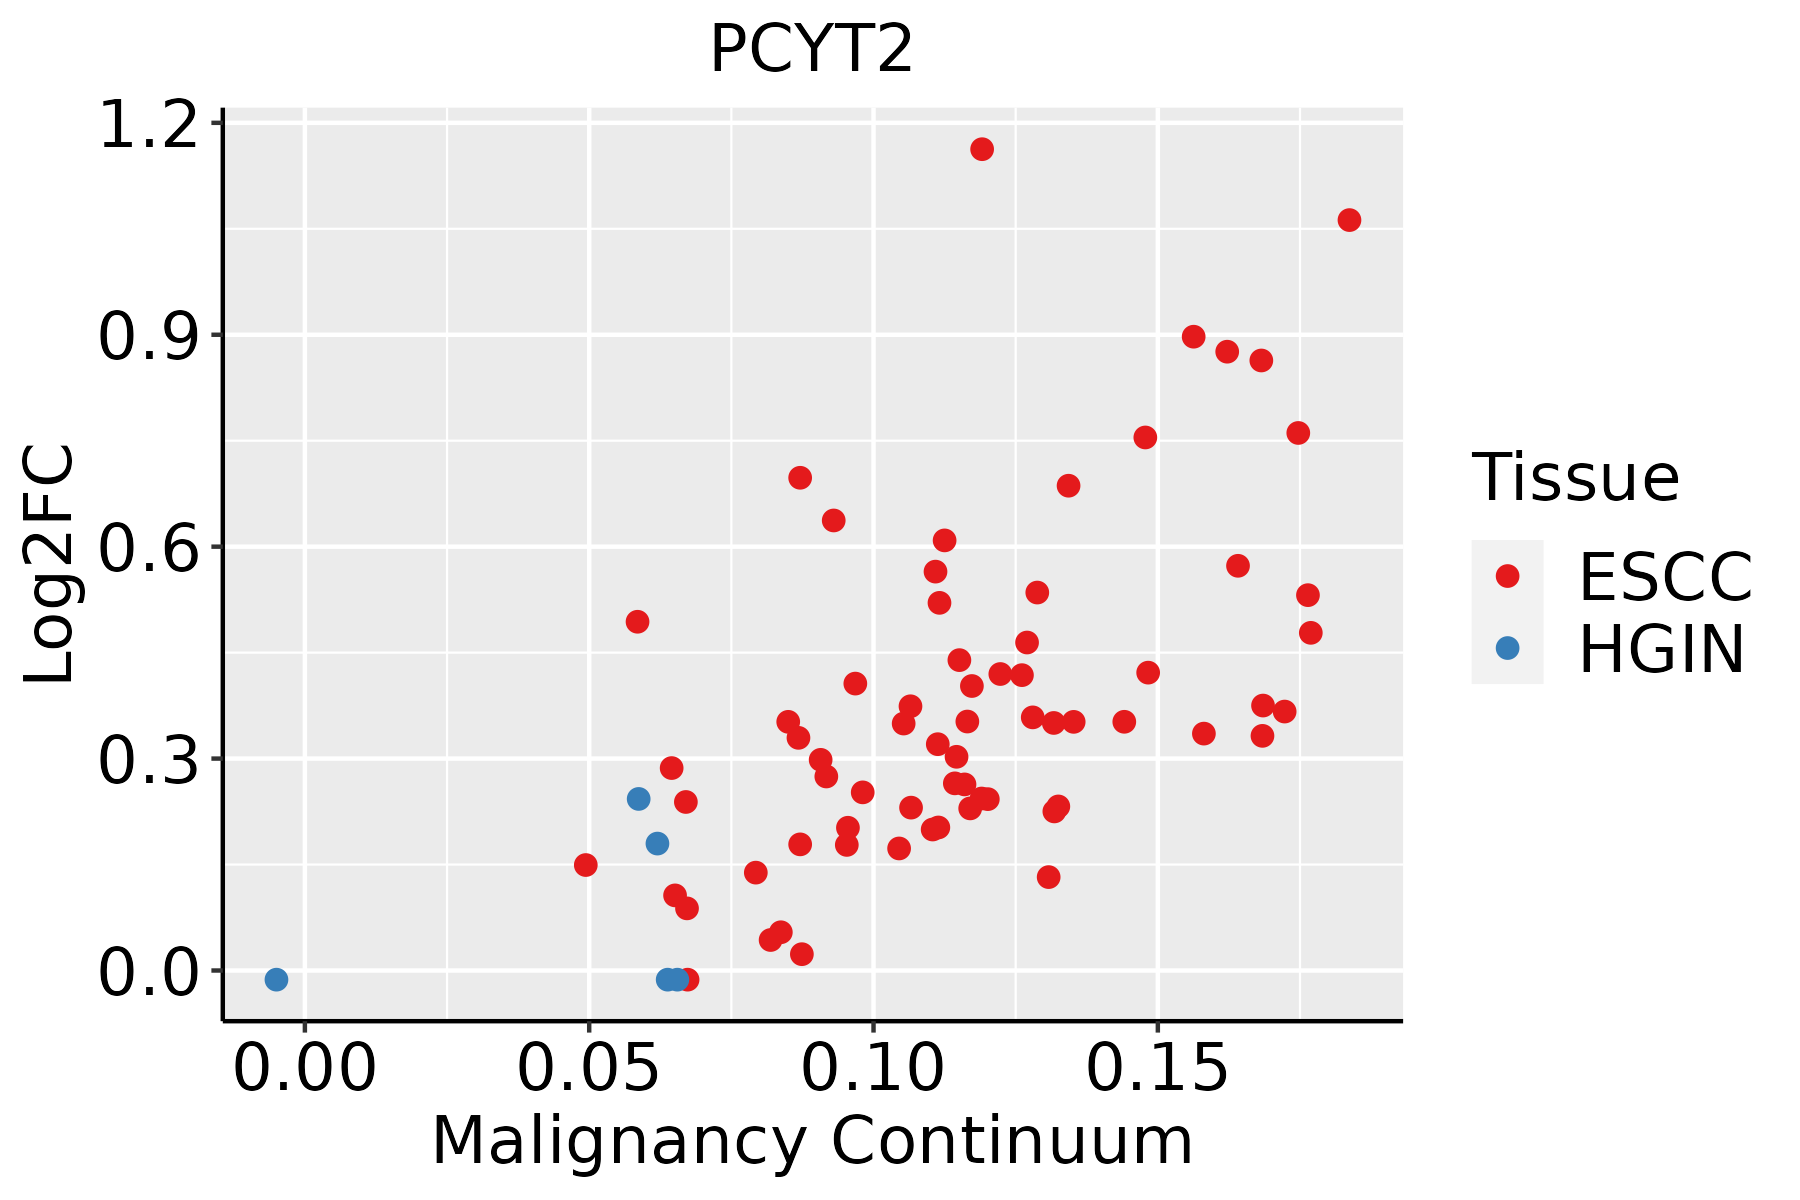 | ESCC: Esophageal squamous cell carcinoma |
| HGIN: High-grade intraepithelial neoplasias | ||
| LGIN: Low-grade intraepithelial neoplasias | ||
| Liver | 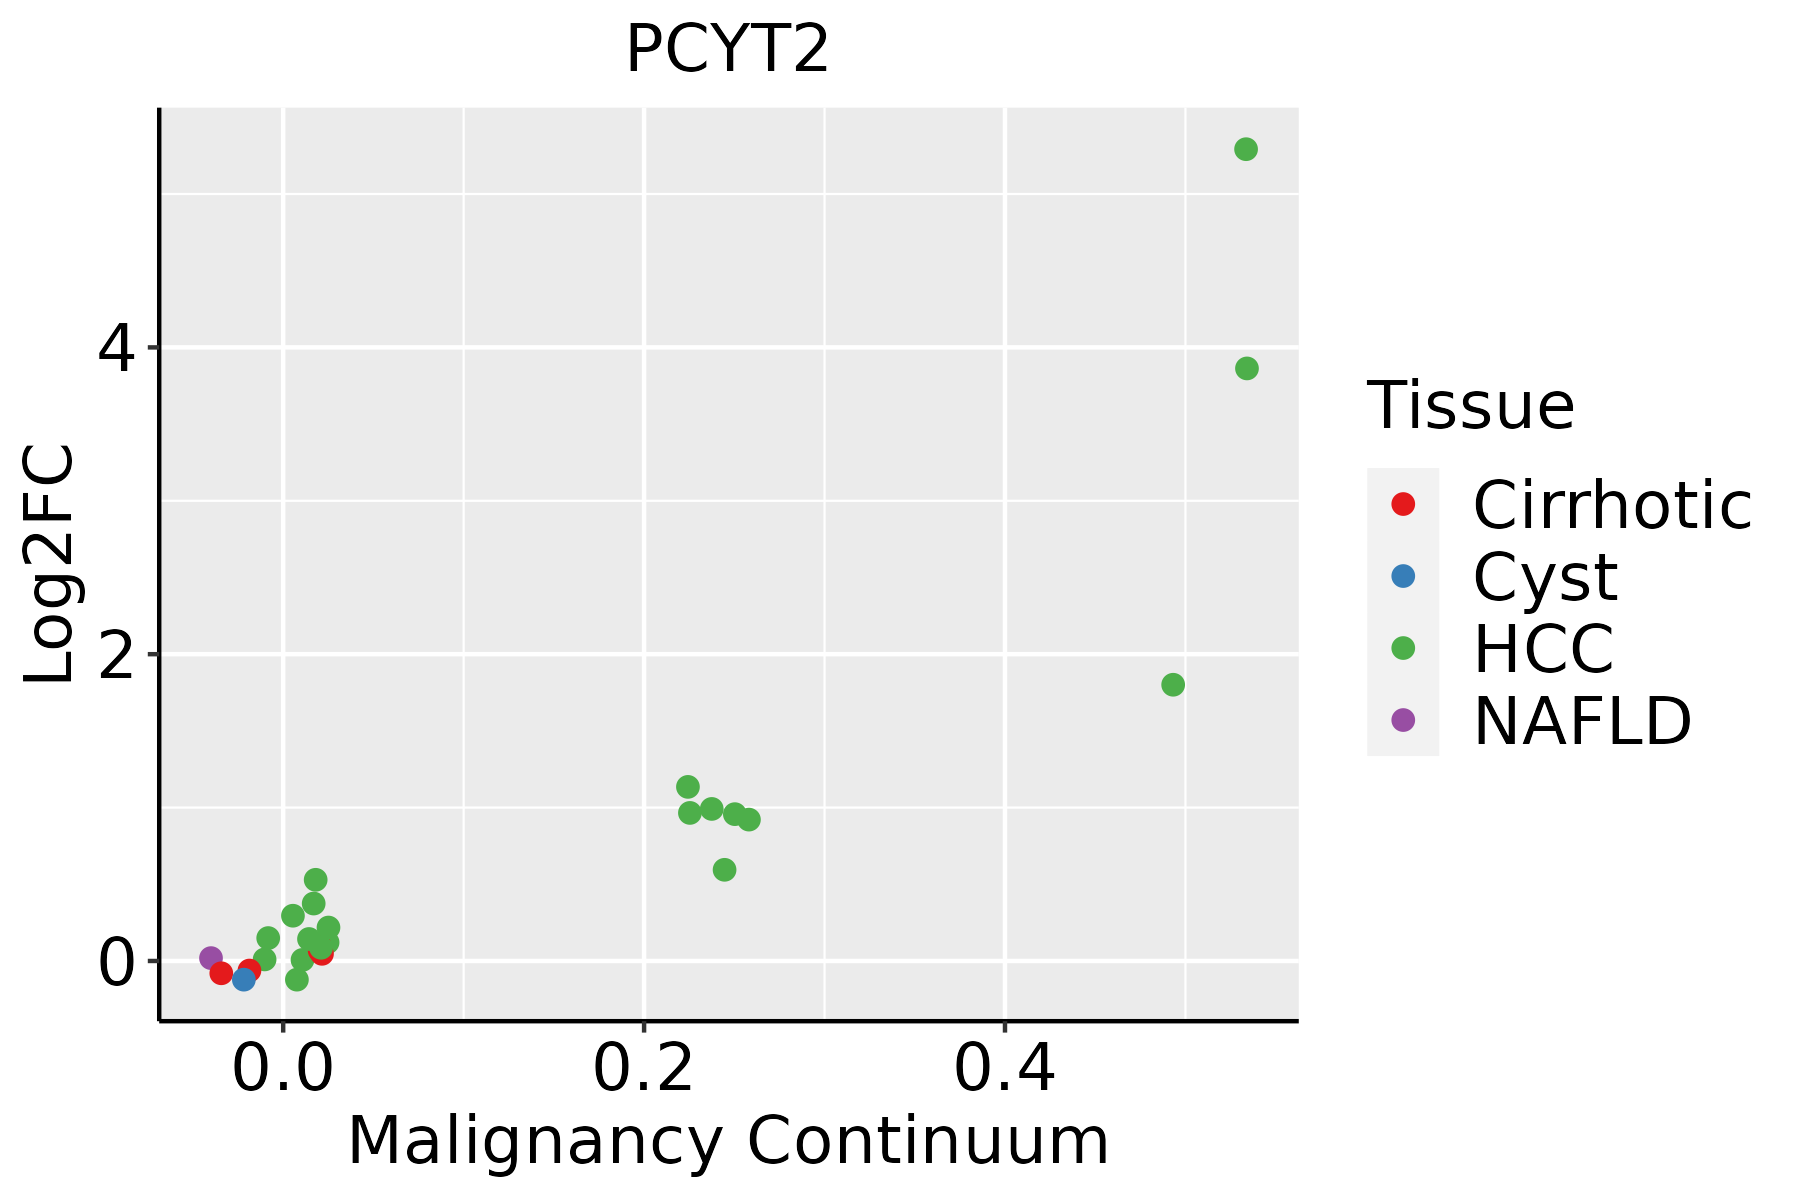 | HCC: Hepatocellular carcinoma |
| NAFLD: Non-alcoholic fatty liver disease | ||
| Oral Cavity | 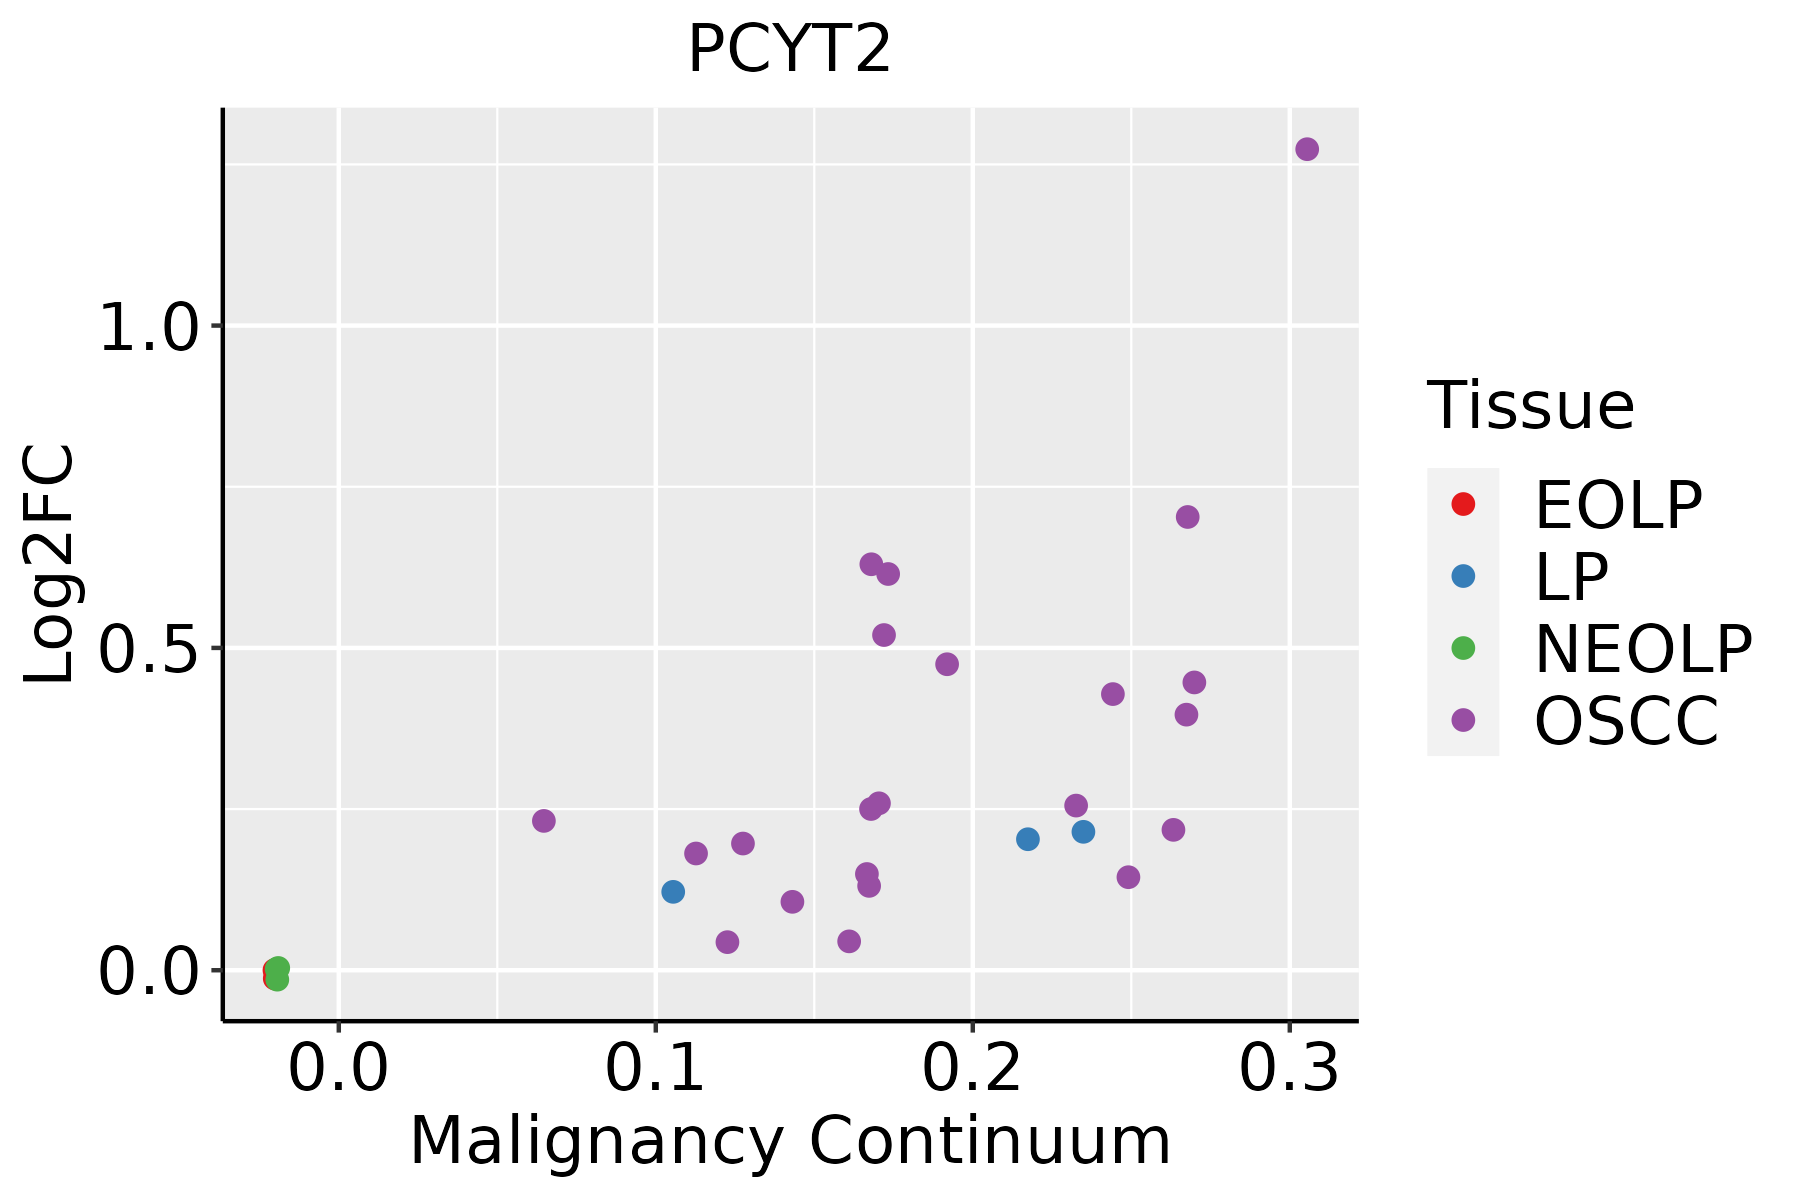 | EOLP: Erosive Oral lichen planus |
| LP: leukoplakia | ||
| NEOLP: Non-erosive oral lichen planus | ||
| OSCC: Oral squamous cell carcinoma | ||
| Skin | 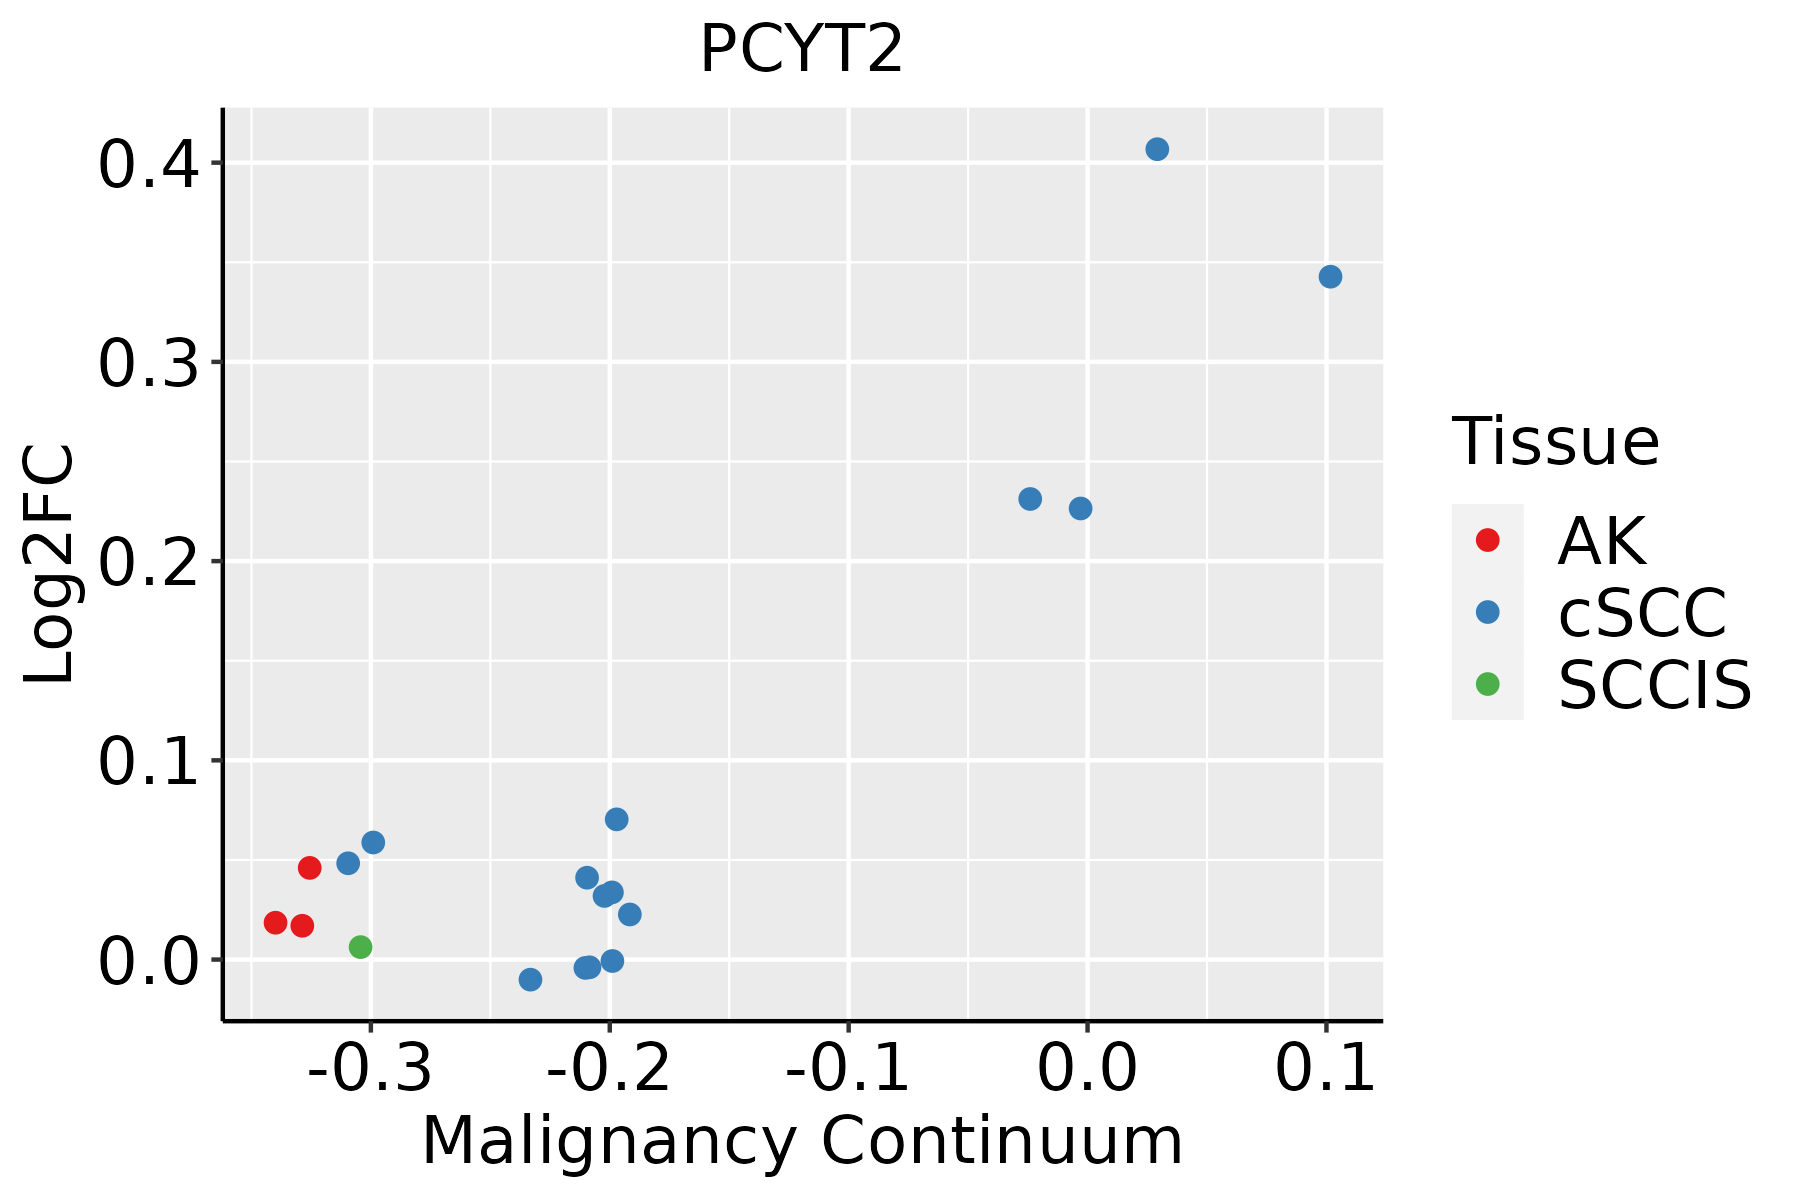 | AK: Actinic keratosis |
| cSCC: Cutaneous squamous cell carcinoma | ||
| SCCIS:squamous cell carcinoma in situ |
| ∗log2FC in expression of this searched gene in stem-like cells from each diseased tissue sample relative to stem-like cells in normal samples in each tissue plotted against the malignancy continuum. Samples are colored based on if they are from different disease stage. |
Top |
Malignant transformation related pathway analysis |
| Find out the enriched GO biological processes and KEGG pathways involved in transition from healthy to precancer to cancer |
| Tissue | Disease Stage | Enriched GO biological Processes |
| Colorectum | AD |  |
| Colorectum | SER |  |
| Colorectum | MSS |  |
| Colorectum | MSI-H |  |
| Colorectum | FAP |  |
| ∗Top 15 enriched GO BP terms are showed in the bar plot of each disease state in each tissue. Each row represents a significant GO biological process which is colored according to the -log10(p.adjust). |
| Page: 1 2 3 4 5 6 7 8 9 |
| GO ID | Tissue | Disease Stage | Description | Gene Ratio | Bg Ratio | pvalue | p.adjust | Count |
| GO:00086544 | Esophagus | ESCC | phospholipid biosynthetic process | 162/8552 | 253/18723 | 2.59e-09 | 5.73e-08 | 162 |
| GO:00464744 | Esophagus | ESCC | glycerophospholipid biosynthetic process | 135/8552 | 211/18723 | 5.75e-08 | 1.02e-06 | 135 |
| GO:00450175 | Esophagus | ESCC | glycerolipid biosynthetic process | 154/8552 | 252/18723 | 5.20e-07 | 6.96e-06 | 154 |
| GO:00066446 | Esophagus | ESCC | phospholipid metabolic process | 218/8552 | 383/18723 | 5.37e-06 | 5.59e-05 | 218 |
| GO:00066505 | Esophagus | ESCC | glycerophospholipid metabolic process | 174/8552 | 306/18723 | 4.92e-05 | 3.85e-04 | 174 |
| GO:0006646 | Esophagus | ESCC | phosphatidylethanolamine biosynthetic process | 10/8552 | 10/18723 | 3.94e-04 | 2.26e-03 | 10 |
| GO:00464864 | Esophagus | ESCC | glycerolipid metabolic process | 211/8552 | 392/18723 | 6.51e-04 | 3.46e-03 | 211 |
| GO:00086542 | Liver | HCC | phospholipid biosynthetic process | 150/7958 | 253/18723 | 4.77e-08 | 1.03e-06 | 150 |
| GO:00066444 | Liver | HCC | phospholipid metabolic process | 214/7958 | 383/18723 | 7.25e-08 | 1.48e-06 | 214 |
| GO:004648611 | Liver | HCC | glycerolipid metabolic process | 215/7958 | 392/18723 | 4.54e-07 | 7.49e-06 | 215 |
| GO:004501711 | Liver | HCC | glycerolipid biosynthetic process | 143/7958 | 252/18723 | 3.27e-06 | 4.31e-05 | 143 |
| GO:00066504 | Liver | HCC | glycerophospholipid metabolic process | 168/7958 | 306/18723 | 7.27e-06 | 8.62e-05 | 168 |
| GO:004647411 | Liver | HCC | glycerophospholipid biosynthetic process | 121/7958 | 211/18723 | 9.12e-06 | 1.06e-04 | 121 |
| GO:00086543 | Oral cavity | OSCC | phospholipid biosynthetic process | 130/7305 | 253/18723 | 3.96e-05 | 3.46e-04 | 130 |
| GO:00464743 | Oral cavity | OSCC | glycerophospholipid biosynthetic process | 102/7305 | 211/18723 | 3.50e-03 | 1.48e-02 | 102 |
| GO:00066445 | Oral cavity | OSCC | phospholipid metabolic process | 175/7305 | 383/18723 | 4.21e-03 | 1.71e-02 | 175 |
| Page: 1 |
| Pathway ID | Tissue | Disease Stage | Description | Gene Ratio | Bg Ratio | pvalue | p.adjust | qvalue | Count |
| Page: 1 |
Top |
Cell-cell communication analysis |
| Identification of potential cell-cell interactions between two cell types and their ligand-receptor pairs for different disease states |
| Ligand | Receptor | LRpair | Pathway | Tissue | Disease Stage |
| Page: 1 |
Top |
Single-cell gene regulatory network inference analysis |
| Find out the significant the regulons (TFs) and the target genes of each regulon across cell types for different disease states |
| TF | Cell Type | Tissue | Disease Stage | Target Gene | RSS | Regulon Activity |
| ∗The dot plots of a searched regulon are shown for all cell subpopulations in each disease state of each tissue based on the regulon specific score inferred using pySCENIC and by calculating the average expression. |
| Page: 1 |
Top |
Somatic mutation of malignant transformation related genes |
| Annotation of somatic variants for genes involved in malignant transformation |
| Hugo Symbol | Variant Class | Variant Classification | dbSNP RS | HGVSc | HGVSp | HGVSp Short | SWISSPROT | BIOTYPE | SIFT | PolyPhen | Tumor Sample Barcode | Tissue | Histology | Sex | Age | Stage | Therapy Types | Drugs | Outcome |
| PCYT2 | SNV | Missense_Mutation | c.702C>G | p.Ile234Met | p.I234M | Q99447 | protein_coding | deleterious(0) | possibly_damaging(0.875) | TCGA-BH-A0AV-01 | Breast | breast invasive carcinoma | Female | <65 | I/II | Chemotherapy | taxotere | CR | |
| PCYT2 | SNV | Missense_Mutation | c.646N>G | p.Gln216Glu | p.Q216E | Q99447 | protein_coding | deleterious(0.02) | benign(0.138) | TCGA-C8-A26Y-01 | Breast | breast invasive carcinoma | Female | >=65 | I/II | Unknown | Unknown | SD | |
| PCYT2 | insertion | Frame_Shift_Ins | novel | c.293_294insC | p.Leu99ThrfsTer10 | p.L99Tfs*10 | Q99447 | protein_coding | TCGA-B6-A0IA-01 | Breast | breast invasive carcinoma | Female | <65 | I/II | Unknown | Unknown | SD | ||
| PCYT2 | insertion | In_Frame_Ins | novel | c.291_292insGAGGGTGACTTCCCTGACCCCAGTCTG | p.Thr97_Thr98insGluGlyAspPheProAspProSerLeu | p.T97_T98insEGDFPDPSL | Q99447 | protein_coding | TCGA-B6-A0IA-01 | Breast | breast invasive carcinoma | Female | <65 | I/II | Unknown | Unknown | SD | ||
| PCYT2 | deletion | Frame_Shift_Del | novel | c.399delG | p.Arg134GlyfsTer23 | p.R134Gfs*23 | Q99447 | protein_coding | TCGA-EW-A2FV-01 | Breast | breast invasive carcinoma | Female | <65 | III/IV | Chemotherapy | docetaxel | SD | ||
| PCYT2 | SNV | Missense_Mutation | c.997N>A | p.Asp333Asn | p.D333N | Q99447 | protein_coding | tolerated(0.06) | benign(0.031) | TCGA-IR-A3LA-01 | Cervix | cervical & endocervical cancer | Female | <65 | I/II | Chemotherapy | cisplatin | CR | |
| PCYT2 | SNV | Missense_Mutation | novel | c.192N>T | p.Lys64Asn | p.K64N | Q99447 | protein_coding | tolerated(0.07) | benign(0.049) | TCGA-AA-A00N-01 | Colorectum | colon adenocarcinoma | Male | >=65 | I/II | Unknown | Unknown | PD |
| PCYT2 | SNV | Missense_Mutation | c.109G>A | p.Gly37Ser | p.G37S | Q99447 | protein_coding | deleterious(0) | probably_damaging(1) | TCGA-CM-4746-01 | Colorectum | colon adenocarcinoma | Male | <65 | I/II | Unknown | Unknown | SD | |
| PCYT2 | SNV | Missense_Mutation | rs374371929 | c.1186N>A | p.Ala396Thr | p.A396T | Q99447 | protein_coding | tolerated(0.49) | benign(0.049) | TCGA-F4-6807-01 | Colorectum | colon adenocarcinoma | Female | <65 | III/IV | Chemotherapy | xeloda | CR |
| PCYT2 | SNV | Missense_Mutation | novel | c.211N>C | p.Phe71Leu | p.F71L | Q99447 | protein_coding | tolerated(0.35) | benign(0.132) | TCGA-F5-6814-01 | Colorectum | rectum adenocarcinoma | Male | <65 | I/II | Unknown | Unknown | SD |
| Page: 1 2 3 4 |
Top |
Related drugs of malignant transformation related genes |
| Identification of chemicals and drugs interact with genes involved in malignant transfromation |
| (DGIdb 4.0) |
| Entrez ID | Symbol | Category | Interaction Types | Drug Claim Name | Drug Name | PMIDs |
| 5833 | PCYT2 | ENZYME | lamivudine | LAMIVUDINE |
| Page: 1 |

Copyright 2023-Present -The University of Texas Health Science Center at Houston |