
|
|||||
|
 | |
| |
| |
| |
| |
| |
|
Gene: PCYT1A |
Gene summary for PCYT1A |
| Gene information | Species | Human | Gene symbol | PCYT1A | Gene ID | 5130 |
| Gene name | phosphate cytidylyltransferase 1A, choline | |
| Gene Alias | CCTA | |
| Cytomap | 3q29 | |
| Gene Type | protein-coding | GO ID | GO:0006629 | UniProtAcc | B4E322 |
Top |
Malignant transformation analysis |
| Identification of the aberrant gene expression in precancerous and cancerous lesions by comparing the gene expression of stem-like cells in diseased tissues with normal stem cells |
| Entrez ID | Symbol | Replicates | Species | Organ | Tissue | Adj P-value | Log2FC | Malignancy |
| 5130 | PCYT1A | HTA11_347_2000001011 | Human | Colorectum | AD | 1.03e-09 | 3.39e-01 | -0.1954 |
| 5130 | PCYT1A | LZE2T | Human | Esophagus | ESCC | 3.49e-02 | 5.00e-01 | 0.082 |
| 5130 | PCYT1A | LZE4T | Human | Esophagus | ESCC | 3.79e-30 | 1.07e+00 | 0.0811 |
| 5130 | PCYT1A | LZE7T | Human | Esophagus | ESCC | 1.60e-13 | 7.36e-01 | 0.0667 |
| 5130 | PCYT1A | LZE8T | Human | Esophagus | ESCC | 6.95e-08 | 2.34e-01 | 0.067 |
| 5130 | PCYT1A | LZE20T | Human | Esophagus | ESCC | 2.37e-05 | 2.70e-01 | 0.0662 |
| 5130 | PCYT1A | LZE22D1 | Human | Esophagus | HGIN | 4.07e-03 | 1.76e-01 | 0.0595 |
| 5130 | PCYT1A | LZE24T | Human | Esophagus | ESCC | 2.38e-27 | 8.36e-01 | 0.0596 |
| 5130 | PCYT1A | LZE21T | Human | Esophagus | ESCC | 5.01e-06 | 5.59e-01 | 0.0655 |
| 5130 | PCYT1A | LZE6T | Human | Esophagus | ESCC | 3.05e-03 | 2.49e-01 | 0.0845 |
| 5130 | PCYT1A | P1T-E | Human | Esophagus | ESCC | 3.14e-07 | 4.93e-01 | 0.0875 |
| 5130 | PCYT1A | P2T-E | Human | Esophagus | ESCC | 1.80e-26 | 5.60e-01 | 0.1177 |
| 5130 | PCYT1A | P4T-E | Human | Esophagus | ESCC | 8.82e-39 | 1.03e+00 | 0.1323 |
| 5130 | PCYT1A | P5T-E | Human | Esophagus | ESCC | 2.75e-34 | 7.10e-01 | 0.1327 |
| 5130 | PCYT1A | P8T-E | Human | Esophagus | ESCC | 2.60e-22 | 4.04e-01 | 0.0889 |
| 5130 | PCYT1A | P9T-E | Human | Esophagus | ESCC | 7.34e-44 | 9.89e-01 | 0.1131 |
| 5130 | PCYT1A | P10T-E | Human | Esophagus | ESCC | 2.75e-26 | 4.05e-01 | 0.116 |
| 5130 | PCYT1A | P11T-E | Human | Esophagus | ESCC | 1.70e-14 | 7.16e-01 | 0.1426 |
| 5130 | PCYT1A | P12T-E | Human | Esophagus | ESCC | 7.45e-22 | 4.61e-01 | 0.1122 |
| 5130 | PCYT1A | P15T-E | Human | Esophagus | ESCC | 1.48e-33 | 8.07e-01 | 0.1149 |
| Page: 1 2 3 4 5 6 |
| Tissue | Expression Dynamics | Abbreviation |
| Colorectum (GSE201348) |  | FAP: Familial adenomatous polyposis |
| CRC: Colorectal cancer | ||
| Colorectum (HTA11) |  | AD: Adenomas |
| SER: Sessile serrated lesions | ||
| MSI-H: Microsatellite-high colorectal cancer | ||
| MSS: Microsatellite stable colorectal cancer | ||
| Esophagus |  | ESCC: Esophageal squamous cell carcinoma |
| HGIN: High-grade intraepithelial neoplasias | ||
| LGIN: Low-grade intraepithelial neoplasias | ||
| Liver | 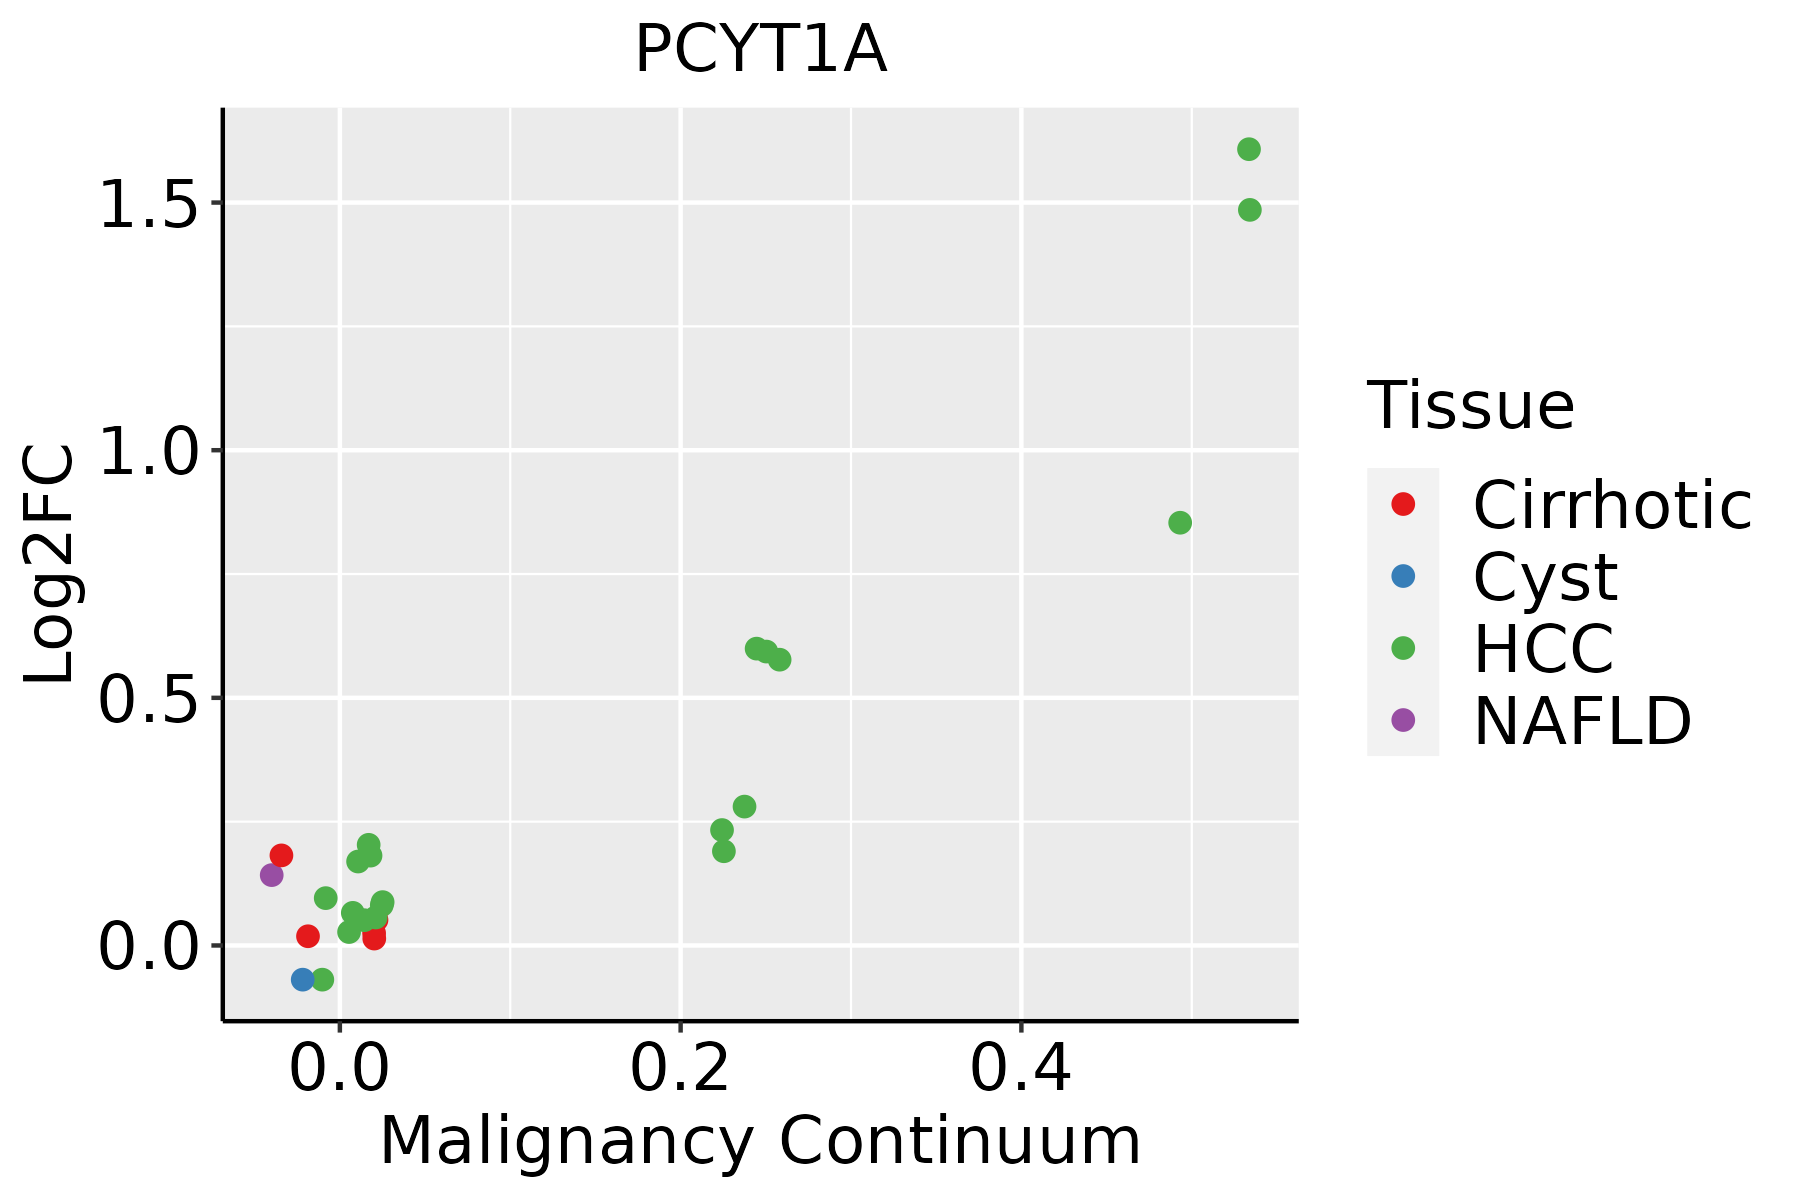 | HCC: Hepatocellular carcinoma |
| NAFLD: Non-alcoholic fatty liver disease | ||
| Oral Cavity |  | EOLP: Erosive Oral lichen planus |
| LP: leukoplakia | ||
| NEOLP: Non-erosive oral lichen planus | ||
| OSCC: Oral squamous cell carcinoma | ||
| Skin | 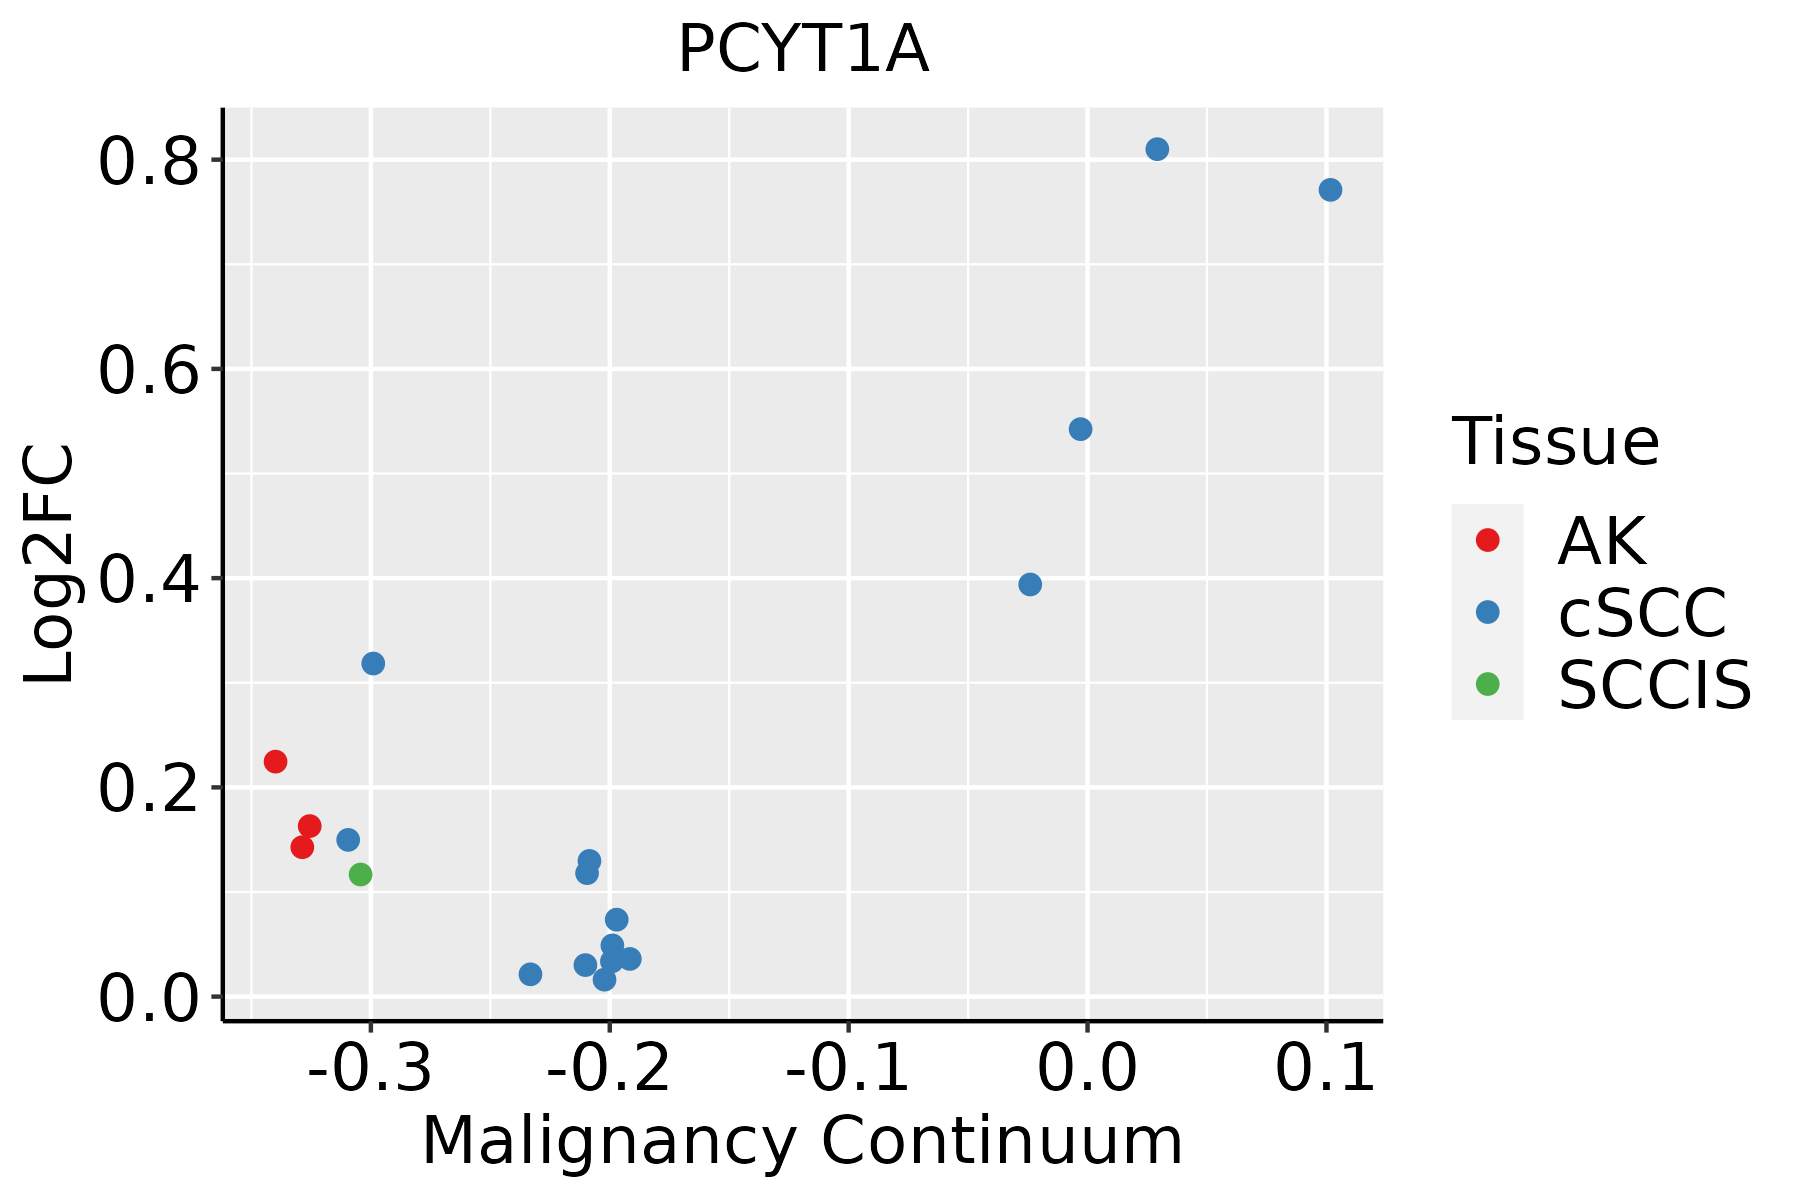 | AK: Actinic keratosis |
| cSCC: Cutaneous squamous cell carcinoma | ||
| SCCIS:squamous cell carcinoma in situ | ||
| Thyroid | 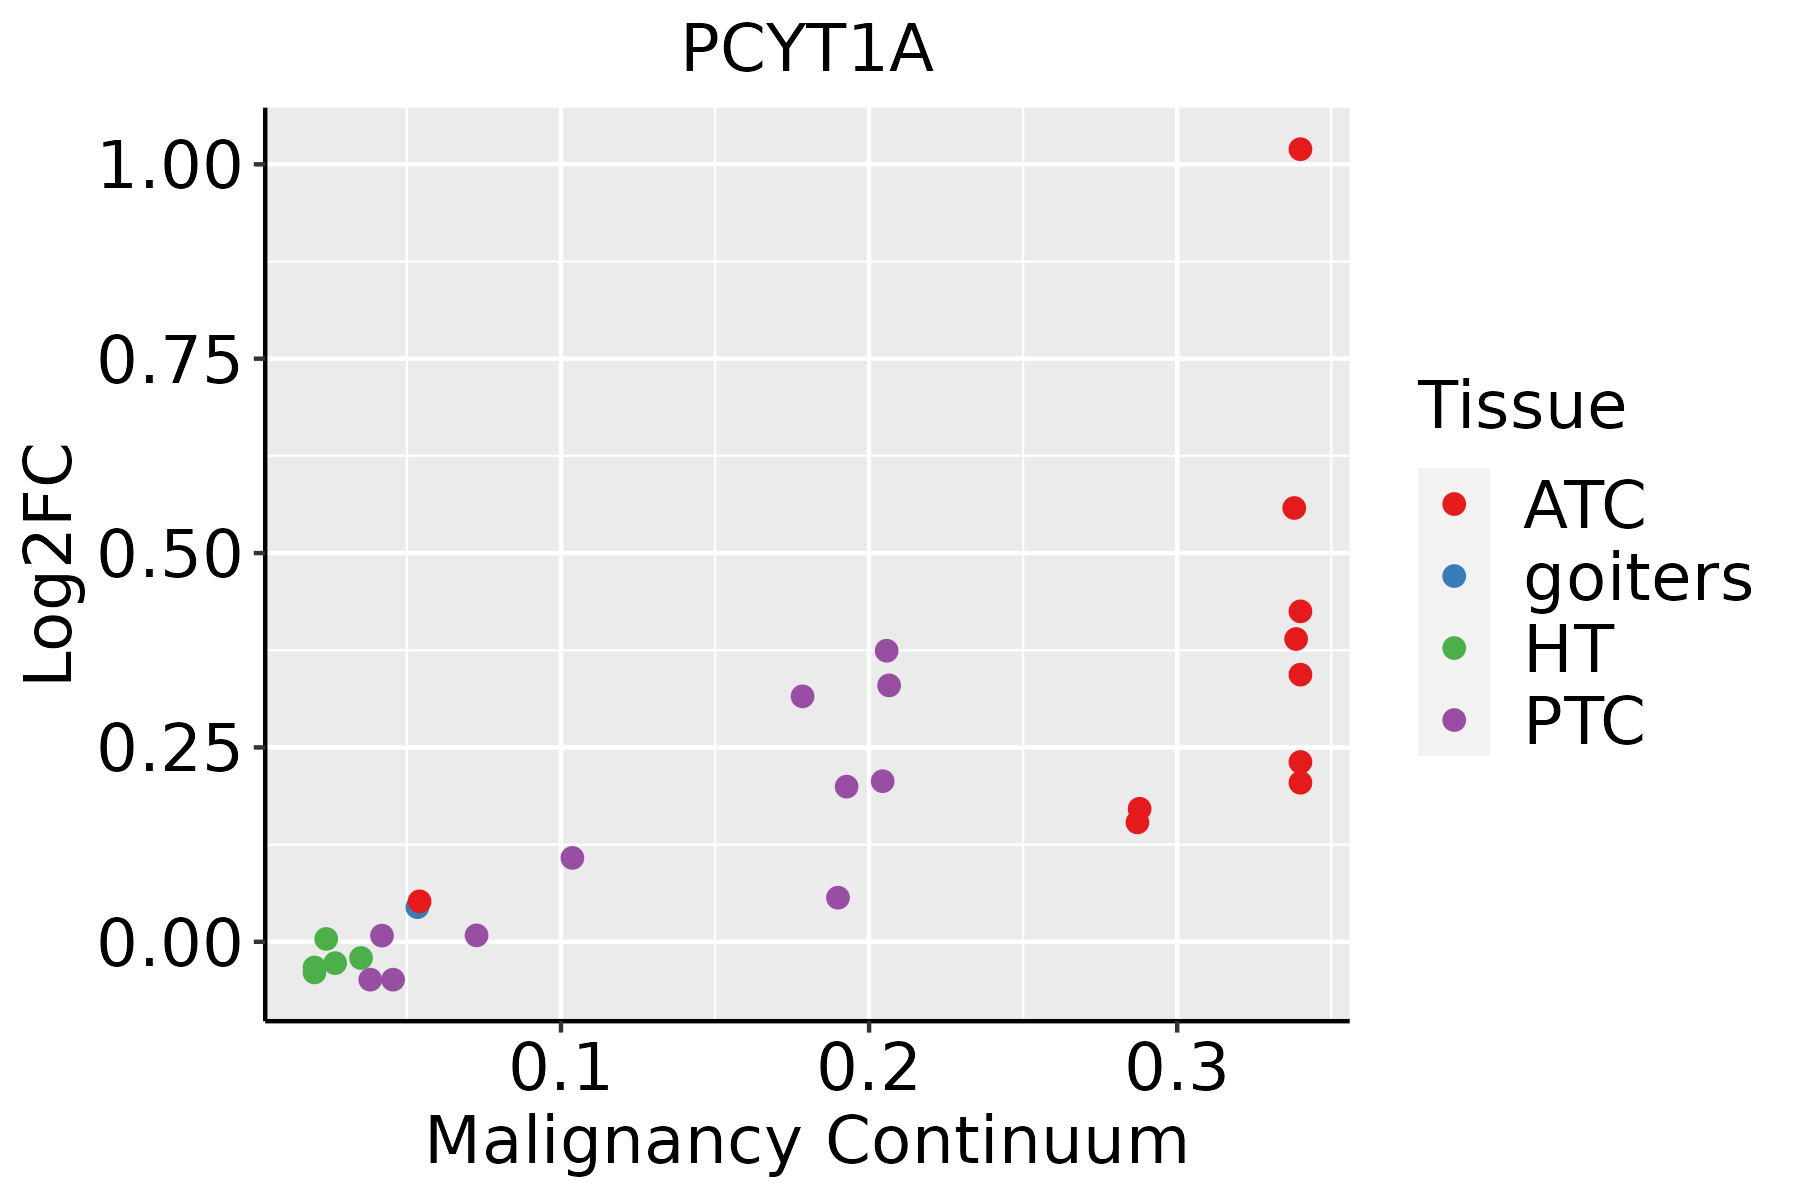 | ATC: Anaplastic thyroid cancer |
| HT: Hashimoto's thyroiditis | ||
| PTC: Papillary thyroid cancer |
| ∗log2FC in expression of this searched gene in stem-like cells from each diseased tissue sample relative to stem-like cells in normal samples in each tissue plotted against the malignancy continuum. Samples are colored based on if they are from different disease stage. |
Top |
Malignant transformation related pathway analysis |
| Find out the enriched GO biological processes and KEGG pathways involved in transition from healthy to precancer to cancer |
| Tissue | Disease Stage | Enriched GO biological Processes |
| Colorectum | AD |  |
| Colorectum | SER |  |
| Colorectum | MSS |  |
| Colorectum | MSI-H |  |
| Colorectum | FAP |  |
| ∗Top 15 enriched GO BP terms are showed in the bar plot of each disease state in each tissue. Each row represents a significant GO biological process which is colored according to the -log10(p.adjust). |
| Page: 1 2 3 4 5 6 7 8 9 |
| GO ID | Tissue | Disease Stage | Description | Gene Ratio | Bg Ratio | pvalue | p.adjust | Count |
| GO:0006650 | Colorectum | AD | glycerophospholipid metabolic process | 83/3918 | 306/18723 | 5.40e-03 | 3.55e-02 | 83 |
| GO:0006644 | Colorectum | AD | phospholipid metabolic process | 101/3918 | 383/18723 | 5.80e-03 | 3.67e-02 | 101 |
| GO:0045017 | Colorectum | AD | glycerolipid biosynthetic process | 69/3918 | 252/18723 | 8.33e-03 | 4.88e-02 | 69 |
| GO:00086544 | Esophagus | ESCC | phospholipid biosynthetic process | 162/8552 | 253/18723 | 2.59e-09 | 5.73e-08 | 162 |
| GO:00464744 | Esophagus | ESCC | glycerophospholipid biosynthetic process | 135/8552 | 211/18723 | 5.75e-08 | 1.02e-06 | 135 |
| GO:00450175 | Esophagus | ESCC | glycerolipid biosynthetic process | 154/8552 | 252/18723 | 5.20e-07 | 6.96e-06 | 154 |
| GO:00066446 | Esophagus | ESCC | phospholipid metabolic process | 218/8552 | 383/18723 | 5.37e-06 | 5.59e-05 | 218 |
| GO:00066561 | Esophagus | ESCC | phosphatidylcholine biosynthetic process | 24/8552 | 29/18723 | 4.50e-05 | 3.55e-04 | 24 |
| GO:00066505 | Esophagus | ESCC | glycerophospholipid metabolic process | 174/8552 | 306/18723 | 4.92e-05 | 3.85e-04 | 174 |
| GO:00464864 | Esophagus | ESCC | glycerolipid metabolic process | 211/8552 | 392/18723 | 6.51e-04 | 3.46e-03 | 211 |
| GO:00086542 | Liver | HCC | phospholipid biosynthetic process | 150/7958 | 253/18723 | 4.77e-08 | 1.03e-06 | 150 |
| GO:00066444 | Liver | HCC | phospholipid metabolic process | 214/7958 | 383/18723 | 7.25e-08 | 1.48e-06 | 214 |
| GO:004648611 | Liver | HCC | glycerolipid metabolic process | 215/7958 | 392/18723 | 4.54e-07 | 7.49e-06 | 215 |
| GO:004501711 | Liver | HCC | glycerolipid biosynthetic process | 143/7958 | 252/18723 | 3.27e-06 | 4.31e-05 | 143 |
| GO:00066504 | Liver | HCC | glycerophospholipid metabolic process | 168/7958 | 306/18723 | 7.27e-06 | 8.62e-05 | 168 |
| GO:004647411 | Liver | HCC | glycerophospholipid biosynthetic process | 121/7958 | 211/18723 | 9.12e-06 | 1.06e-04 | 121 |
| GO:00086543 | Oral cavity | OSCC | phospholipid biosynthetic process | 130/7305 | 253/18723 | 3.96e-05 | 3.46e-04 | 130 |
| GO:00464743 | Oral cavity | OSCC | glycerophospholipid biosynthetic process | 102/7305 | 211/18723 | 3.50e-03 | 1.48e-02 | 102 |
| GO:00066445 | Oral cavity | OSCC | phospholipid metabolic process | 175/7305 | 383/18723 | 4.21e-03 | 1.71e-02 | 175 |
| Page: 1 |
| Pathway ID | Tissue | Disease Stage | Description | Gene Ratio | Bg Ratio | pvalue | p.adjust | qvalue | Count |
| hsa052319 | Esophagus | ESCC | Choline metabolism in cancer | 61/4205 | 98/8465 | 7.97e-03 | 1.92e-02 | 9.84e-03 | 61 |
| hsa0523114 | Esophagus | ESCC | Choline metabolism in cancer | 61/4205 | 98/8465 | 7.97e-03 | 1.92e-02 | 9.84e-03 | 61 |
| hsa052316 | Liver | HCC | Choline metabolism in cancer | 57/4020 | 98/8465 | 2.14e-02 | 4.90e-02 | 2.72e-02 | 57 |
| hsa0523111 | Liver | HCC | Choline metabolism in cancer | 57/4020 | 98/8465 | 2.14e-02 | 4.90e-02 | 2.72e-02 | 57 |
| Page: 1 |
Top |
Cell-cell communication analysis |
| Identification of potential cell-cell interactions between two cell types and their ligand-receptor pairs for different disease states |
| Ligand | Receptor | LRpair | Pathway | Tissue | Disease Stage |
| Page: 1 |
Top |
Single-cell gene regulatory network inference analysis |
| Find out the significant the regulons (TFs) and the target genes of each regulon across cell types for different disease states |
| TF | Cell Type | Tissue | Disease Stage | Target Gene | RSS | Regulon Activity |
| ∗The dot plots of a searched regulon are shown for all cell subpopulations in each disease state of each tissue based on the regulon specific score inferred using pySCENIC and by calculating the average expression. |
| Page: 1 |
Top |
Somatic mutation of malignant transformation related genes |
| Annotation of somatic variants for genes involved in malignant transformation |
| Hugo Symbol | Variant Class | Variant Classification | dbSNP RS | HGVSc | HGVSp | HGVSp Short | SWISSPROT | BIOTYPE | SIFT | PolyPhen | Tumor Sample Barcode | Tissue | Histology | Sex | Age | Stage | Therapy Types | Drugs | Outcome |
| PCYT1A | SNV | Missense_Mutation | novel | c.654N>T | p.Arg218Ser | p.R218S | P49585 | protein_coding | deleterious(0) | probably_damaging(0.947) | TCGA-A8-A097-01 | Breast | breast invasive carcinoma | Female | >=65 | I/II | Hormone Therapy | tamoxiphen | SD |
| PCYT1A | SNV | Missense_Mutation | rs375261933 | c.650N>T | p.Ala217Val | p.A217V | P49585 | protein_coding | tolerated(1) | benign(0) | TCGA-AN-A046-01 | Breast | breast invasive carcinoma | Female | >=65 | I/II | Unknown | Unknown | SD |
| PCYT1A | SNV | Missense_Mutation | c.626N>G | p.Ile209Ser | p.I209S | P49585 | protein_coding | deleterious(0) | probably_damaging(0.968) | TCGA-AR-A24O-01 | Breast | breast invasive carcinoma | Female | <65 | III/IV | Chemotherapy | cytoxan | PD | |
| PCYT1A | insertion | Nonsense_Mutation | novel | c.370_371insAGAAATTGGGTGGAATCAGAAATCAAGGATATTTC | p.Phe124Ter | p.F124* | P49585 | protein_coding | TCGA-A8-A09E-01 | Breast | breast invasive carcinoma | Female | >=65 | III/IV | Hormone Therapy | anastrozole | SD | ||
| PCYT1A | SNV | Missense_Mutation | c.521N>T | p.Ser174Leu | p.S174L | P49585 | protein_coding | tolerated(0.23) | benign(0.089) | TCGA-DR-A0ZM-01 | Cervix | cervical & endocervical cancer | Female | <65 | III/IV | Unspecific | Cisplatin | SD | |
| PCYT1A | SNV | Missense_Mutation | novel | c.1096N>A | p.Glu366Lys | p.E366K | P49585 | protein_coding | deleterious_low_confidence(0.03) | probably_damaging(0.956) | TCGA-DS-A5RQ-01 | Cervix | cervical & endocervical cancer | Female | >=65 | I/II | Chemotherapy | cisplatin | CR |
| PCYT1A | SNV | Missense_Mutation | rs746655391 | c.455N>T | p.Thr152Met | p.T152M | P49585 | protein_coding | deleterious(0.04) | probably_damaging(0.983) | TCGA-UC-A7PG-06 | Cervix | cervical & endocervical cancer | Female | <65 | III/IV | Chemotherapy | cisplatin | PD |
| PCYT1A | insertion | Frame_Shift_Ins | novel | c.453_471dupGACGCTGACACCCGAGTTC | p.Leu158AspfsTer13 | p.L158Dfs*13 | P49585 | protein_coding | TCGA-VS-A9UL-01 | Cervix | cervical & endocervical cancer | Female | >=65 | III/IV | Unknown | Unknown | PD | ||
| PCYT1A | SNV | Missense_Mutation | c.917N>T | p.Gly306Val | p.G306V | P49585 | protein_coding | tolerated(0.1) | probably_damaging(0.928) | TCGA-AA-3812-01 | Colorectum | colon adenocarcinoma | Female | >=65 | I/II | Unknown | Unknown | PD | |
| PCYT1A | SNV | Missense_Mutation | novel | c.636N>G | p.Asp212Glu | p.D212E | P49585 | protein_coding | deleterious(0) | benign(0.076) | TCGA-AA-3930-01 | Colorectum | colon adenocarcinoma | Male | >=65 | III/IV | Chemotherapy | capecitabine | PD |
| Page: 1 2 3 4 5 |
Top |
Related drugs of malignant transformation related genes |
| Identification of chemicals and drugs interact with genes involved in malignant transfromation |
| (DGIdb 4.0) |
| Entrez ID | Symbol | Category | Interaction Types | Drug Claim Name | Drug Name | PMIDs |
| 5130 | PCYT1A | ENZYME | lamivudine | LAMIVUDINE |
| Page: 1 |

Copyright 2023-Present -The University of Texas Health Science Center at Houston |