
|
|||||
|
 | |
| |
| |
| |
| |
| |
|
Gene: PCTP |
Gene summary for PCTP |
| Gene information | Species | Human | Gene symbol | PCTP | Gene ID | 58488 |
| Gene name | phosphatidylcholine transfer protein | |
| Gene Alias | PC-TP | |
| Cytomap | 17q22 | |
| Gene Type | protein-coding | GO ID | GO:0001659 | UniProtAcc | Q9UKL6 |
Top |
Malignant transformation analysis |
| Identification of the aberrant gene expression in precancerous and cancerous lesions by comparing the gene expression of stem-like cells in diseased tissues with normal stem cells |
| Entrez ID | Symbol | Replicates | Species | Organ | Tissue | Adj P-value | Log2FC | Malignancy |
| 58488 | PCTP | LZE4T | Human | Esophagus | ESCC | 8.23e-03 | 1.86e-01 | 0.0811 |
| 58488 | PCTP | P2T-E | Human | Esophagus | ESCC | 1.73e-09 | 1.68e-01 | 0.1177 |
| 58488 | PCTP | P4T-E | Human | Esophagus | ESCC | 7.83e-05 | 8.19e-02 | 0.1323 |
| 58488 | PCTP | P8T-E | Human | Esophagus | ESCC | 1.47e-14 | 2.45e-01 | 0.0889 |
| 58488 | PCTP | P9T-E | Human | Esophagus | ESCC | 3.34e-11 | 1.16e-01 | 0.1131 |
| 58488 | PCTP | P11T-E | Human | Esophagus | ESCC | 4.51e-11 | 4.01e-01 | 0.1426 |
| 58488 | PCTP | P12T-E | Human | Esophagus | ESCC | 4.26e-16 | 3.14e-01 | 0.1122 |
| 58488 | PCTP | P15T-E | Human | Esophagus | ESCC | 1.21e-03 | 6.05e-02 | 0.1149 |
| 58488 | PCTP | P16T-E | Human | Esophagus | ESCC | 7.61e-07 | 1.14e-01 | 0.1153 |
| 58488 | PCTP | P19T-E | Human | Esophagus | ESCC | 3.12e-03 | 2.56e-01 | 0.1662 |
| 58488 | PCTP | P20T-E | Human | Esophagus | ESCC | 5.17e-06 | 1.07e-01 | 0.1124 |
| 58488 | PCTP | P21T-E | Human | Esophagus | ESCC | 1.78e-03 | 4.83e-02 | 0.1617 |
| 58488 | PCTP | P22T-E | Human | Esophagus | ESCC | 3.60e-13 | 2.30e-01 | 0.1236 |
| 58488 | PCTP | P23T-E | Human | Esophagus | ESCC | 1.57e-14 | 3.17e-01 | 0.108 |
| 58488 | PCTP | P24T-E | Human | Esophagus | ESCC | 9.56e-08 | 1.65e-01 | 0.1287 |
| 58488 | PCTP | P26T-E | Human | Esophagus | ESCC | 4.44e-08 | 1.62e-01 | 0.1276 |
| 58488 | PCTP | P28T-E | Human | Esophagus | ESCC | 1.96e-05 | 1.05e-01 | 0.1149 |
| 58488 | PCTP | P30T-E | Human | Esophagus | ESCC | 3.40e-09 | 2.42e-01 | 0.137 |
| 58488 | PCTP | P32T-E | Human | Esophagus | ESCC | 1.52e-12 | 2.28e-01 | 0.1666 |
| 58488 | PCTP | P36T-E | Human | Esophagus | ESCC | 2.56e-02 | 6.02e-02 | 0.1187 |
| Page: 1 2 3 4 |
| Tissue | Expression Dynamics | Abbreviation |
| Esophagus |  | ESCC: Esophageal squamous cell carcinoma |
| HGIN: High-grade intraepithelial neoplasias | ||
| LGIN: Low-grade intraepithelial neoplasias | ||
| Liver | 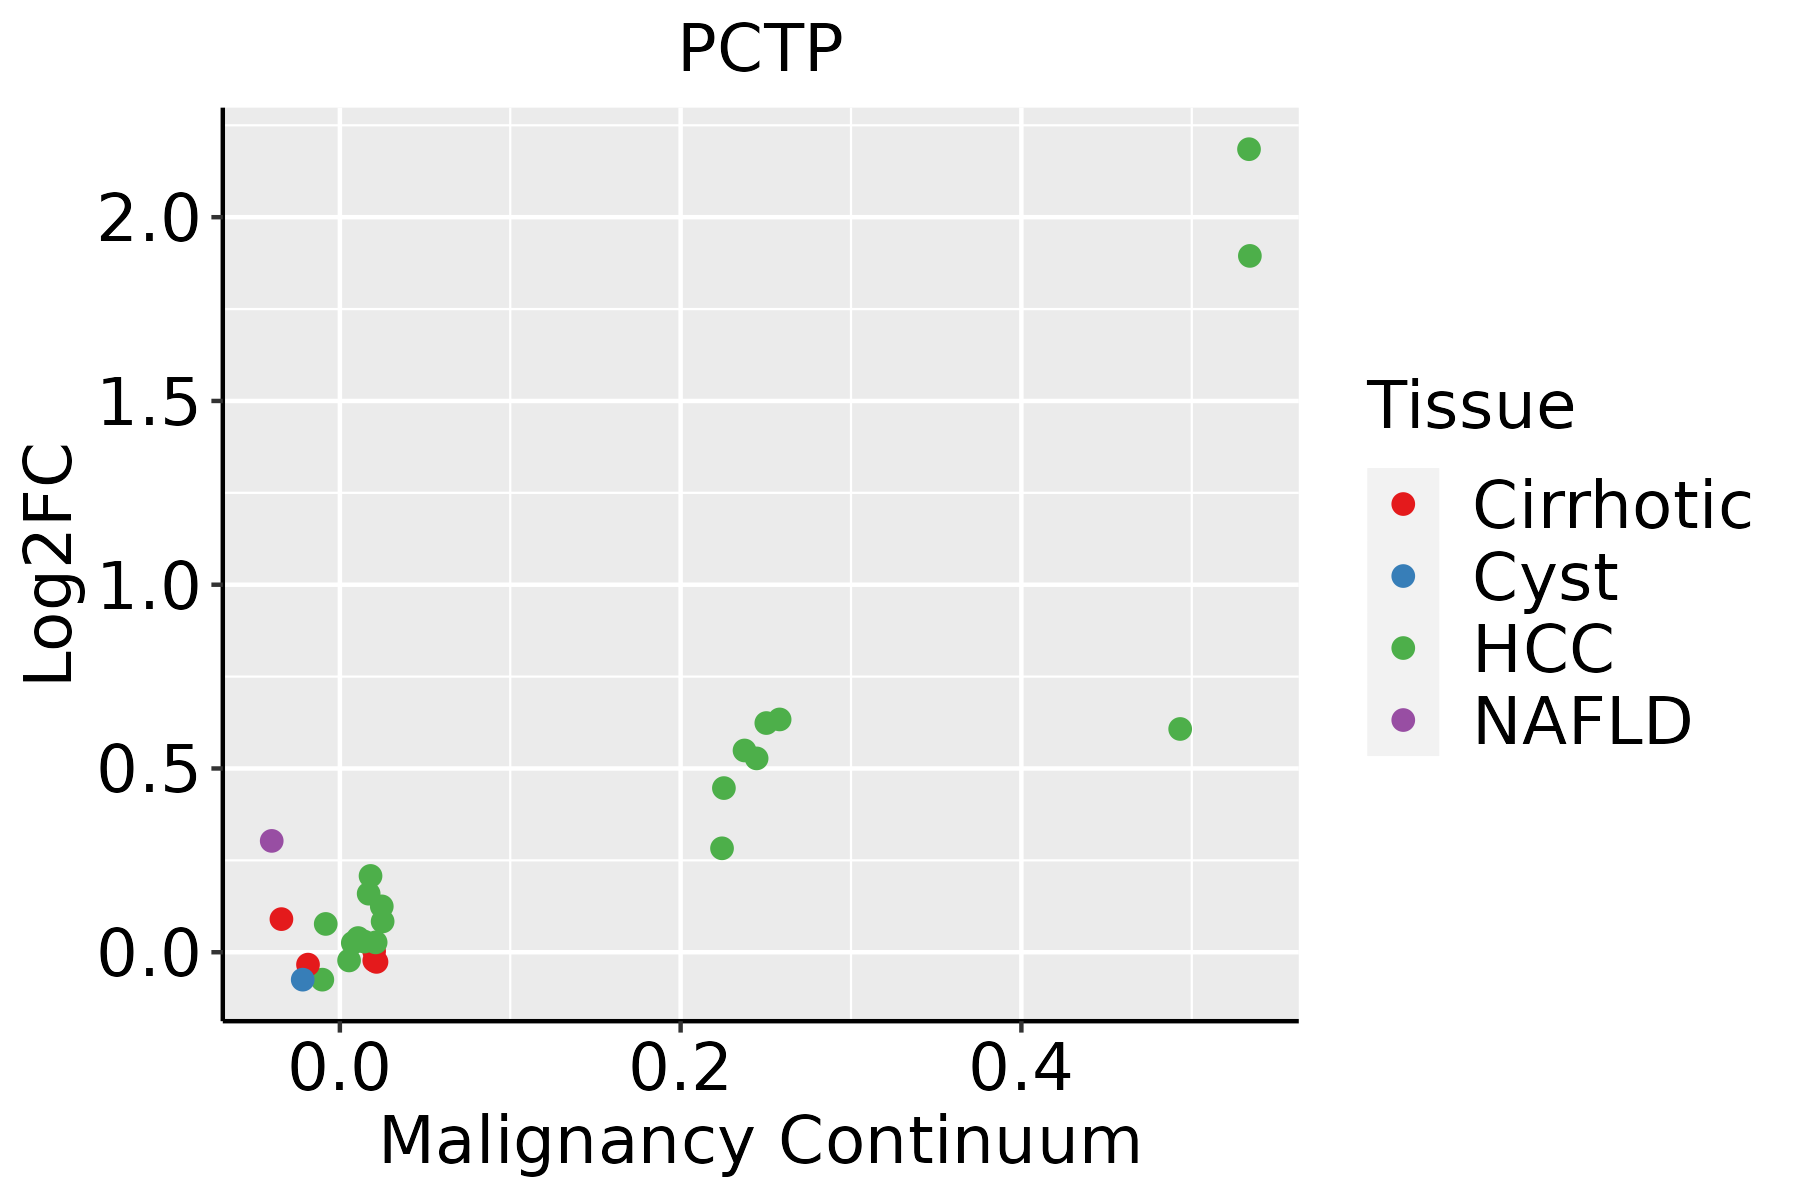 | HCC: Hepatocellular carcinoma |
| NAFLD: Non-alcoholic fatty liver disease | ||
| Oral Cavity |  | EOLP: Erosive Oral lichen planus |
| LP: leukoplakia | ||
| NEOLP: Non-erosive oral lichen planus | ||
| OSCC: Oral squamous cell carcinoma |
| ∗log2FC in expression of this searched gene in stem-like cells from each diseased tissue sample relative to stem-like cells in normal samples in each tissue plotted against the malignancy continuum. Samples are colored based on if they are from different disease stage. |
Top |
Malignant transformation related pathway analysis |
| Find out the enriched GO biological processes and KEGG pathways involved in transition from healthy to precancer to cancer |
| Tissue | Disease Stage | Enriched GO biological Processes |
| Colorectum | AD |  |
| Colorectum | SER |  |
| Colorectum | MSS |  |
| Colorectum | MSI-H |  |
| Colorectum | FAP |  |
| ∗Top 15 enriched GO BP terms are showed in the bar plot of each disease state in each tissue. Each row represents a significant GO biological process which is colored according to the -log10(p.adjust). |
| Page: 1 2 3 4 5 6 7 8 9 |
| GO ID | Tissue | Disease Stage | Description | Gene Ratio | Bg Ratio | pvalue | p.adjust | Count |
| GO:01061066 | Esophagus | ESCC | cold-induced thermogenesis | 80/8552 | 144/18723 | 1.07e-02 | 3.65e-02 | 80 |
| GO:01201616 | Esophagus | ESCC | regulation of cold-induced thermogenesis | 80/8552 | 144/18723 | 1.07e-02 | 3.65e-02 | 80 |
| GO:001087621 | Liver | HCC | lipid localization | 228/7958 | 448/18723 | 1.80e-04 | 1.41e-03 | 228 |
| GO:000686921 | Liver | HCC | lipid transport | 198/7958 | 398/18723 | 1.92e-03 | 9.78e-03 | 198 |
| GO:010610611 | Liver | HCC | cold-induced thermogenesis | 76/7958 | 144/18723 | 8.07e-03 | 3.18e-02 | 76 |
| GO:012016111 | Liver | HCC | regulation of cold-induced thermogenesis | 76/7958 | 144/18723 | 8.07e-03 | 3.18e-02 | 76 |
| GO:199084511 | Liver | HCC | adaptive thermogenesis | 81/7958 | 157/18723 | 1.32e-02 | 4.72e-02 | 81 |
| GO:01061065 | Oral cavity | OSCC | cold-induced thermogenesis | 71/7305 | 144/18723 | 7.51e-03 | 2.75e-02 | 71 |
| GO:01201615 | Oral cavity | OSCC | regulation of cold-induced thermogenesis | 71/7305 | 144/18723 | 7.51e-03 | 2.75e-02 | 71 |
| GO:00016594 | Oral cavity | OSCC | temperature homeostasis | 84/7305 | 174/18723 | 7.84e-03 | 2.87e-02 | 84 |
| GO:19908454 | Oral cavity | OSCC | adaptive thermogenesis | 76/7305 | 157/18723 | 1.02e-02 | 3.52e-02 | 76 |
| Page: 1 |
| Pathway ID | Tissue | Disease Stage | Description | Gene Ratio | Bg Ratio | pvalue | p.adjust | qvalue | Count |
| Page: 1 |
Top |
Cell-cell communication analysis |
| Identification of potential cell-cell interactions between two cell types and their ligand-receptor pairs for different disease states |
| Ligand | Receptor | LRpair | Pathway | Tissue | Disease Stage |
| Page: 1 |
Top |
Single-cell gene regulatory network inference analysis |
| Find out the significant the regulons (TFs) and the target genes of each regulon across cell types for different disease states |
| TF | Cell Type | Tissue | Disease Stage | Target Gene | RSS | Regulon Activity |
| ∗The dot plots of a searched regulon are shown for all cell subpopulations in each disease state of each tissue based on the regulon specific score inferred using pySCENIC and by calculating the average expression. |
| Page: 1 |
Top |
Somatic mutation of malignant transformation related genes |
| Annotation of somatic variants for genes involved in malignant transformation |
| Hugo Symbol | Variant Class | Variant Classification | dbSNP RS | HGVSc | HGVSp | HGVSp Short | SWISSPROT | BIOTYPE | SIFT | PolyPhen | Tumor Sample Barcode | Tissue | Histology | Sex | Age | Stage | Therapy Types | Drugs | Outcome |
| PCTP | SNV | Missense_Mutation | c.435N>C | p.Glu145Asp | p.E145D | protein_coding | deleterious(0) | possibly_damaging(0.854) | TCGA-AC-A23H-01 | Breast | breast invasive carcinoma | Female | >=65 | I/II | Unknown | Unknown | PD | ||
| PCTP | SNV | Missense_Mutation | c.486N>T | p.Glu162Asp | p.E162D | protein_coding | tolerated(0.09) | benign(0.324) | TCGA-AN-A0AK-01 | Breast | breast invasive carcinoma | Female | >=65 | I/II | Unknown | Unknown | SD | ||
| PCTP | SNV | Missense_Mutation | novel | c.220N>C | p.Asp74His | p.D74H | protein_coding | deleterious(0) | probably_damaging(0.998) | TCGA-AN-A0XW-01 | Breast | breast invasive carcinoma | Female | <65 | III/IV | Unknown | Unknown | SD | |
| PCTP | insertion | Frame_Shift_Ins | novel | c.323_324insAAATA | p.Met109AsnfsTer26 | p.M109Nfs*26 | protein_coding | TCGA-A2-A04Y-01 | Breast | breast invasive carcinoma | Female | <65 | I/II | Chemotherapy | cytoxan | SD | |||
| PCTP | insertion | In_Frame_Ins | novel | c.324_325insTCTTCCTATTTAGGGGGCAGTGGG | p.Pro108_Met109insSerSerTyrLeuGlyGlySerGly | p.P108_M109insSSYLGGSG | protein_coding | TCGA-A2-A04Y-01 | Breast | breast invasive carcinoma | Female | <65 | I/II | Chemotherapy | cytoxan | SD | |||
| PCTP | SNV | Missense_Mutation | novel | c.375N>C | p.Met125Ile | p.M125I | protein_coding | tolerated(0.21) | benign(0) | TCGA-VS-A958-01 | Cervix | cervical & endocervical cancer | Female | <65 | I/II | Chemotherapy | cisplatin | CR | |
| PCTP | SNV | Missense_Mutation | rs752370465 | c.574G>A | p.Ala192Thr | p.A192T | protein_coding | deleterious(0.05) | benign(0.274) | TCGA-AA-3715-01 | Colorectum | colon adenocarcinoma | Male | >=65 | I/II | Unknown | Unknown | PD | |
| PCTP | SNV | Missense_Mutation | c.529N>T | p.Asp177Tyr | p.D177Y | protein_coding | deleterious(0) | probably_damaging(0.993) | TCGA-CM-6171-01 | Colorectum | colon adenocarcinoma | Female | >=65 | I/II | Unknown | Unknown | SD | ||
| PCTP | SNV | Missense_Mutation | rs147596112 | c.451N>T | p.Arg151Trp | p.R151W | protein_coding | deleterious(0) | probably_damaging(1) | TCGA-WS-AB45-01 | Colorectum | colon adenocarcinoma | Female | <65 | I/II | Unknown | Unknown | SD | |
| PCTP | SNV | Missense_Mutation | c.144N>T | p.Lys48Asn | p.K48N | protein_coding | tolerated(0.21) | benign(0.034) | TCGA-AG-A002-01 | Colorectum | rectum adenocarcinoma | Male | <65 | I/II | Unknown | Unknown | SD |
| Page: 1 2 3 |
Top |
Related drugs of malignant transformation related genes |
| Identification of chemicals and drugs interact with genes involved in malignant transfromation |
| (DGIdb 4.0) |
| Entrez ID | Symbol | Category | Interaction Types | Drug Claim Name | Drug Name | PMIDs |
| Page: 1 |

Copyright 2023-Present -The University of Texas Health Science Center at Houston |