
|
|||||
|
 | |
| |
| |
| |
| |
| |
|
Gene: PCSK9 |
Gene summary for PCSK9 |
| Gene information | Species | Human | Gene symbol | PCSK9 | Gene ID | 255738 |
| Gene name | proprotein convertase subtilisin/kexin type 9 | |
| Gene Alias | FH3 | |
| Cytomap | 1p32.3 | |
| Gene Type | protein-coding | GO ID | GO:0001655 | UniProtAcc | Q8NBP7 |
Top |
Malignant transformation analysis |
| Identification of the aberrant gene expression in precancerous and cancerous lesions by comparing the gene expression of stem-like cells in diseased tissues with normal stem cells |
| Entrez ID | Symbol | Replicates | Species | Organ | Tissue | Adj P-value | Log2FC | Malignancy |
| 255738 | PCSK9 | LZE2T | Human | Esophagus | ESCC | 4.56e-03 | 4.09e-01 | 0.082 |
| 255738 | PCSK9 | LZE7T | Human | Esophagus | ESCC | 8.65e-03 | 2.60e-01 | 0.0667 |
| 255738 | PCSK9 | P2T-E | Human | Esophagus | ESCC | 5.04e-09 | 2.35e-01 | 0.1177 |
| 255738 | PCSK9 | P4T-E | Human | Esophagus | ESCC | 1.05e-12 | 3.33e-01 | 0.1323 |
| 255738 | PCSK9 | P10T-E | Human | Esophagus | ESCC | 5.55e-24 | 5.70e-01 | 0.116 |
| 255738 | PCSK9 | P12T-E | Human | Esophagus | ESCC | 2.87e-02 | 7.93e-02 | 0.1122 |
| 255738 | PCSK9 | P15T-E | Human | Esophagus | ESCC | 8.92e-04 | 2.62e-01 | 0.1149 |
| 255738 | PCSK9 | P16T-E | Human | Esophagus | ESCC | 8.52e-03 | 9.98e-02 | 0.1153 |
| 255738 | PCSK9 | P21T-E | Human | Esophagus | ESCC | 4.18e-04 | 2.47e-01 | 0.1617 |
| 255738 | PCSK9 | P22T-E | Human | Esophagus | ESCC | 5.84e-13 | 3.26e-01 | 0.1236 |
| 255738 | PCSK9 | P23T-E | Human | Esophagus | ESCC | 5.65e-07 | 3.56e-01 | 0.108 |
| 255738 | PCSK9 | P26T-E | Human | Esophagus | ESCC | 2.73e-14 | 3.93e-01 | 0.1276 |
| 255738 | PCSK9 | P27T-E | Human | Esophagus | ESCC | 6.58e-06 | 1.94e-01 | 0.1055 |
| 255738 | PCSK9 | P28T-E | Human | Esophagus | ESCC | 1.42e-13 | 3.61e-01 | 0.1149 |
| 255738 | PCSK9 | P30T-E | Human | Esophagus | ESCC | 2.89e-15 | 6.04e-01 | 0.137 |
| 255738 | PCSK9 | P31T-E | Human | Esophagus | ESCC | 1.59e-11 | 4.05e-01 | 0.1251 |
| 255738 | PCSK9 | P37T-E | Human | Esophagus | ESCC | 5.49e-26 | 9.04e-01 | 0.1371 |
| 255738 | PCSK9 | P42T-E | Human | Esophagus | ESCC | 1.22e-03 | 1.37e-01 | 0.1175 |
| 255738 | PCSK9 | P47T-E | Human | Esophagus | ESCC | 1.50e-03 | 1.86e-01 | 0.1067 |
| 255738 | PCSK9 | P48T-E | Human | Esophagus | ESCC | 1.29e-03 | 1.50e-01 | 0.0959 |
| Page: 1 2 |
| Tissue | Expression Dynamics | Abbreviation |
| Esophagus | 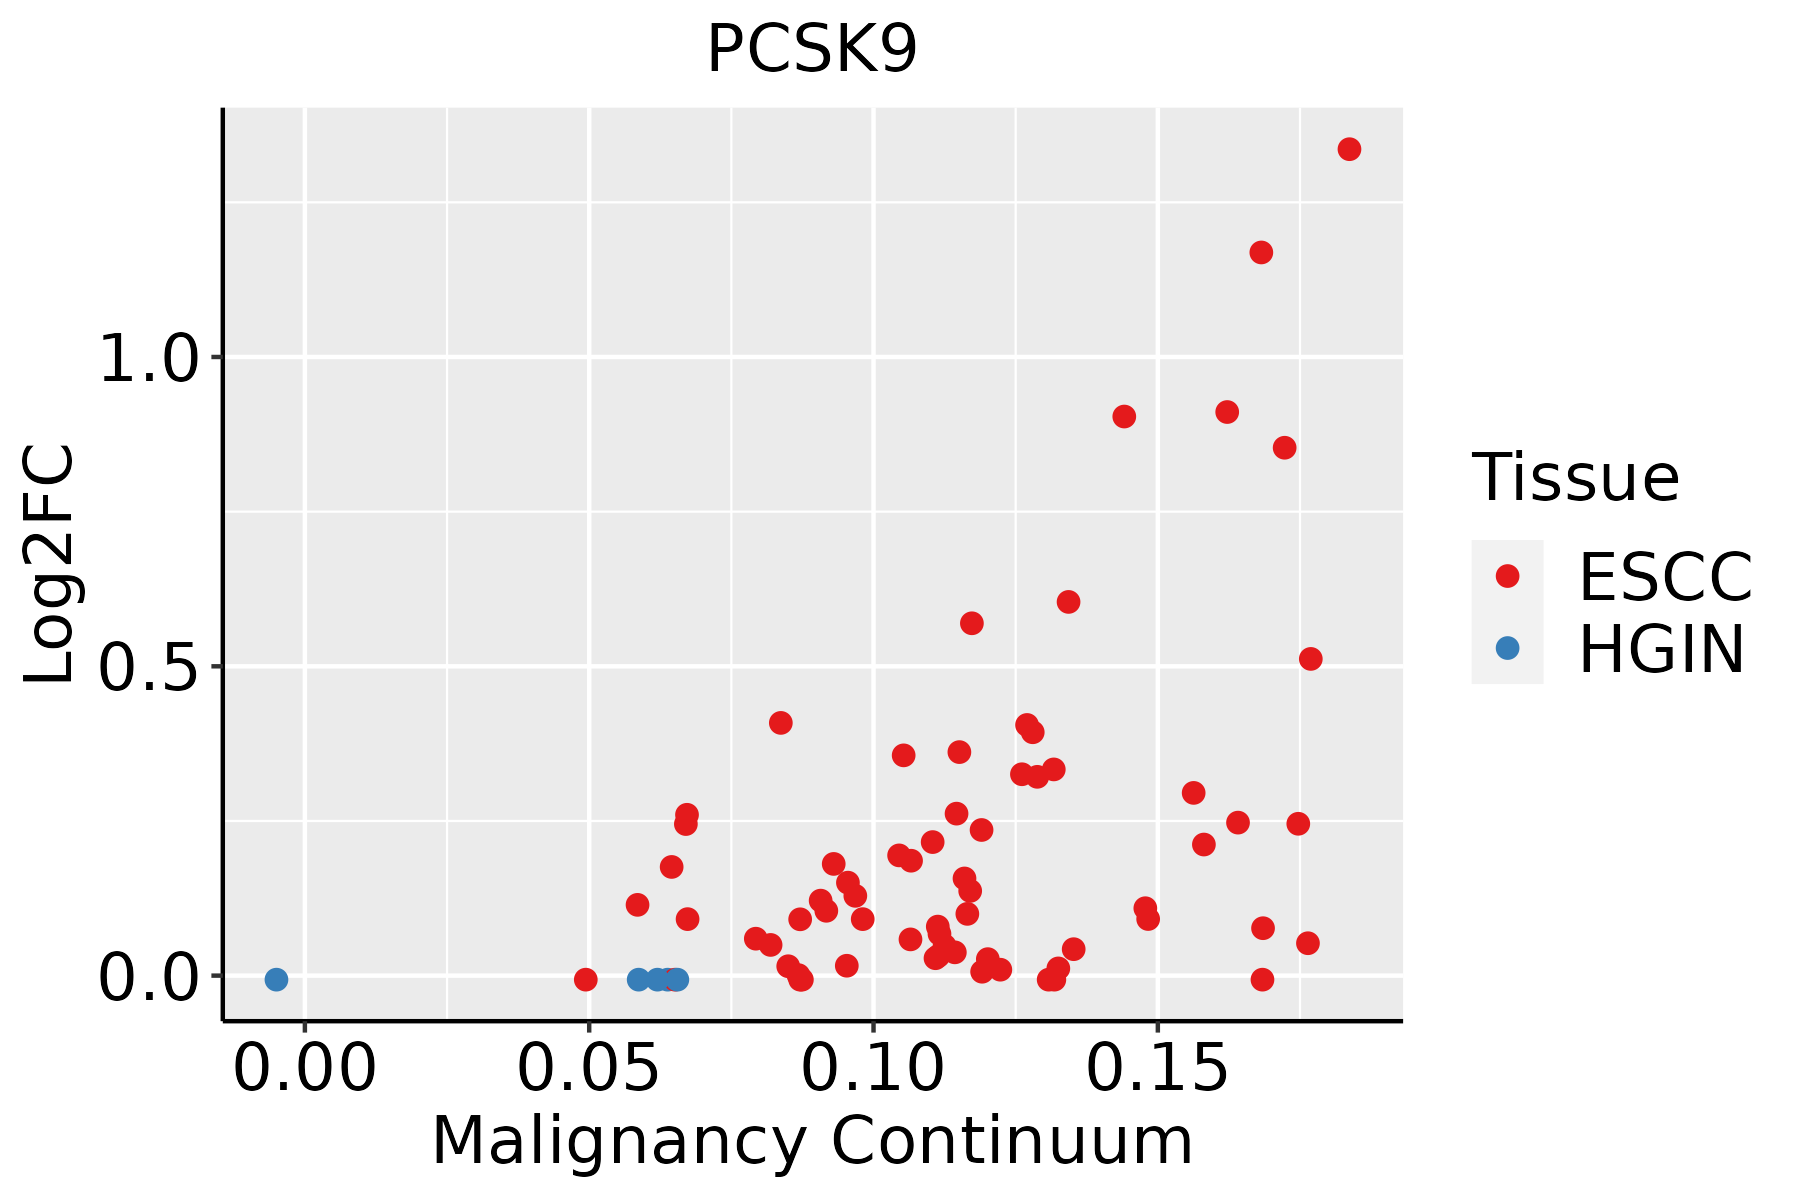 | ESCC: Esophageal squamous cell carcinoma |
| HGIN: High-grade intraepithelial neoplasias | ||
| LGIN: Low-grade intraepithelial neoplasias | ||
| Liver | 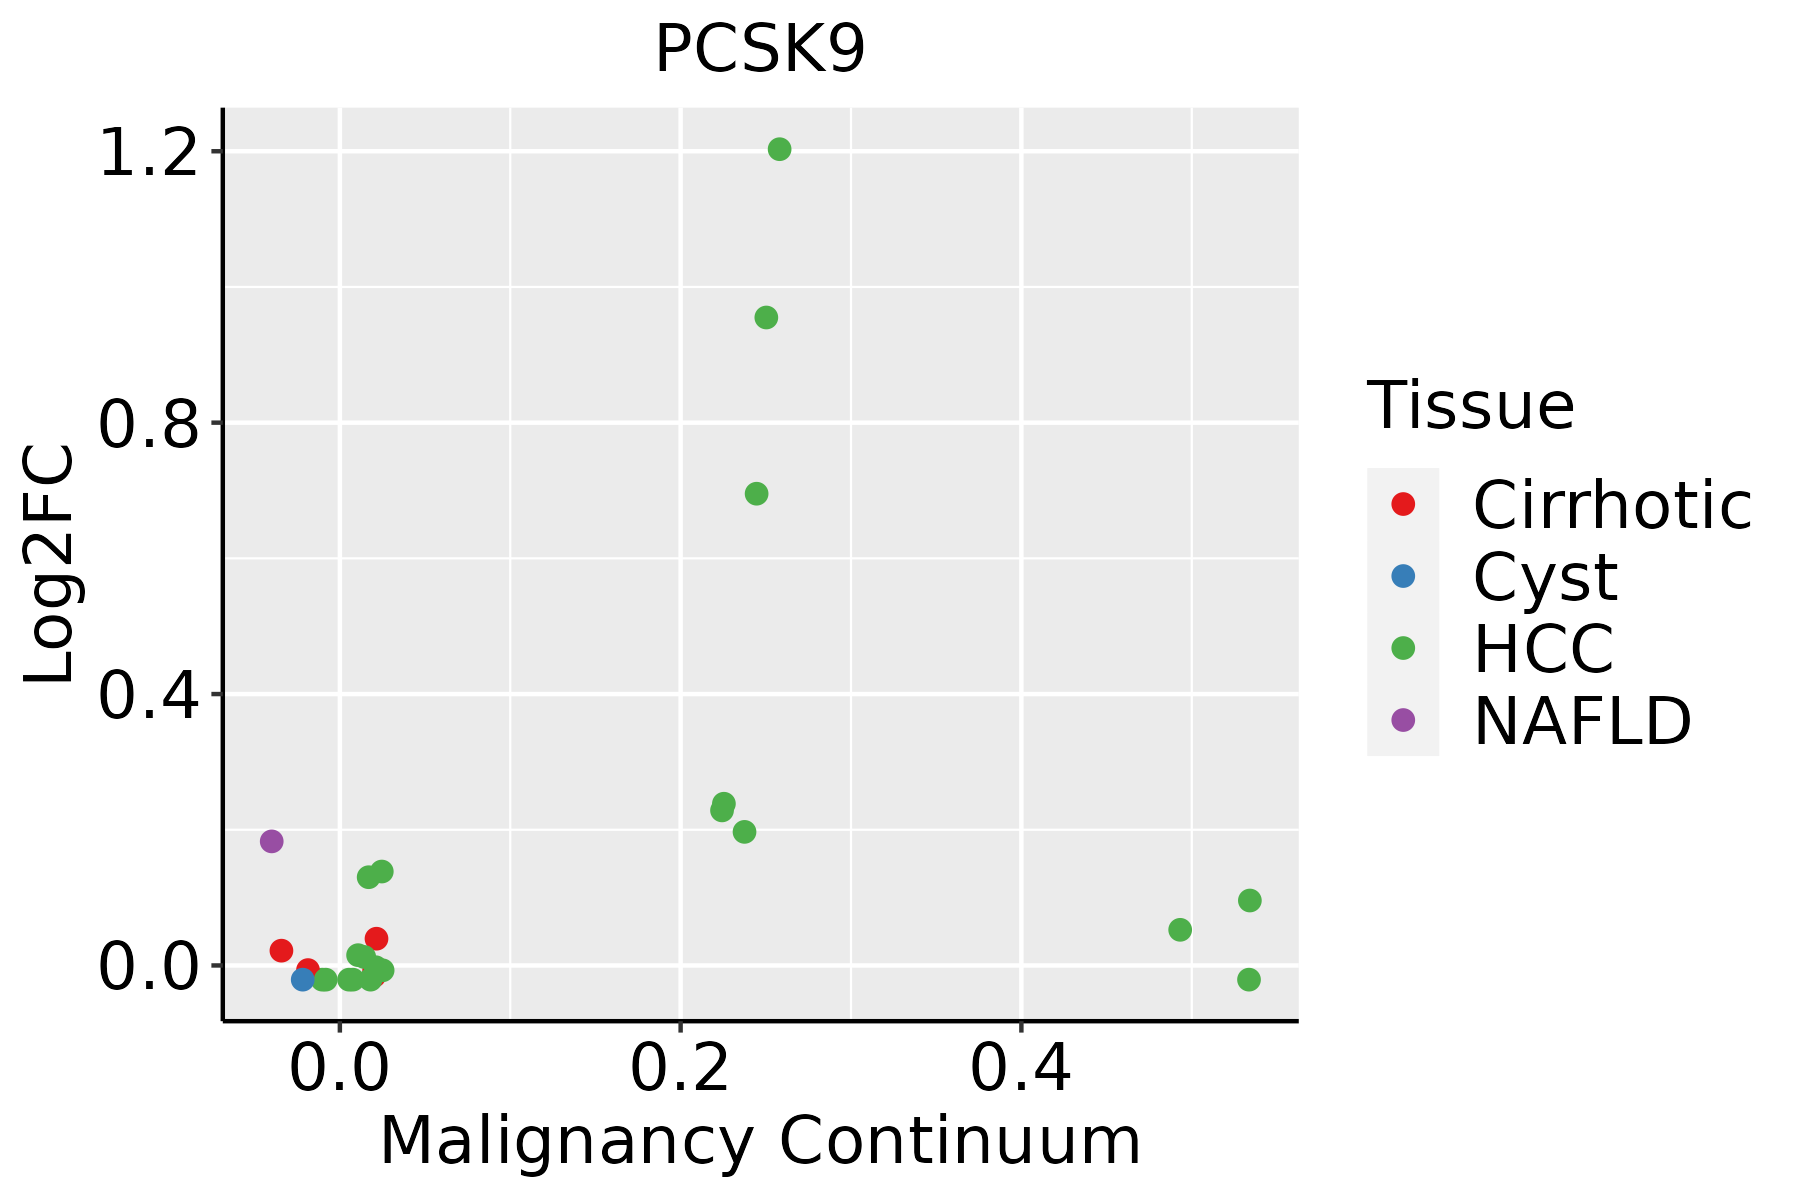 | HCC: Hepatocellular carcinoma |
| NAFLD: Non-alcoholic fatty liver disease |
| ∗log2FC in expression of this searched gene in stem-like cells from each diseased tissue sample relative to stem-like cells in normal samples in each tissue plotted against the malignancy continuum. Samples are colored based on if they are from different disease stage. |
Top |
Malignant transformation related pathway analysis |
| Find out the enriched GO biological processes and KEGG pathways involved in transition from healthy to precancer to cancer |
| Tissue | Disease Stage | Enriched GO biological Processes |
| Colorectum | AD |  |
| Colorectum | SER |  |
| Colorectum | MSS |  |
| Colorectum | MSI-H |  |
| Colorectum | FAP |  |
| ∗Top 15 enriched GO BP terms are showed in the bar plot of each disease state in each tissue. Each row represents a significant GO biological process which is colored according to the -log10(p.adjust). |
| Page: 1 2 3 4 5 6 7 8 9 |
| GO ID | Tissue | Disease Stage | Description | Gene Ratio | Bg Ratio | pvalue | p.adjust | Count |
| GO:0042176111 | Esophagus | ESCC | regulation of protein catabolic process | 280/8552 | 391/18723 | 8.65e-26 | 2.39e-23 | 280 |
| GO:003238618 | Esophagus | ESCC | regulation of intracellular transport | 243/8552 | 337/18723 | 3.20e-23 | 7.25e-21 | 243 |
| GO:0009896111 | Esophagus | ESCC | positive regulation of catabolic process | 332/8552 | 492/18723 | 4.36e-23 | 9.22e-21 | 332 |
| GO:0031331111 | Esophagus | ESCC | positive regulation of cellular catabolic process | 292/8552 | 427/18723 | 8.67e-22 | 1.53e-19 | 292 |
| GO:1903362111 | Esophagus | ESCC | regulation of cellular protein catabolic process | 188/8552 | 255/18723 | 5.12e-20 | 6.62e-18 | 188 |
| GO:0051098111 | Esophagus | ESCC | regulation of binding | 251/8552 | 363/18723 | 6.73e-20 | 8.46e-18 | 251 |
| GO:0045732111 | Esophagus | ESCC | positive regulation of protein catabolic process | 167/8552 | 231/18723 | 1.47e-16 | 1.14e-14 | 167 |
| GO:0071496111 | Esophagus | ESCC | cellular response to external stimulus | 215/8552 | 320/18723 | 4.29e-15 | 2.43e-13 | 215 |
| GO:000703417 | Esophagus | ESCC | vacuolar transport | 119/8552 | 157/18723 | 1.16e-14 | 6.30e-13 | 119 |
| GO:1903364111 | Esophagus | ESCC | positive regulation of cellular protein catabolic process | 117/8552 | 155/18723 | 3.25e-14 | 1.66e-12 | 117 |
| GO:0031668111 | Esophagus | ESCC | cellular response to extracellular stimulus | 168/8552 | 246/18723 | 4.93e-13 | 2.23e-11 | 168 |
| GO:0031669110 | Esophagus | ESCC | cellular response to nutrient levels | 148/8552 | 215/18723 | 4.58e-12 | 1.76e-10 | 148 |
| GO:0048732111 | Esophagus | ESCC | gland development | 269/8552 | 436/18723 | 7.81e-12 | 2.95e-10 | 269 |
| GO:0031667111 | Esophagus | ESCC | response to nutrient levels | 289/8552 | 474/18723 | 9.25e-12 | 3.47e-10 | 289 |
| GO:004339320 | Esophagus | ESCC | regulation of protein binding | 135/8552 | 196/18723 | 3.69e-11 | 1.22e-09 | 135 |
| GO:005160418 | Esophagus | ESCC | protein maturation | 189/8552 | 294/18723 | 7.64e-11 | 2.39e-09 | 189 |
| GO:0009267110 | Esophagus | ESCC | cellular response to starvation | 110/8552 | 156/18723 | 2.63e-10 | 7.37e-09 | 110 |
| GO:004259419 | Esophagus | ESCC | response to starvation | 133/8552 | 197/18723 | 4.31e-10 | 1.14e-08 | 133 |
| GO:00070419 | Esophagus | ESCC | lysosomal transport | 83/8552 | 114/18723 | 3.52e-09 | 7.41e-08 | 83 |
| GO:0051100111 | Esophagus | ESCC | negative regulation of binding | 109/8552 | 162/18723 | 2.10e-08 | 4.03e-07 | 109 |
| Page: 1 2 3 4 5 6 7 |
| Pathway ID | Tissue | Disease Stage | Description | Gene Ratio | Bg Ratio | pvalue | p.adjust | qvalue | Count |
| hsa049794 | Liver | HCC | Cholesterol metabolism | 41/4020 | 51/8465 | 1.33e-06 | 1.35e-05 | 7.49e-06 | 41 |
| hsa049795 | Liver | HCC | Cholesterol metabolism | 41/4020 | 51/8465 | 1.33e-06 | 1.35e-05 | 7.49e-06 | 41 |
| Page: 1 |
Top |
Cell-cell communication analysis |
| Identification of potential cell-cell interactions between two cell types and their ligand-receptor pairs for different disease states |
| Ligand | Receptor | LRpair | Pathway | Tissue | Disease Stage |
| Page: 1 |
Top |
Single-cell gene regulatory network inference analysis |
| Find out the significant the regulons (TFs) and the target genes of each regulon across cell types for different disease states |
| TF | Cell Type | Tissue | Disease Stage | Target Gene | RSS | Regulon Activity |
| ∗The dot plots of a searched regulon are shown for all cell subpopulations in each disease state of each tissue based on the regulon specific score inferred using pySCENIC and by calculating the average expression. |
| Page: 1 |
Top |
Somatic mutation of malignant transformation related genes |
| Annotation of somatic variants for genes involved in malignant transformation |
| Hugo Symbol | Variant Class | Variant Classification | dbSNP RS | HGVSc | HGVSp | HGVSp Short | SWISSPROT | BIOTYPE | SIFT | PolyPhen | Tumor Sample Barcode | Tissue | Histology | Sex | Age | Stage | Therapy Types | Drugs | Outcome |
| PCSK9 | deletion | Frame_Shift_Del | novel | c.1681+1delG | Q8NBP7 | protein_coding | TCGA-EW-A2FV-01 | Breast | breast invasive carcinoma | Female | <65 | III/IV | Chemotherapy | docetaxel | SD | ||||
| PCSK9 | insertion | Nonsense_Mutation | novel | c.29_30insAG | p.Trp10Ter | p.W10* | Q8NBP7 | protein_coding | TCGA-C5-A2M1-01 | Cervix | cervical & endocervical cancer | Female | <65 | I/II | Unknown | Unknown | SD | ||
| PCSK9 | SNV | Missense_Mutation | rs376385276 | c.290N>A | p.Arg97His | p.R97H | Q8NBP7 | protein_coding | deleterious(0.03) | benign(0.111) | TCGA-5M-AAT6-01 | Colorectum | colon adenocarcinoma | Female | <65 | III/IV | Unknown | Unknown | PD |
| PCSK9 | SNV | Missense_Mutation | c.515A>G | p.Gln172Arg | p.Q172R | Q8NBP7 | protein_coding | tolerated(0.31) | benign(0) | TCGA-AA-3710-01 | Colorectum | colon adenocarcinoma | Female | >=65 | I/II | Unknown | Unknown | SD | |
| PCSK9 | SNV | Missense_Mutation | c.1202N>A | p.Ser401Tyr | p.S401Y | Q8NBP7 | protein_coding | deleterious(0) | possibly_damaging(0.882) | TCGA-AA-3712-01 | Colorectum | colon adenocarcinoma | Male | >=65 | III/IV | Unknown | Unknown | SD | |
| PCSK9 | SNV | Missense_Mutation | rs145468572 | c.1492G>A | p.Glu498Lys | p.E498K | Q8NBP7 | protein_coding | deleterious(0.02) | benign(0.432) | TCGA-AA-3864-01 | Colorectum | colon adenocarcinoma | Male | >=65 | I/II | Unknown | Unknown | SD |
| PCSK9 | SNV | Missense_Mutation | novel | c.1187N>A | p.Ala396Glu | p.A396E | Q8NBP7 | protein_coding | deleterious(0.01) | possibly_damaging(0.834) | TCGA-AA-3872-01 | Colorectum | colon adenocarcinoma | Male | <65 | III/IV | Unknown | Unknown | SD |
| PCSK9 | SNV | Missense_Mutation | rs776367625 | c.1606N>A | p.Val536Ile | p.V536I | Q8NBP7 | protein_coding | tolerated(0.77) | benign(0) | TCGA-AA-A02K-01 | Colorectum | colon adenocarcinoma | Male | <65 | III/IV | Chemotherapy | folinic | PD |
| PCSK9 | SNV | Missense_Mutation | rs865914100 | c.940N>A | p.Ala314Thr | p.A314T | Q8NBP7 | protein_coding | deleterious(0) | probably_damaging(0.989) | TCGA-AY-A54L-01 | Colorectum | colon adenocarcinoma | Female | >=65 | I/II | Unknown | Unknown | PD |
| PCSK9 | SNV | Missense_Mutation | rs777111934 | c.779C>T | p.Thr260Met | p.T260M | Q8NBP7 | protein_coding | deleterious(0) | probably_damaging(0.993) | TCGA-G4-6322-01 | Colorectum | colon adenocarcinoma | Male | >=65 | III/IV | Chemotherapy | oxaliplatin | PD |
| Page: 1 2 3 4 5 |
Top |
Related drugs of malignant transformation related genes |
| Identification of chemicals and drugs interact with genes involved in malignant transfromation |
| (DGIdb 4.0) |
| Entrez ID | Symbol | Category | Interaction Types | Drug Claim Name | Drug Name | PMIDs |
| 255738 | PCSK9 | DRUGGABLE GENOME, ENZYME, CELL SURFACE, PROTEASE | Bococizumab | BOCOCIZUMAB | ||
| 255738 | PCSK9 | DRUGGABLE GENOME, ENZYME, CELL SURFACE, PROTEASE | SPC5001 | |||
| 255738 | PCSK9 | DRUGGABLE GENOME, ENZYME, CELL SURFACE, PROTEASE | inhibitor | 223366063 | BOCOCIZUMAB | |
| 255738 | PCSK9 | DRUGGABLE GENOME, ENZYME, CELL SURFACE, PROTEASE | inhibitor | 178103355 | ALIROCUMAB | |
| 255738 | PCSK9 | DRUGGABLE GENOME, ENZYME, CELL SURFACE, PROTEASE | inhibitor | CHEMBL3137349 | BOCOCIZUMAB | |
| 255738 | PCSK9 | DRUGGABLE GENOME, ENZYME, CELL SURFACE, PROTEASE | REGN-727 | ALIROCUMAB | ||
| 255738 | PCSK9 | DRUGGABLE GENOME, ENZYME, CELL SURFACE, PROTEASE | LY3015014 | FROVOCIMAB | ||
| 255738 | PCSK9 | DRUGGABLE GENOME, ENZYME, CELL SURFACE, PROTEASE | PF-04950615 | BOCOCIZUMAB | ||
| 255738 | PCSK9 | DRUGGABLE GENOME, ENZYME, CELL SURFACE, PROTEASE | inhibitor | 178103915 | EVOLOCUMAB | |
| 255738 | PCSK9 | DRUGGABLE GENOME, ENZYME, CELL SURFACE, PROTEASE | inhibitor | CHEMBL2364655 | EVOLOCUMAB |
| Page: 1 2 |

Copyright 2023-Present -The University of Texas Health Science Center at Houston |