
|
|||||
|
 | |
| |
| |
| |
| |
| |
|
Gene: PCSK6 |
Gene summary for PCSK6 |
| Gene information | Species | Human | Gene symbol | PCSK6 | Gene ID | 5046 |
| Gene name | proprotein convertase subtilisin/kexin type 6 | |
| Gene Alias | PACE4 | |
| Cytomap | 15q26.3 | |
| Gene Type | protein-coding | GO ID | GO:0000578 | UniProtAcc | A2RQD9 |
Top |
Malignant transformation analysis |
| Identification of the aberrant gene expression in precancerous and cancerous lesions by comparing the gene expression of stem-like cells in diseased tissues with normal stem cells |
| Entrez ID | Symbol | Replicates | Species | Organ | Tissue | Adj P-value | Log2FC | Malignancy |
| 5046 | PCSK6 | HTA11_347_2000001011 | Human | Colorectum | AD | 7.29e-21 | 8.15e-01 | -0.1954 |
| 5046 | PCSK6 | HTA11_83_2000001011 | Human | Colorectum | SER | 7.39e-05 | 5.64e-01 | -0.1526 |
| 5046 | PCSK6 | HTA11_1391_2000001011 | Human | Colorectum | AD | 1.73e-03 | 4.92e-01 | -0.059 |
| 5046 | PCSK6 | HTA11_99999970781_79442 | Human | Colorectum | MSS | 5.26e-05 | -2.80e-01 | 0.294 |
| 5046 | PCSK6 | HTA11_99999971662_82457 | Human | Colorectum | MSS | 3.49e-09 | -3.62e-01 | 0.3859 |
| 5046 | PCSK6 | HTA11_99999974143_84620 | Human | Colorectum | MSS | 9.77e-10 | -3.92e-01 | 0.3005 |
| 5046 | PCSK6 | A001-C-207 | Human | Colorectum | FAP | 2.35e-02 | -3.00e-01 | 0.1278 |
| 5046 | PCSK6 | A015-C-203 | Human | Colorectum | FAP | 1.01e-15 | -2.99e-01 | -0.1294 |
| 5046 | PCSK6 | A015-C-204 | Human | Colorectum | FAP | 4.50e-02 | -2.77e-01 | -0.0228 |
| 5046 | PCSK6 | A002-C-201 | Human | Colorectum | FAP | 2.98e-07 | -2.85e-01 | 0.0324 |
| 5046 | PCSK6 | A001-C-119 | Human | Colorectum | FAP | 1.34e-04 | -3.96e-01 | -0.1557 |
| 5046 | PCSK6 | A001-C-108 | Human | Colorectum | FAP | 4.37e-09 | -2.83e-01 | -0.0272 |
| 5046 | PCSK6 | A002-C-205 | Human | Colorectum | FAP | 2.28e-11 | -3.89e-01 | -0.1236 |
| 5046 | PCSK6 | A001-C-104 | Human | Colorectum | FAP | 9.23e-06 | -2.76e-01 | 0.0184 |
| 5046 | PCSK6 | A015-C-005 | Human | Colorectum | FAP | 1.02e-11 | -4.80e-01 | -0.0336 |
| 5046 | PCSK6 | A015-C-006 | Human | Colorectum | FAP | 2.48e-06 | -3.05e-01 | -0.0994 |
| 5046 | PCSK6 | A015-C-106 | Human | Colorectum | FAP | 1.31e-09 | -3.23e-01 | -0.0511 |
| 5046 | PCSK6 | A002-C-114 | Human | Colorectum | FAP | 2.59e-07 | -2.37e-01 | -0.1561 |
| 5046 | PCSK6 | A015-C-104 | Human | Colorectum | FAP | 1.72e-21 | -4.24e-01 | -0.1899 |
| 5046 | PCSK6 | A001-C-014 | Human | Colorectum | FAP | 5.01e-10 | -3.22e-01 | 0.0135 |
| Page: 1 2 3 |
| Tissue | Expression Dynamics | Abbreviation |
| Colorectum (GSE201348) |  | FAP: Familial adenomatous polyposis |
| CRC: Colorectal cancer | ||
| Colorectum (HTA11) |  | AD: Adenomas |
| SER: Sessile serrated lesions | ||
| MSI-H: Microsatellite-high colorectal cancer | ||
| MSS: Microsatellite stable colorectal cancer | ||
| Liver | 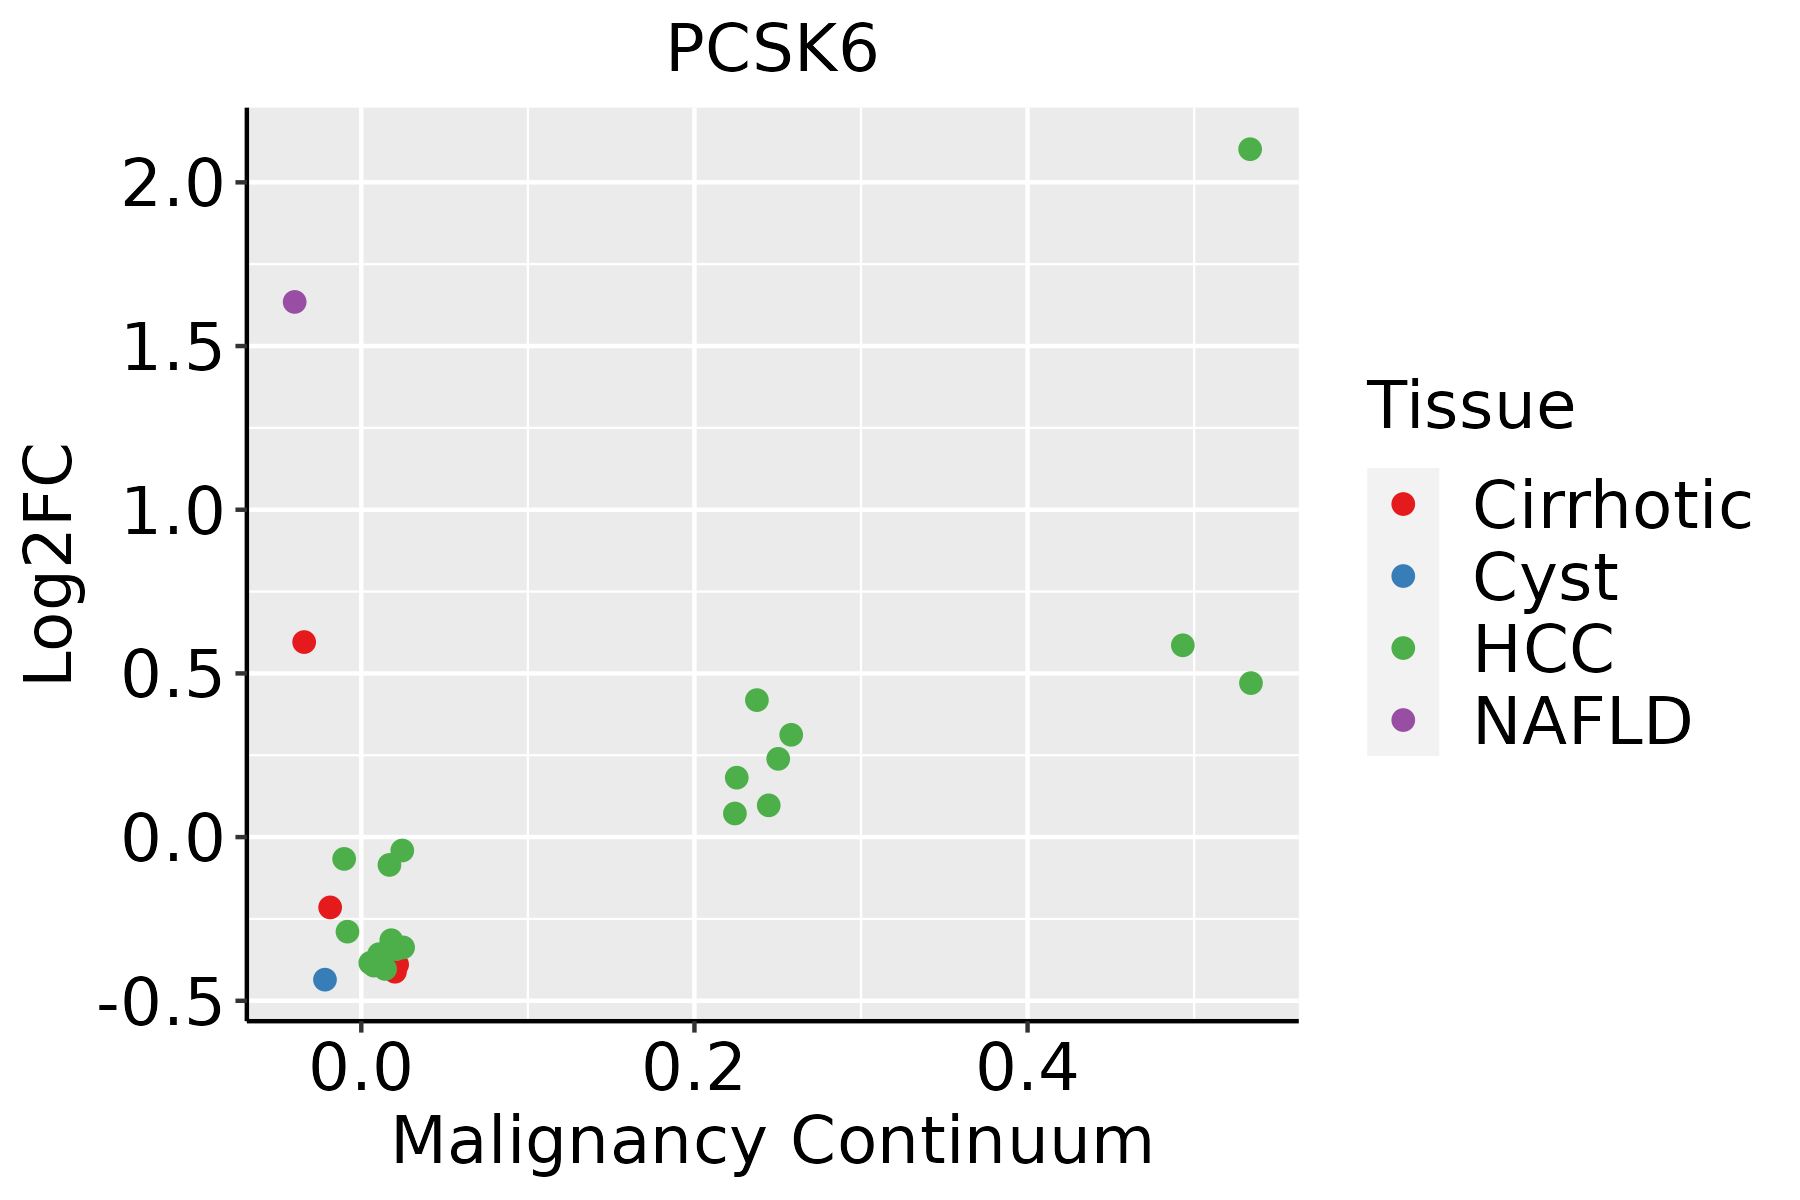 | HCC: Hepatocellular carcinoma |
| NAFLD: Non-alcoholic fatty liver disease |
| ∗log2FC in expression of this searched gene in stem-like cells from each diseased tissue sample relative to stem-like cells in normal samples in each tissue plotted against the malignancy continuum. Samples are colored based on if they are from different disease stage. |
Top |
Malignant transformation related pathway analysis |
| Find out the enriched GO biological processes and KEGG pathways involved in transition from healthy to precancer to cancer |
| Tissue | Disease Stage | Enriched GO biological Processes |
| Colorectum | AD |  |
| Colorectum | SER |  |
| Colorectum | MSS |  |
| Colorectum | MSI-H |  |
| Colorectum | FAP |  |
| ∗Top 15 enriched GO BP terms are showed in the bar plot of each disease state in each tissue. Each row represents a significant GO biological process which is colored according to the -log10(p.adjust). |
| Page: 1 2 3 4 5 6 7 8 9 |
| GO ID | Tissue | Disease Stage | Description | Gene Ratio | Bg Ratio | pvalue | p.adjust | Count |
| GO:0051604 | Colorectum | AD | protein maturation | 85/3918 | 294/18723 | 6.73e-04 | 6.91e-03 | 85 |
| GO:0007178 | Colorectum | AD | transmembrane receptor protein serine/threonine kinase signaling pathway | 99/3918 | 355/18723 | 9.92e-04 | 9.28e-03 | 99 |
| GO:0016485 | Colorectum | AD | protein processing | 63/3918 | 225/18723 | 6.77e-03 | 4.19e-02 | 63 |
| GO:00516041 | Colorectum | SER | protein maturation | 73/2897 | 294/18723 | 1.82e-05 | 5.38e-04 | 73 |
| GO:00164851 | Colorectum | SER | protein processing | 55/2897 | 225/18723 | 2.84e-04 | 4.67e-03 | 55 |
| GO:00516042 | Colorectum | MSS | protein maturation | 75/3467 | 294/18723 | 1.70e-03 | 1.53e-02 | 75 |
| GO:00071781 | Colorectum | MSS | transmembrane receptor protein serine/threonine kinase signaling pathway | 86/3467 | 355/18723 | 4.04e-03 | 2.95e-02 | 86 |
| GO:00164852 | Colorectum | MSS | protein processing | 57/3467 | 225/18723 | 6.60e-03 | 4.38e-02 | 57 |
| GO:00071782 | Colorectum | FAP | transmembrane receptor protein serine/threonine kinase signaling pathway | 81/2622 | 355/18723 | 4.28e-06 | 1.46e-04 | 81 |
| GO:0071772 | Colorectum | FAP | response to BMP | 37/2622 | 165/18723 | 2.20e-03 | 1.80e-02 | 37 |
| GO:0071773 | Colorectum | FAP | cellular response to BMP stimulus | 37/2622 | 165/18723 | 2.20e-03 | 1.80e-02 | 37 |
| GO:0090092 | Colorectum | FAP | regulation of transmembrane receptor protein serine/threonine kinase signaling pathway | 52/2622 | 256/18723 | 3.33e-03 | 2.44e-02 | 52 |
| GO:0030509 | Colorectum | FAP | BMP signaling pathway | 34/2622 | 152/18723 | 3.38e-03 | 2.47e-02 | 34 |
| GO:0009952 | Colorectum | FAP | anterior/posterior pattern specification | 41/2622 | 201/18723 | 7.82e-03 | 4.63e-02 | 41 |
| GO:00071783 | Colorectum | CRC | transmembrane receptor protein serine/threonine kinase signaling pathway | 66/2078 | 355/18723 | 1.74e-05 | 5.28e-04 | 66 |
| GO:00305091 | Colorectum | CRC | BMP signaling pathway | 31/2078 | 152/18723 | 5.73e-04 | 7.89e-03 | 31 |
| GO:00900921 | Colorectum | CRC | regulation of transmembrane receptor protein serine/threonine kinase signaling pathway | 46/2078 | 256/18723 | 6.66e-04 | 8.77e-03 | 46 |
| GO:00717721 | Colorectum | CRC | response to BMP | 32/2078 | 165/18723 | 1.16e-03 | 1.33e-02 | 32 |
| GO:00717731 | Colorectum | CRC | cellular response to BMP stimulus | 32/2078 | 165/18723 | 1.16e-03 | 1.33e-02 | 32 |
| GO:00099521 | Colorectum | CRC | anterior/posterior pattern specification | 36/2078 | 201/18723 | 2.56e-03 | 2.40e-02 | 36 |
| Page: 1 2 |
| Pathway ID | Tissue | Disease Stage | Description | Gene Ratio | Bg Ratio | pvalue | p.adjust | qvalue | Count |
| Page: 1 |
Top |
Cell-cell communication analysis |
| Identification of potential cell-cell interactions between two cell types and their ligand-receptor pairs for different disease states |
| Ligand | Receptor | LRpair | Pathway | Tissue | Disease Stage |
| Page: 1 |
Top |
Single-cell gene regulatory network inference analysis |
| Find out the significant the regulons (TFs) and the target genes of each regulon across cell types for different disease states |
| TF | Cell Type | Tissue | Disease Stage | Target Gene | RSS | Regulon Activity |
| ∗The dot plots of a searched regulon are shown for all cell subpopulations in each disease state of each tissue based on the regulon specific score inferred using pySCENIC and by calculating the average expression. |
| Page: 1 |
Top |
Somatic mutation of malignant transformation related genes |
| Annotation of somatic variants for genes involved in malignant transformation |
| Hugo Symbol | Variant Class | Variant Classification | dbSNP RS | HGVSc | HGVSp | HGVSp Short | SWISSPROT | BIOTYPE | SIFT | PolyPhen | Tumor Sample Barcode | Tissue | Histology | Sex | Age | Stage | Therapy Types | Drugs | Outcome |
| PCSK6 | SNV | Missense_Mutation | c.521N>A | p.Gly174Asp | p.G174D | P29122 | protein_coding | tolerated(0.12) | benign(0.154) | TCGA-AC-A2B8-01 | Breast | breast invasive carcinoma | Female | >=65 | I/II | Chemotherapy | chemo | PD | |
| PCSK6 | SNV | Missense_Mutation | rs370069260 | c.536G>A | p.Arg179His | p.R179H | P29122 | protein_coding | tolerated(0.6) | probably_damaging(0.991) | TCGA-AR-A0TT-01 | Breast | breast invasive carcinoma | Female | <65 | III/IV | Chemotherapy | doxorubicin | SD |
| PCSK6 | SNV | Missense_Mutation | rs372628533 | c.1565N>T | p.Thr522Met | p.T522M | P29122 | protein_coding | tolerated(0.14) | possibly_damaging(0.579) | TCGA-E2-A15G-01 | Breast | breast invasive carcinoma | Female | >=65 | I/II | Hormone Therapy | arimidex | SD |
| PCSK6 | SNV | Missense_Mutation | rs374241841 | c.1493N>T | p.Ser498Leu | p.S498L | P29122 | protein_coding | tolerated(0.06) | benign(0.084) | TCGA-LL-A5YO-01 | Breast | breast invasive carcinoma | Female | <65 | I/II | Chemotherapy | taxotere | CR |
| PCSK6 | SNV | Missense_Mutation | novel | c.1127N>A | p.Gly376Asp | p.G376D | P29122 | protein_coding | deleterious(0) | probably_damaging(1) | TCGA-2W-A8YY-01 | Cervix | cervical & endocervical cancer | Female | <65 | I/II | Chemotherapy | cisplatin | CR |
| PCSK6 | SNV | Missense_Mutation | rs749421067 | c.928G>A | p.Asp310Asn | p.D310N | P29122 | protein_coding | deleterious(0) | probably_damaging(0.999) | TCGA-C5-A2LX-01 | Cervix | cervical & endocervical cancer | Female | <65 | I/II | Chemotherapy | cisplatin | SD |
| PCSK6 | SNV | Missense_Mutation | c.528G>C | p.Lys176Asn | p.K176N | P29122 | protein_coding | tolerated(0.62) | benign(0.136) | TCGA-DR-A0ZM-01 | Cervix | cervical & endocervical cancer | Female | <65 | III/IV | Unspecific | Cisplatin | SD | |
| PCSK6 | SNV | Missense_Mutation | rs766469441 | c.1937G>A | p.Arg646His | p.R646H | P29122 | protein_coding | tolerated(0.06) | possibly_damaging(0.873) | TCGA-EA-A3HR-01 | Cervix | cervical & endocervical cancer | Female | <65 | I/II | Unknown | Unknown | SD |
| PCSK6 | SNV | Missense_Mutation | novel | c.2548N>T | p.His850Tyr | p.H850Y | P29122 | protein_coding | deleterious(0.03) | benign(0.091) | TCGA-EA-A3QE-01 | Cervix | cervical & endocervical cancer | Female | <65 | I/II | Unknown | Unknown | SD |
| PCSK6 | SNV | Missense_Mutation | rs777347665 | c.1585N>A | p.Ala529Thr | p.A529T | P29122 | protein_coding | tolerated(0.21) | benign(0.238) | TCGA-A6-6141-01 | Colorectum | colon adenocarcinoma | Male | <65 | I/II | Chemotherapy | 5-fu | SD |
| Page: 1 2 3 4 5 6 7 8 9 |
Top |
Related drugs of malignant transformation related genes |
| Identification of chemicals and drugs interact with genes involved in malignant transfromation |
| (DGIdb 4.0) |
| Entrez ID | Symbol | Category | Interaction Types | Drug Claim Name | Drug Name | PMIDs |
| 5046 | PCSK6 | PROTEASE, DRUGGABLE GENOME, ENZYME, CELL SURFACE | inhibitor | 252166858 | ||
| 5046 | PCSK6 | PROTEASE, DRUGGABLE GENOME, ENZYME, CELL SURFACE | inhibitor | 178103178 | ||
| 5046 | PCSK6 | PROTEASE, DRUGGABLE GENOME, ENZYME, CELL SURFACE | inhibitor | 252166848 | ||
| 5046 | PCSK6 | PROTEASE, DRUGGABLE GENOME, ENZYME, CELL SURFACE | inhibitor | 252166868 |
| Page: 1 |

Copyright 2023-Present -The University of Texas Health Science Center at Houston |