
|
|||||
|
 | |
| |
| |
| |
| |
| |
|
Gene: PCSK5 |
Gene summary for PCSK5 |
| Gene information | Species | Human | Gene symbol | PCSK5 | Gene ID | 5125 |
| Gene name | proprotein convertase subtilisin/kexin type 5 | |
| Gene Alias | PC5 | |
| Cytomap | 9q21.13 | |
| Gene Type | protein-coding | GO ID | GO:0000003 | UniProtAcc | Q92824 |
Top |
Malignant transformation analysis |
| Identification of the aberrant gene expression in precancerous and cancerous lesions by comparing the gene expression of stem-like cells in diseased tissues with normal stem cells |
| Entrez ID | Symbol | Replicates | Species | Organ | Tissue | Adj P-value | Log2FC | Malignancy |
| 5125 | PCSK5 | HTA11_3410_2000001011 | Human | Colorectum | AD | 3.06e-51 | -1.22e+00 | 0.0155 |
| 5125 | PCSK5 | HTA11_2951_2000001011 | Human | Colorectum | AD | 7.25e-06 | -1.09e+00 | 0.0216 |
| 5125 | PCSK5 | HTA11_1938_2000001011 | Human | Colorectum | AD | 5.44e-11 | -6.95e-01 | -0.0811 |
| 5125 | PCSK5 | HTA11_78_2000001011 | Human | Colorectum | AD | 8.71e-03 | -1.35e-01 | -0.1088 |
| 5125 | PCSK5 | HTA11_347_2000001011 | Human | Colorectum | AD | 3.35e-36 | 1.24e+00 | -0.1954 |
| 5125 | PCSK5 | HTA11_83_2000001011 | Human | Colorectum | SER | 1.13e-02 | 4.30e-01 | -0.1526 |
| 5125 | PCSK5 | HTA11_696_2000001011 | Human | Colorectum | AD | 1.25e-03 | 3.50e-02 | -0.1464 |
| 5125 | PCSK5 | HTA11_9341_2000001011 | Human | Colorectum | SER | 2.35e-02 | -5.94e-01 | -0.00410000000000005 |
| 5125 | PCSK5 | HTA11_866_3004761011 | Human | Colorectum | AD | 1.24e-32 | -1.04e+00 | 0.096 |
| 5125 | PCSK5 | HTA11_9408_2000001011 | Human | Colorectum | AD | 4.83e-07 | -1.12e+00 | 0.0451 |
| 5125 | PCSK5 | HTA11_8622_2000001021 | Human | Colorectum | SER | 2.33e-07 | -9.56e-01 | 0.0528 |
| 5125 | PCSK5 | HTA11_10711_2000001011 | Human | Colorectum | AD | 3.10e-17 | -9.34e-01 | 0.0338 |
| 5125 | PCSK5 | HTA11_7696_3000711011 | Human | Colorectum | AD | 3.36e-71 | -1.22e+00 | 0.0674 |
| 5125 | PCSK5 | HTA11_6818_2000001011 | Human | Colorectum | AD | 1.34e-13 | -9.85e-01 | 0.0112 |
| 5125 | PCSK5 | HTA11_6818_2000001021 | Human | Colorectum | AD | 5.71e-26 | -1.19e+00 | 0.0588 |
| 5125 | PCSK5 | HTA11_99999970781_79442 | Human | Colorectum | MSS | 1.14e-57 | -1.12e+00 | 0.294 |
| 5125 | PCSK5 | HTA11_99999965062_69753 | Human | Colorectum | MSI-H | 2.20e-02 | -8.59e-01 | 0.3487 |
| 5125 | PCSK5 | HTA11_99999965104_69814 | Human | Colorectum | MSS | 1.70e-25 | -9.11e-01 | 0.281 |
| 5125 | PCSK5 | HTA11_99999971662_82457 | Human | Colorectum | MSS | 3.09e-34 | -9.05e-01 | 0.3859 |
| 5125 | PCSK5 | HTA11_99999973899_84307 | Human | Colorectum | MSS | 7.93e-22 | -1.28e+00 | 0.2585 |
| Page: 1 2 3 4 5 6 |
| Tissue | Expression Dynamics | Abbreviation |
| Colorectum (GSE201348) |  | FAP: Familial adenomatous polyposis |
| CRC: Colorectal cancer | ||
| Colorectum (HTA11) |  | AD: Adenomas |
| SER: Sessile serrated lesions | ||
| MSI-H: Microsatellite-high colorectal cancer | ||
| MSS: Microsatellite stable colorectal cancer | ||
| Esophagus | 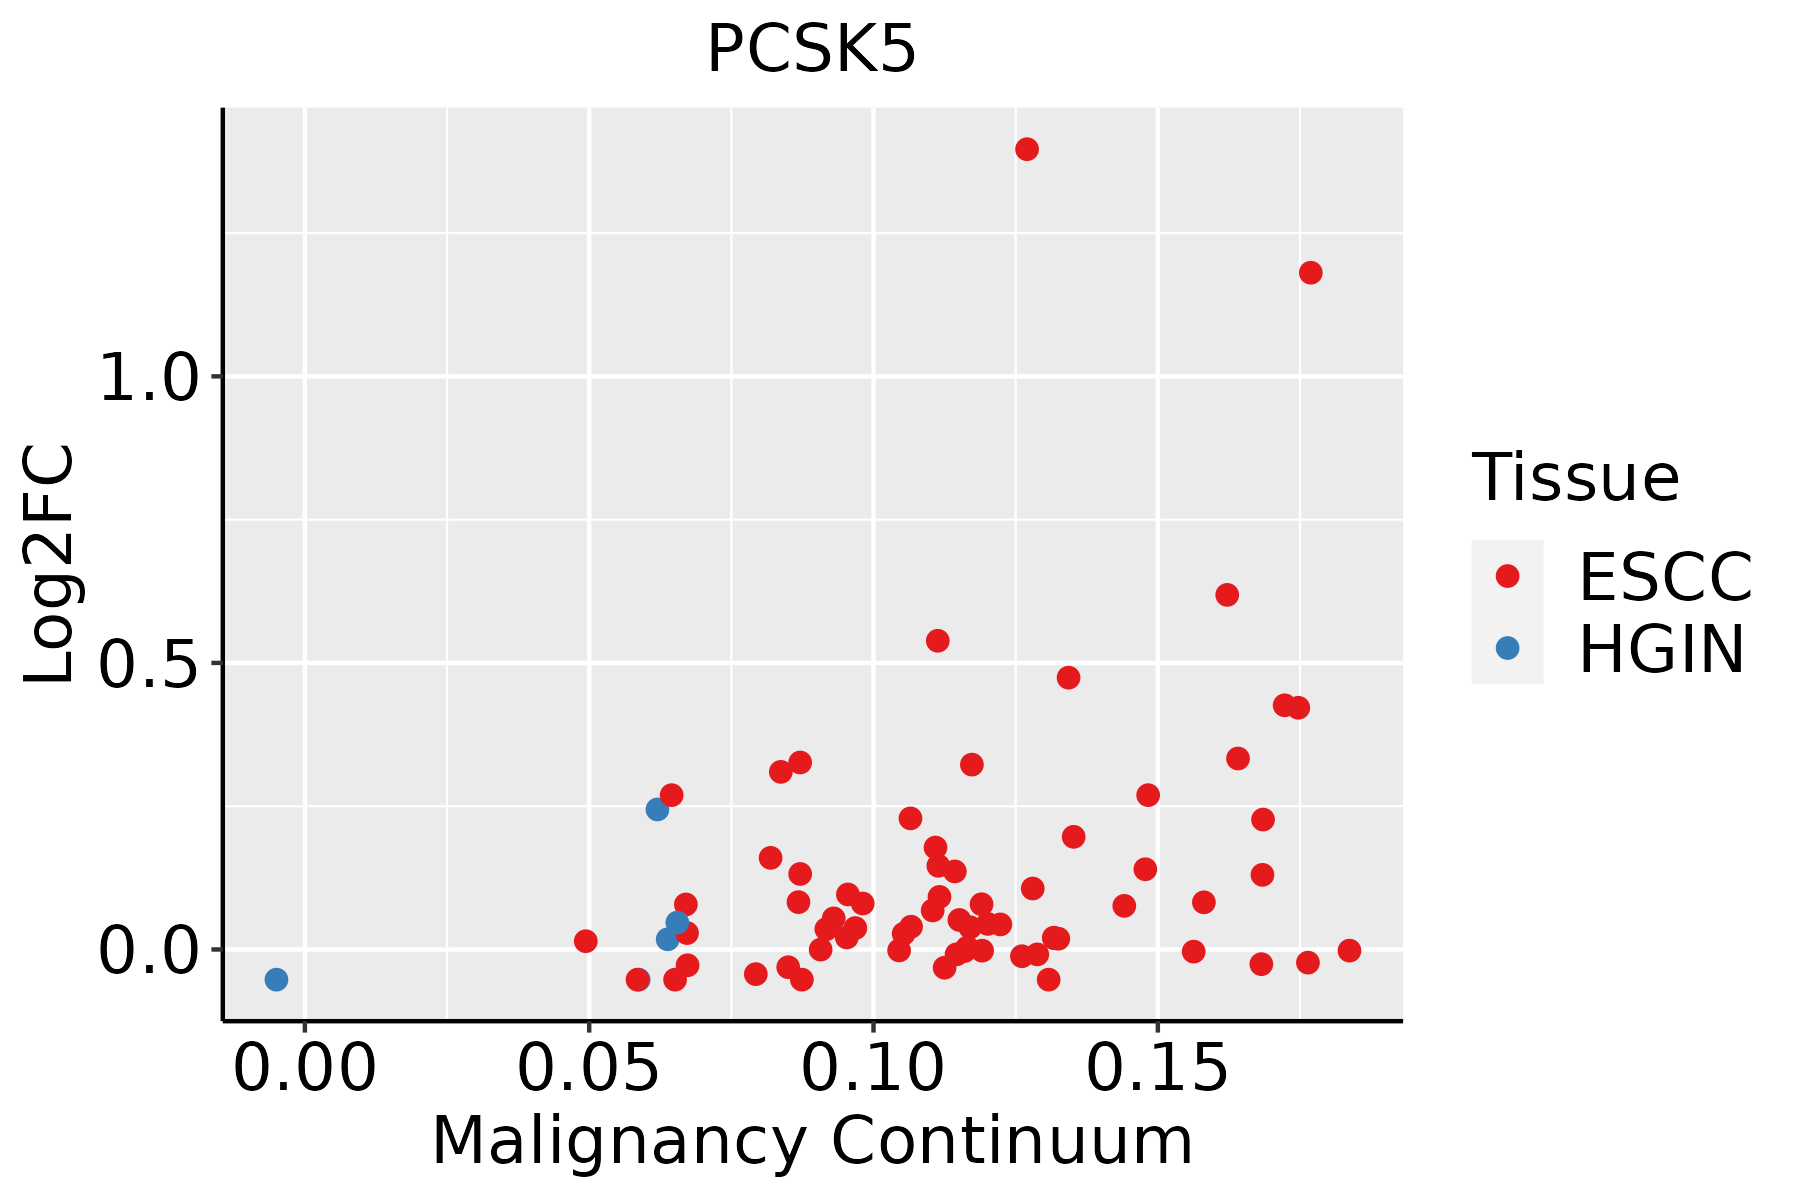 | ESCC: Esophageal squamous cell carcinoma |
| HGIN: High-grade intraepithelial neoplasias | ||
| LGIN: Low-grade intraepithelial neoplasias | ||
| GC |  | CAG: Chronic atrophic gastritis |
| CAG with IM: Chronic atrophic gastritis with intestinal metaplasia | ||
| CSG: Chronic superficial gastritis | ||
| GC: Gastric cancer | ||
| SIM: Severe intestinal metaplasia | ||
| WIM: Wild intestinal metaplasia | ||
| Liver | 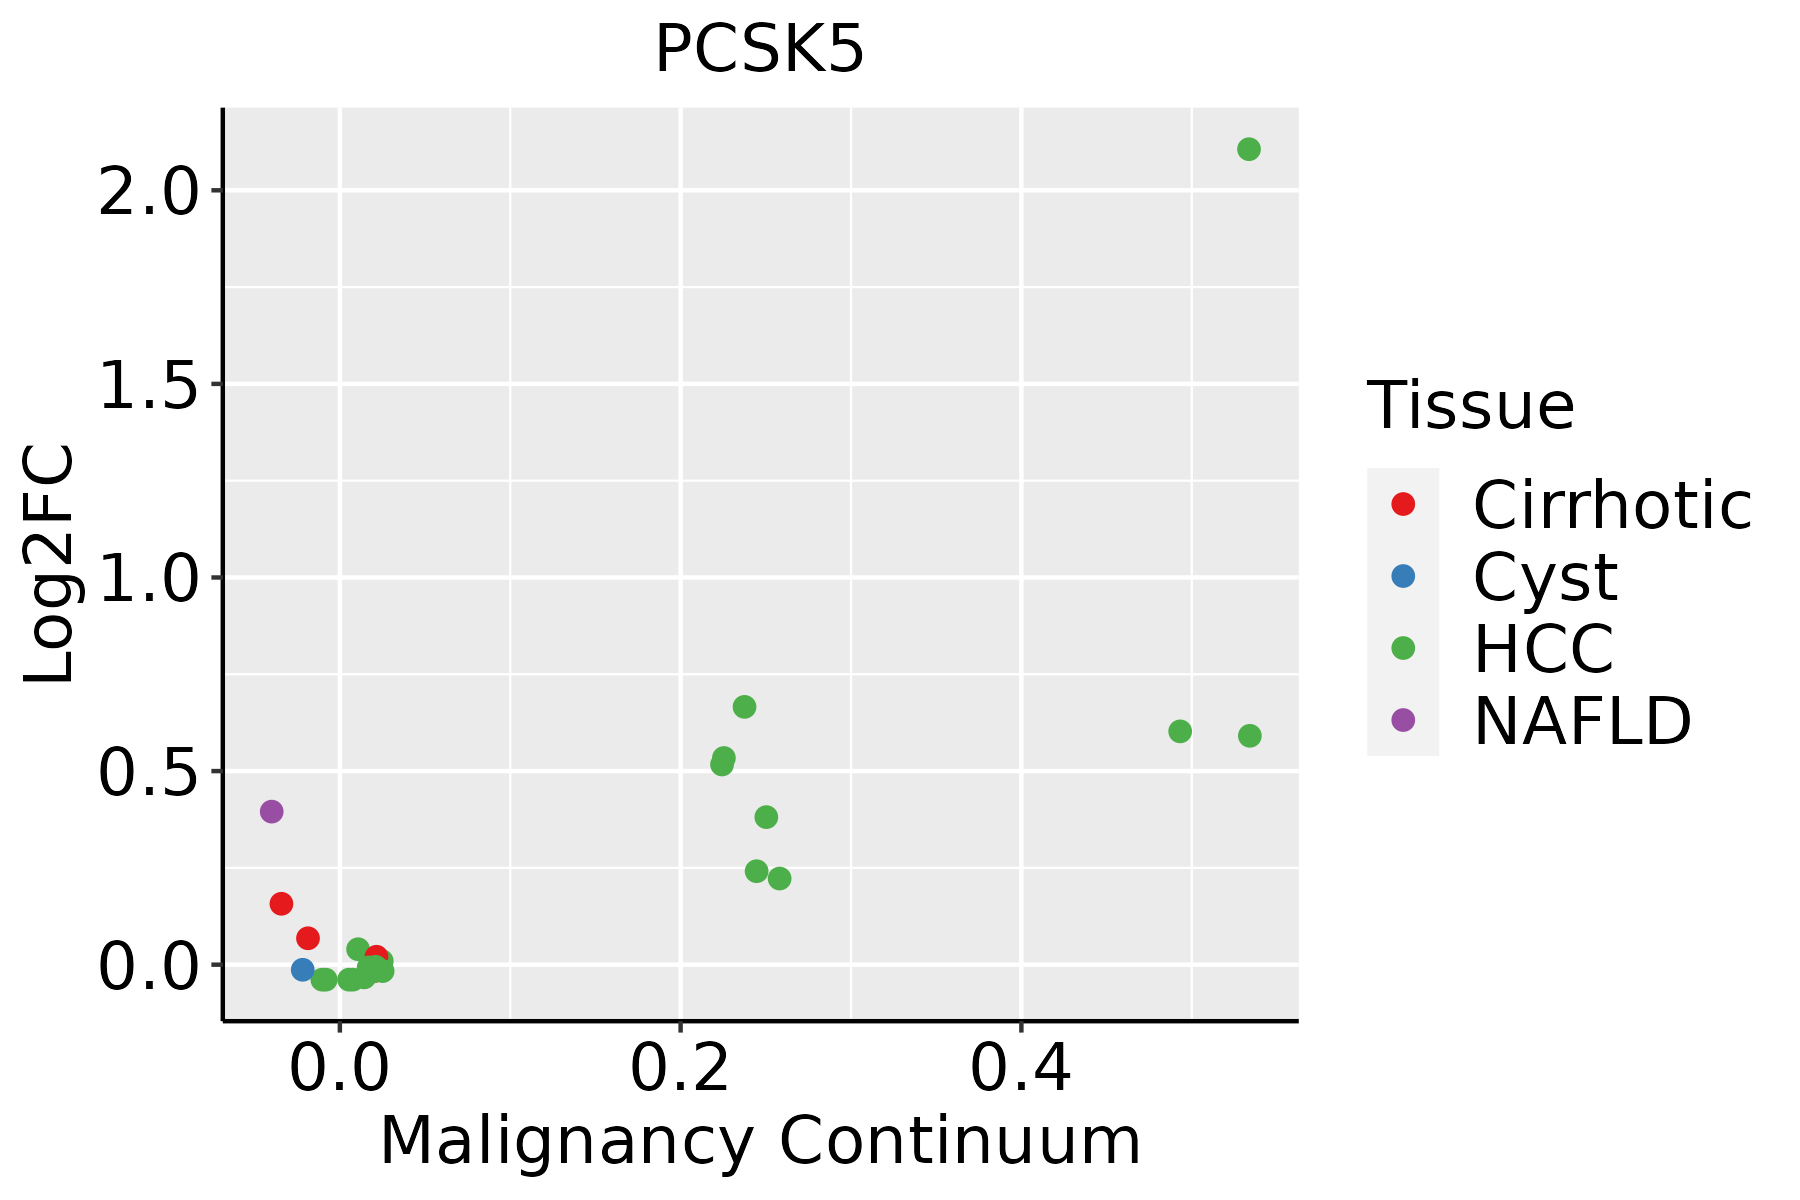 | HCC: Hepatocellular carcinoma |
| NAFLD: Non-alcoholic fatty liver disease | ||
| Lung |  | AAH: Atypical adenomatous hyperplasia |
| AIS: Adenocarcinoma in situ | ||
| IAC: Invasive lung adenocarcinoma | ||
| MIA: Minimally invasive adenocarcinoma | ||
| Oral Cavity | 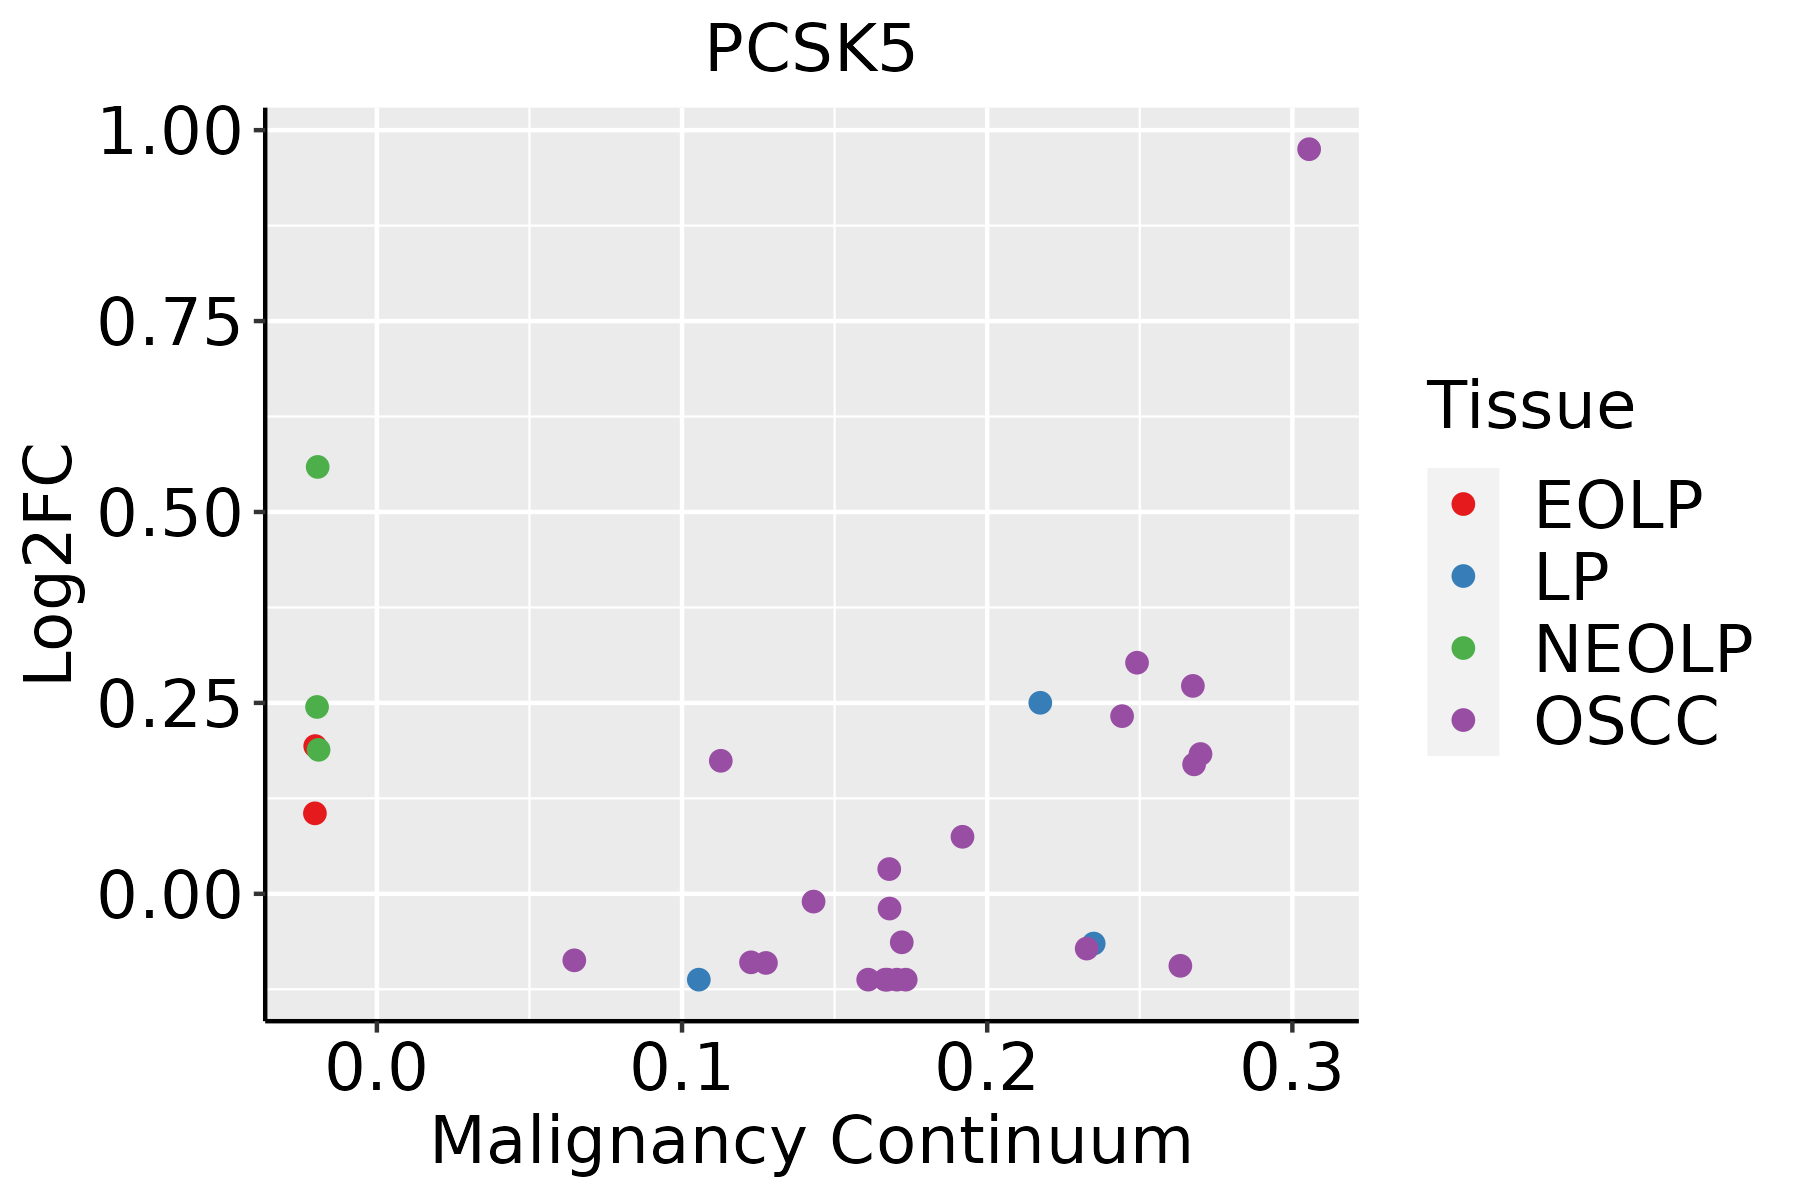 | EOLP: Erosive Oral lichen planus |
| LP: leukoplakia | ||
| NEOLP: Non-erosive oral lichen planus | ||
| OSCC: Oral squamous cell carcinoma |
| ∗log2FC in expression of this searched gene in stem-like cells from each diseased tissue sample relative to stem-like cells in normal samples in each tissue plotted against the malignancy continuum. Samples are colored based on if they are from different disease stage. |
Top |
Malignant transformation related pathway analysis |
| Find out the enriched GO biological processes and KEGG pathways involved in transition from healthy to precancer to cancer |
| Tissue | Disease Stage | Enriched GO biological Processes |
| Colorectum | AD |  |
| Colorectum | SER |  |
| Colorectum | MSS |  |
| Colorectum | MSI-H |  |
| Colorectum | FAP |  |
| ∗Top 15 enriched GO BP terms are showed in the bar plot of each disease state in each tissue. Each row represents a significant GO biological process which is colored according to the -log10(p.adjust). |
| Page: 1 2 3 4 5 6 7 8 9 |
| GO ID | Tissue | Disease Stage | Description | Gene Ratio | Bg Ratio | pvalue | p.adjust | Count |
| GO:0016032 | Colorectum | AD | viral process | 168/3918 | 415/18723 | 4.67e-20 | 3.66e-17 | 168 |
| GO:0019058 | Colorectum | AD | viral life cycle | 119/3918 | 317/18723 | 6.18e-12 | 8.23e-10 | 119 |
| GO:0006465 | Colorectum | AD | signal peptide processing | 10/3918 | 14/18723 | 6.90e-05 | 1.11e-03 | 10 |
| GO:0009306 | Colorectum | AD | protein secretion | 105/3918 | 359/18723 | 1.05e-04 | 1.57e-03 | 105 |
| GO:0035592 | Colorectum | AD | establishment of protein localization to extracellular region | 105/3918 | 360/18723 | 1.18e-04 | 1.73e-03 | 105 |
| GO:0071692 | Colorectum | AD | protein localization to extracellular region | 106/3918 | 368/18723 | 1.86e-04 | 2.49e-03 | 106 |
| GO:0051604 | Colorectum | AD | protein maturation | 85/3918 | 294/18723 | 6.73e-04 | 6.91e-03 | 85 |
| GO:0048736 | Colorectum | AD | appendage development | 51/3918 | 172/18723 | 4.20e-03 | 2.89e-02 | 51 |
| GO:0060173 | Colorectum | AD | limb development | 51/3918 | 172/18723 | 4.20e-03 | 2.89e-02 | 51 |
| GO:0048568 | Colorectum | AD | embryonic organ development | 112/3918 | 427/18723 | 4.60e-03 | 3.14e-02 | 112 |
| GO:0003014 | Colorectum | AD | renal system process | 35/3918 | 110/18723 | 4.85e-03 | 3.27e-02 | 35 |
| GO:0016485 | Colorectum | AD | protein processing | 63/3918 | 225/18723 | 6.77e-03 | 4.19e-02 | 63 |
| GO:00160321 | Colorectum | SER | viral process | 118/2897 | 415/18723 | 8.36e-12 | 1.65e-09 | 118 |
| GO:00190581 | Colorectum | SER | viral life cycle | 87/2897 | 317/18723 | 2.82e-08 | 1.94e-06 | 87 |
| GO:00516041 | Colorectum | SER | protein maturation | 73/2897 | 294/18723 | 1.82e-05 | 5.38e-04 | 73 |
| GO:00164851 | Colorectum | SER | protein processing | 55/2897 | 225/18723 | 2.84e-04 | 4.67e-03 | 55 |
| GO:00093061 | Colorectum | SER | protein secretion | 79/2897 | 359/18723 | 5.99e-04 | 8.19e-03 | 79 |
| GO:00355921 | Colorectum | SER | establishment of protein localization to extracellular region | 79/2897 | 360/18723 | 6.54e-04 | 8.77e-03 | 79 |
| GO:00716921 | Colorectum | SER | protein localization to extracellular region | 80/2897 | 368/18723 | 8.13e-04 | 1.01e-02 | 80 |
| GO:00030141 | Colorectum | SER | renal system process | 30/2897 | 110/18723 | 1.05e-03 | 1.22e-02 | 30 |
| Page: 1 2 3 4 5 6 7 8 9 |
| Pathway ID | Tissue | Disease Stage | Description | Gene Ratio | Bg Ratio | pvalue | p.adjust | qvalue | Count |
| Page: 1 |
Top |
Cell-cell communication analysis |
| Identification of potential cell-cell interactions between two cell types and their ligand-receptor pairs for different disease states |
| Ligand | Receptor | LRpair | Pathway | Tissue | Disease Stage |
| Page: 1 |
Top |
Single-cell gene regulatory network inference analysis |
| Find out the significant the regulons (TFs) and the target genes of each regulon across cell types for different disease states |
| TF | Cell Type | Tissue | Disease Stage | Target Gene | RSS | Regulon Activity |
| ∗The dot plots of a searched regulon are shown for all cell subpopulations in each disease state of each tissue based on the regulon specific score inferred using pySCENIC and by calculating the average expression. |
| Page: 1 |
Top |
Somatic mutation of malignant transformation related genes |
| Annotation of somatic variants for genes involved in malignant transformation |
| Hugo Symbol | Variant Class | Variant Classification | dbSNP RS | HGVSc | HGVSp | HGVSp Short | SWISSPROT | BIOTYPE | SIFT | PolyPhen | Tumor Sample Barcode | Tissue | Histology | Sex | Age | Stage | Therapy Types | Drugs | Outcome |
| PCSK5 | SNV | Missense_Mutation | novel | c.5425N>C | p.Glu1809Gln | p.E1809Q | Q92824 | protein_coding | tolerated(0.06) | benign(0.198) | TCGA-A2-A0CR-01 | Breast | breast invasive carcinoma | Female | <65 | I/II | Chemotherapy | adriamycin | CR |
| PCSK5 | SNV | Missense_Mutation | rs752780597 | c.4225A>G | p.Thr1409Ala | p.T1409A | Q92824 | protein_coding | tolerated(0.29) | benign(0.162) | TCGA-A8-A07B-01 | Breast | breast invasive carcinoma | Female | >=65 | I/II | Unknown | Unknown | SD |
| PCSK5 | SNV | Missense_Mutation | rs763309564 | c.1391N>A | p.Arg464Gln | p.R464Q | Q92824 | protein_coding | tolerated(1) | benign(0) | TCGA-A8-A07O-01 | Breast | breast invasive carcinoma | Female | <65 | I/II | Chemotherapy | CR | |
| PCSK5 | SNV | Missense_Mutation | novel | c.2485N>A | p.Glu829Lys | p.E829K | Q92824 | protein_coding | deleterious(0.03) | benign(0.039) | TCGA-BH-A0B6-01 | Breast | breast invasive carcinoma | Female | <65 | I/II | Unknown | Unknown | SD |
| PCSK5 | SNV | Missense_Mutation | c.2609G>C | p.Gly870Ala | p.G870A | Q92824 | protein_coding | deleterious(0.01) | possibly_damaging(0.643) | TCGA-BH-A0DZ-01 | Breast | breast invasive carcinoma | Female | <65 | I/II | Chemotherapy | docetaxel | SD | |
| PCSK5 | SNV | Missense_Mutation | c.471N>C | p.Lys157Asn | p.K157N | Q92824 | protein_coding | deleterious(0) | benign(0.313) | TCGA-BH-A0W7-01 | Breast | breast invasive carcinoma | Female | <65 | I/II | Chemotherapy | taxotere | CR | |
| PCSK5 | SNV | Missense_Mutation | c.1817N>G | p.Thr606Ser | p.T606S | Q92824 | protein_coding | tolerated(0.18) | benign(0.029) | TCGA-BH-A1F2-01 | Breast | breast invasive carcinoma | Female | <65 | III/IV | Unknown | Unknown | SD | |
| PCSK5 | SNV | Missense_Mutation | rs373649072 | c.2213N>A | p.Arg738Gln | p.R738Q | Q92824 | protein_coding | deleterious(0.02) | probably_damaging(0.915) | TCGA-E2-A1IE-01 | Breast | breast invasive carcinoma | Female | <65 | I/II | Chemotherapy | doxorubicin | PD |
| PCSK5 | SNV | Missense_Mutation | c.2276G>C | p.Gly759Ala | p.G759A | Q92824 | protein_coding | deleterious(0) | probably_damaging(0.943) | TCGA-E2-A1LH-01 | Breast | breast invasive carcinoma | Female | <65 | I/II | Chemotherapy | adriamycin | SD | |
| PCSK5 | insertion | Frame_Shift_Ins | novel | c.3960_3961insCAATTCTCCTGTCTCAGCCTCCCGAGTAGCT | p.Gly1321GlnfsTer26 | p.G1321Qfs*26 | Q92824 | protein_coding | TCGA-A8-A06X-01 | Breast | breast invasive carcinoma | Female | >=65 | I/II | Unknown | Unknown | SD |
| Page: 1 2 3 4 5 6 7 8 9 10 11 12 13 14 15 16 17 18 |
Top |
Related drugs of malignant transformation related genes |
| Identification of chemicals and drugs interact with genes involved in malignant transfromation |
| (DGIdb 4.0) |
| Entrez ID | Symbol | Category | Interaction Types | Drug Claim Name | Drug Name | PMIDs |
| 5125 | PCSK5 | PROTEASE, DRUGGABLE GENOME, ENZYME | inhibitor | 178103178 | ||
| 5125 | PCSK5 | PROTEASE, DRUGGABLE GENOME, ENZYME | inhibitor | 252166868 |
| Page: 1 |

Copyright 2023-Present -The University of Texas Health Science Center at Houston |