
|
|||||
|
 | |
| |
| |
| |
| |
| |
|
Gene: PCP4L1 |
Gene summary for PCP4L1 |
| Gene information | Species | Human | Gene symbol | PCP4L1 | Gene ID | 654790 |
| Gene name | Purkinje cell protein 4 like 1 | |
| Gene Alias | IQM1 | |
| Cytomap | 1q23.3 | |
| Gene Type | protein-coding | GO ID | NA | UniProtAcc | A6NKN8 |
Top |
Malignant transformation analysis |
| Identification of the aberrant gene expression in precancerous and cancerous lesions by comparing the gene expression of stem-like cells in diseased tissues with normal stem cells |
| Entrez ID | Symbol | Replicates | Species | Organ | Tissue | Adj P-value | Log2FC | Malignancy |
| 654790 | PCP4L1 | LZE8T | Human | Esophagus | ESCC | 1.65e-04 | 1.70e-01 | 0.067 |
| 654790 | PCP4L1 | LZE20T | Human | Esophagus | ESCC | 8.11e-14 | 7.70e-01 | 0.0662 |
| 654790 | PCP4L1 | LZE21D1 | Human | Esophagus | HGIN | 5.38e-03 | 7.20e-01 | 0.0632 |
| 654790 | PCP4L1 | LZE22D1 | Human | Esophagus | HGIN | 2.88e-06 | 3.35e-01 | 0.0595 |
| 654790 | PCP4L1 | LZE21T | Human | Esophagus | ESCC | 9.73e-05 | 3.79e-01 | 0.0655 |
| 654790 | PCP4L1 | P1T-E | Human | Esophagus | ESCC | 4.53e-14 | 9.81e-01 | 0.0875 |
| 654790 | PCP4L1 | P4T-E | Human | Esophagus | ESCC | 2.44e-34 | 9.99e-01 | 0.1323 |
| 654790 | PCP4L1 | P9T-E | Human | Esophagus | ESCC | 8.38e-03 | 1.67e-01 | 0.1131 |
| 654790 | PCP4L1 | P10T-E | Human | Esophagus | ESCC | 1.66e-03 | 2.15e-01 | 0.116 |
| 654790 | PCP4L1 | P15T-E | Human | Esophagus | ESCC | 3.38e-04 | 2.44e-01 | 0.1149 |
| 654790 | PCP4L1 | P20T-E | Human | Esophagus | ESCC | 5.63e-18 | 5.05e-01 | 0.1124 |
| 654790 | PCP4L1 | P23T-E | Human | Esophagus | ESCC | 2.33e-14 | 6.22e-01 | 0.108 |
| 654790 | PCP4L1 | P26T-E | Human | Esophagus | ESCC | 1.69e-08 | 2.16e-01 | 0.1276 |
| 654790 | PCP4L1 | P27T-E | Human | Esophagus | ESCC | 2.58e-36 | 8.85e-01 | 0.1055 |
| 654790 | PCP4L1 | P30T-E | Human | Esophagus | ESCC | 1.19e-09 | 4.86e-01 | 0.137 |
| 654790 | PCP4L1 | P36T-E | Human | Esophagus | ESCC | 9.55e-10 | 8.32e-01 | 0.1187 |
| 654790 | PCP4L1 | P40T-E | Human | Esophagus | ESCC | 1.47e-07 | 3.89e-01 | 0.109 |
| 654790 | PCP4L1 | P42T-E | Human | Esophagus | ESCC | 1.03e-12 | 6.11e-01 | 0.1175 |
| 654790 | PCP4L1 | P48T-E | Human | Esophagus | ESCC | 4.18e-06 | 3.02e-01 | 0.0959 |
| 654790 | PCP4L1 | P54T-E | Human | Esophagus | ESCC | 2.58e-07 | 2.60e-01 | 0.0975 |
| Page: 1 2 |
| Tissue | Expression Dynamics | Abbreviation |
| Esophagus | 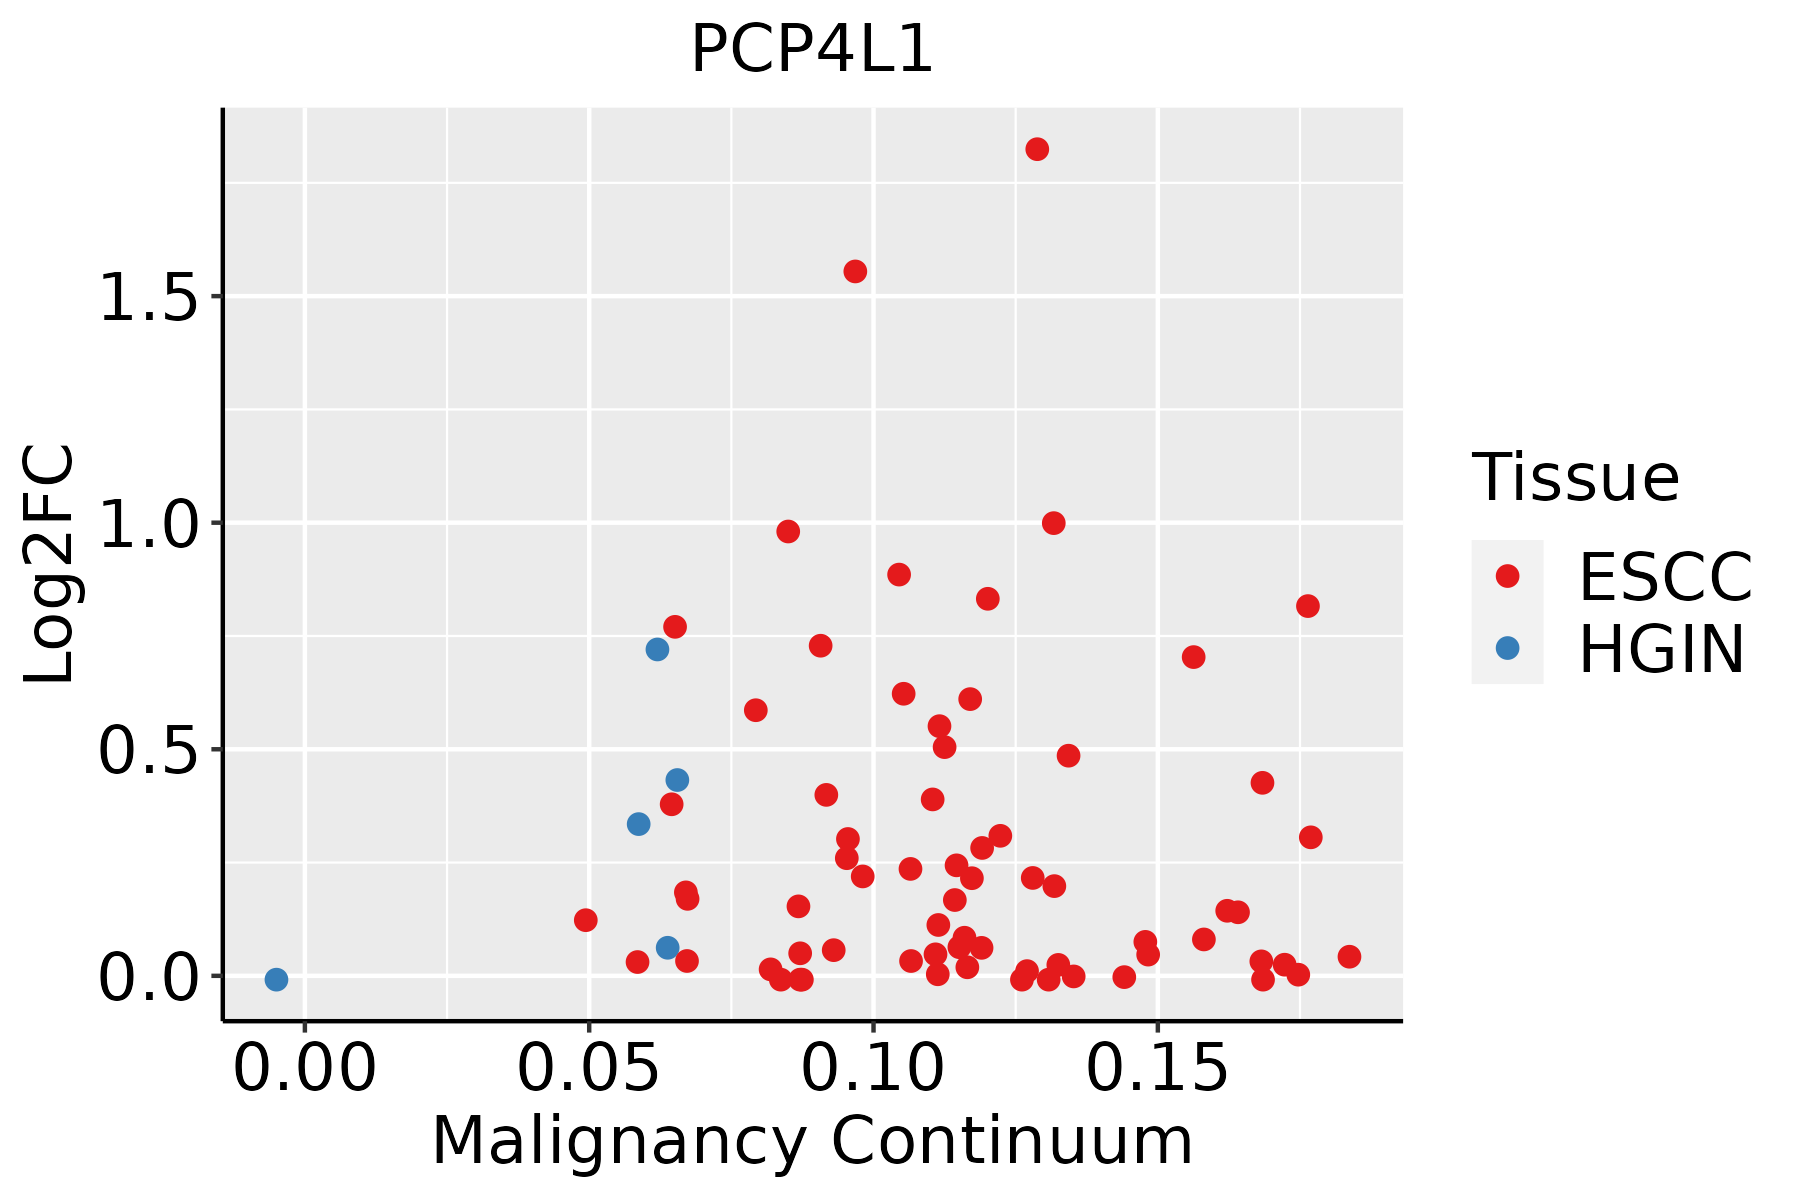 | ESCC: Esophageal squamous cell carcinoma |
| HGIN: High-grade intraepithelial neoplasias | ||
| LGIN: Low-grade intraepithelial neoplasias | ||
| Oral Cavity | 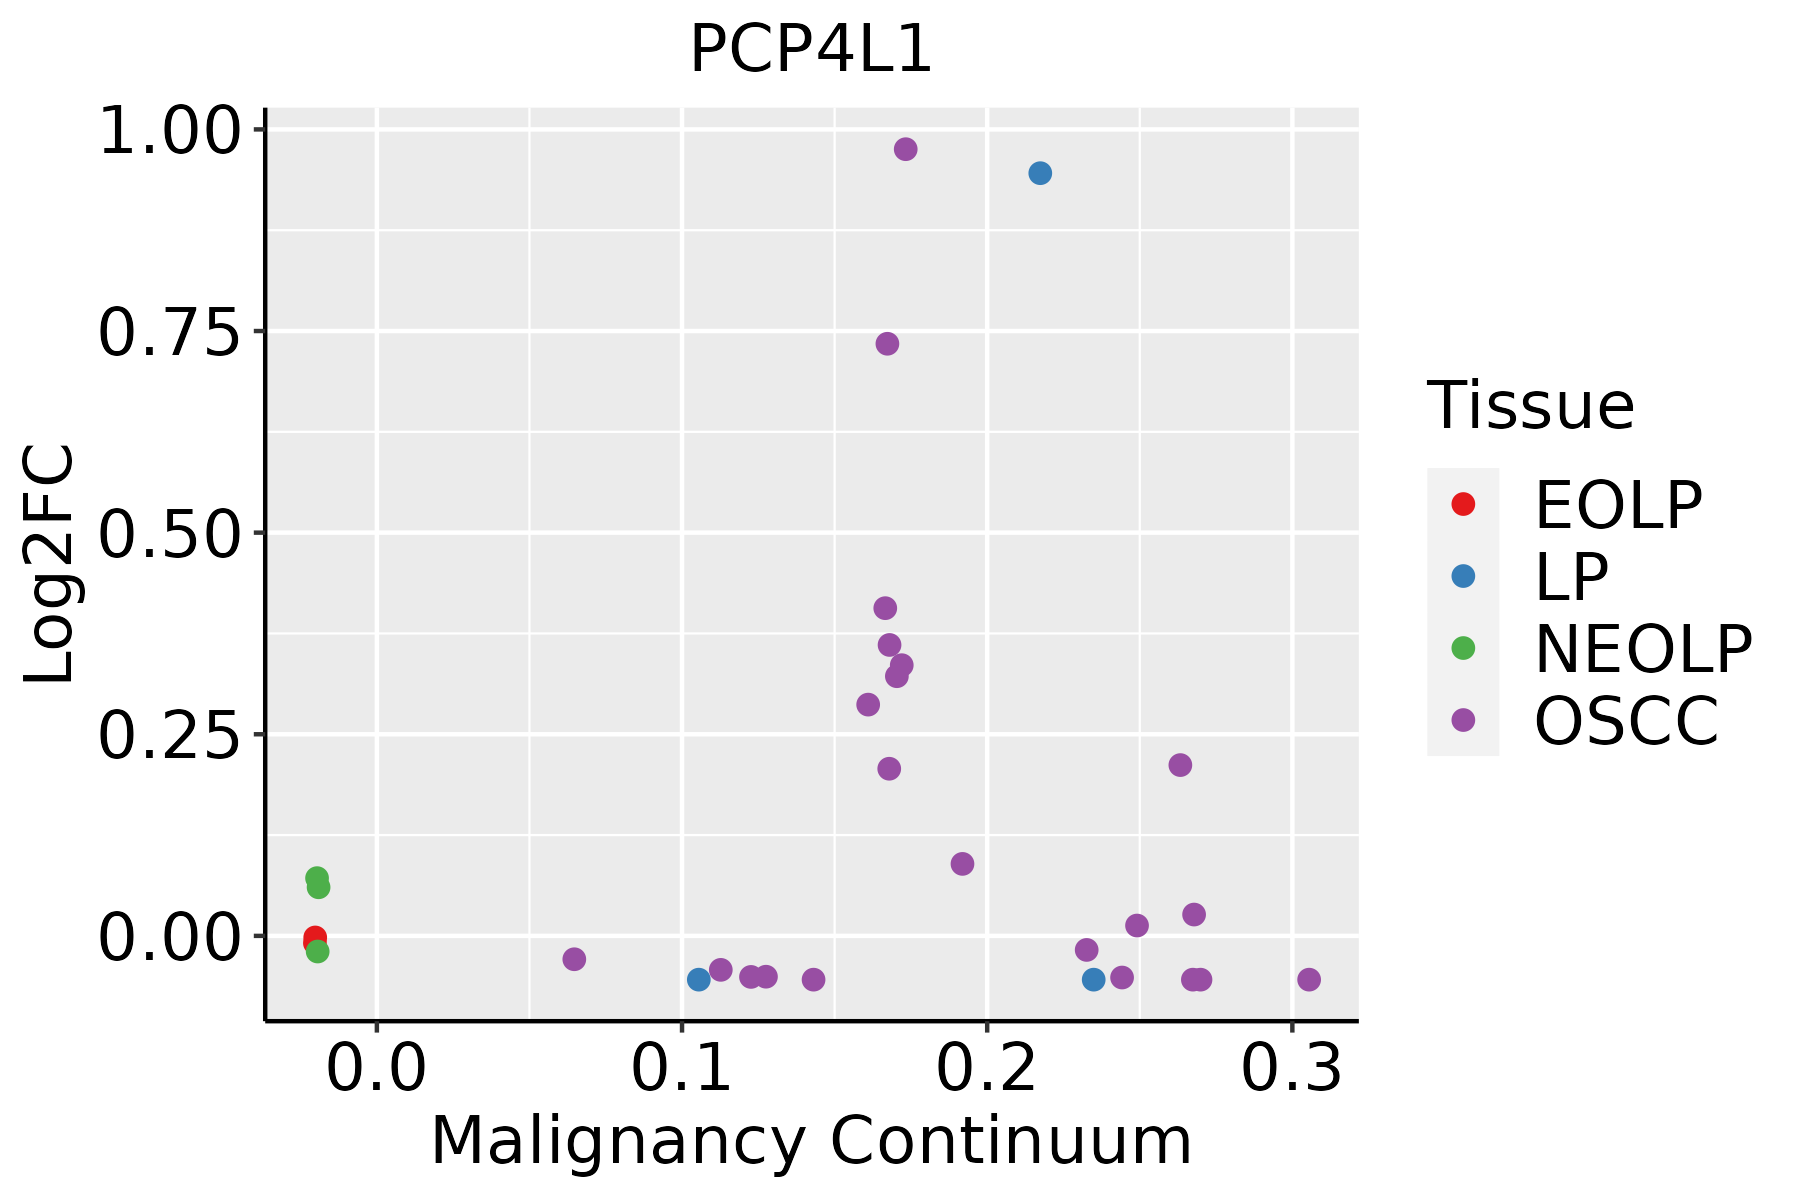 | EOLP: Erosive Oral lichen planus |
| LP: leukoplakia | ||
| NEOLP: Non-erosive oral lichen planus | ||
| OSCC: Oral squamous cell carcinoma |
| ∗log2FC in expression of this searched gene in stem-like cells from each diseased tissue sample relative to stem-like cells in normal samples in each tissue plotted against the malignancy continuum. Samples are colored based on if they are from different disease stage. |
Top |
Malignant transformation related pathway analysis |
| Find out the enriched GO biological processes and KEGG pathways involved in transition from healthy to precancer to cancer |
| Tissue | Disease Stage | Enriched GO biological Processes |
| Colorectum | AD |  |
| Colorectum | SER |  |
| Colorectum | MSS |  |
| Colorectum | MSI-H |  |
| Colorectum | FAP |  |
| ∗Top 15 enriched GO BP terms are showed in the bar plot of each disease state in each tissue. Each row represents a significant GO biological process which is colored according to the -log10(p.adjust). |
| Page: 1 2 3 4 5 6 7 8 9 |
| GO ID | Tissue | Disease Stage | Description | Gene Ratio | Bg Ratio | pvalue | p.adjust | Count |
| Page: 1 |
| Pathway ID | Tissue | Disease Stage | Description | Gene Ratio | Bg Ratio | pvalue | p.adjust | qvalue | Count |
| Page: 1 |
Top |
Cell-cell communication analysis |
| Identification of potential cell-cell interactions between two cell types and their ligand-receptor pairs for different disease states |
| Ligand | Receptor | LRpair | Pathway | Tissue | Disease Stage |
| Page: 1 |
Top |
Single-cell gene regulatory network inference analysis |
| Find out the significant the regulons (TFs) and the target genes of each regulon across cell types for different disease states |
| TF | Cell Type | Tissue | Disease Stage | Target Gene | RSS | Regulon Activity |
| ∗The dot plots of a searched regulon are shown for all cell subpopulations in each disease state of each tissue based on the regulon specific score inferred using pySCENIC and by calculating the average expression. |
| Page: 1 |
Top |
Somatic mutation of malignant transformation related genes |
| Annotation of somatic variants for genes involved in malignant transformation |
| Hugo Symbol | Variant Class | Variant Classification | dbSNP RS | HGVSc | HGVSp | HGVSp Short | SWISSPROT | BIOTYPE | SIFT | PolyPhen | Tumor Sample Barcode | Tissue | Histology | Sex | Age | Stage | Therapy Types | Drugs | Outcome |
| PCP4L1 | SNV | Missense_Mutation | rs767831354 | c.173N>A | p.Arg58Gln | p.R58Q | A6NKN8 | protein_coding | deleterious(0.01) | probably_damaging(0.986) | TCGA-AJ-A3EL-01 | Endometrium | uterine corpus endometrioid carcinoma | Female | <65 | I/II | Unknown | Unknown | SD |
| PCP4L1 | SNV | Missense_Mutation | rs765798750 | c.43G>A | p.Ala15Thr | p.A15T | A6NKN8 | protein_coding | tolerated(0.22) | probably_damaging(0.981) | TCGA-FI-A2D5-01 | Endometrium | uterine corpus endometrioid carcinoma | Female | <65 | III/IV | Chemotherapy | carboplatinum | PD |
| PCP4L1 | SNV | Missense_Mutation | novel | c.124G>T | p.Ala42Ser | p.A42S | A6NKN8 | protein_coding | deleterious(0.01) | probably_damaging(0.99) | TCGA-FI-A2D5-01 | Endometrium | uterine corpus endometrioid carcinoma | Female | <65 | III/IV | Chemotherapy | carboplatinum | PD |
| PCP4L1 | insertion | Frame_Shift_Ins | novel | c.186_187insA | p.Asp65GlyfsTer59 | p.D65Gfs*59 | A6NKN8 | protein_coding | TCGA-A5-A0G2-01 | Endometrium | uterine corpus endometrioid carcinoma | Female | <65 | III/IV | Unknown | Unknown | SD | ||
| PCP4L1 | insertion | Frame_Shift_Ins | novel | c.58_59insA | p.Gly22ArgfsTer16 | p.G22Rfs*16 | A6NKN8 | protein_coding | TCGA-B5-A3FA-01 | Endometrium | uterine corpus endometrioid carcinoma | Female | >=65 | I/II | Unknown | Unknown | SD | ||
| PCP4L1 | SNV | Missense_Mutation | novel | c.193G>T | p.Asp65Tyr | p.D65Y | A6NKN8 | protein_coding | deleterious(0) | possibly_damaging(0.739) | TCGA-D7-A6EX-01 | Stomach | stomach adenocarcinoma | Female | >=65 | III/IV | Unknown | Unknown | SD |
| PCP4L1 | deletion | Frame_Shift_Del | novel | c.66delN | p.Ala24LeufsTer17 | p.A24Lfs*17 | A6NKN8 | protein_coding | TCGA-D7-A4YY-01 | Stomach | stomach adenocarcinoma | Male | <65 | III/IV | Chemotherapy | 5-fluorouracil | SD |
| Page: 1 |
Top |
Related drugs of malignant transformation related genes |
| Identification of chemicals and drugs interact with genes involved in malignant transfromation |
| (DGIdb 4.0) |
| Entrez ID | Symbol | Category | Interaction Types | Drug Claim Name | Drug Name | PMIDs |
| Page: 1 |

Copyright 2023-Present -The University of Texas Health Science Center at Houston |