
|
|||||
|
 | |
| |
| |
| |
| |
| |
|
Gene: PCOLCE |
Gene summary for PCOLCE |
| Gene information | Species | Human | Gene symbol | PCOLCE | Gene ID | 5118 |
| Gene name | procollagen C-endopeptidase enhancer | |
| Gene Alias | PCPE | |
| Cytomap | 7q22.1 | |
| Gene Type | protein-coding | GO ID | GO:0006508 | UniProtAcc | Q15113 |
Top |
Malignant transformation analysis |
| Identification of the aberrant gene expression in precancerous and cancerous lesions by comparing the gene expression of stem-like cells in diseased tissues with normal stem cells |
| Entrez ID | Symbol | Replicates | Species | Organ | Tissue | Adj P-value | Log2FC | Malignancy |
| 5118 | PCOLCE | AEH-subject1 | Human | Endometrium | AEH | 3.55e-42 | -9.55e-01 | -0.3059 |
| 5118 | PCOLCE | AEH-subject2 | Human | Endometrium | AEH | 4.25e-43 | -9.34e-01 | -0.2525 |
| 5118 | PCOLCE | AEH-subject3 | Human | Endometrium | AEH | 1.46e-39 | -9.17e-01 | -0.2576 |
| 5118 | PCOLCE | AEH-subject4 | Human | Endometrium | AEH | 3.28e-24 | -8.09e-01 | -0.2657 |
| 5118 | PCOLCE | AEH-subject5 | Human | Endometrium | AEH | 1.40e-45 | -9.72e-01 | -0.2953 |
| 5118 | PCOLCE | EEC-subject1 | Human | Endometrium | EEC | 4.28e-49 | -9.79e-01 | -0.2682 |
| 5118 | PCOLCE | EEC-subject2 | Human | Endometrium | EEC | 2.52e-56 | -1.01e+00 | -0.2607 |
| 5118 | PCOLCE | EEC-subject3 | Human | Endometrium | EEC | 8.54e-55 | -9.84e-01 | -0.2525 |
| 5118 | PCOLCE | EEC-subject4 | Human | Endometrium | EEC | 1.87e-40 | -9.27e-01 | -0.2571 |
| 5118 | PCOLCE | EEC-subject5 | Human | Endometrium | EEC | 3.06e-50 | -9.79e-01 | -0.249 |
| 5118 | PCOLCE | GSM5276935 | Human | Endometrium | EEC | 2.72e-46 | -9.72e-01 | -0.123 |
| 5118 | PCOLCE | GSM5276937 | Human | Endometrium | EEC | 6.56e-10 | -4.34e-01 | -0.0897 |
| 5118 | PCOLCE | GSM6177620_NYU_UCEC1_lib1_lib1 | Human | Endometrium | EEC | 4.05e-36 | -9.06e-01 | -0.1869 |
| 5118 | PCOLCE | GSM6177620_NYU_UCEC1_lib2_lib2 | Human | Endometrium | EEC | 2.74e-36 | -9.56e-01 | -0.1875 |
| 5118 | PCOLCE | GSM6177620_NYU_UCEC1_lib3_lib3 | Human | Endometrium | EEC | 8.15e-41 | -9.24e-01 | -0.1883 |
| 5118 | PCOLCE | GSM6177621_NYU_UCEC2_lib1_lib1 | Human | Endometrium | EEC | 2.50e-51 | -9.81e-01 | -0.1934 |
| 5118 | PCOLCE | GSM6177622_NYU_UCEC3_lib1_lib1 | Human | Endometrium | EEC | 1.29e-57 | -1.01e+00 | -0.1917 |
| 5118 | PCOLCE | GSM6177622_NYU_UCEC3_lib2_lib2 | Human | Endometrium | EEC | 3.38e-64 | -1.02e+00 | -0.1916 |
| 5118 | PCOLCE | GSM6177623_NYU_UCEC3_Vis | Human | Endometrium | EEC | 7.11e-17 | -6.94e-01 | -0.1269 |
| 5118 | PCOLCE | LZE24T | Human | Esophagus | ESCC | 8.59e-04 | 7.29e-02 | 0.0596 |
| Page: 1 2 3 4 |
| Tissue | Expression Dynamics | Abbreviation |
| Endometrium | 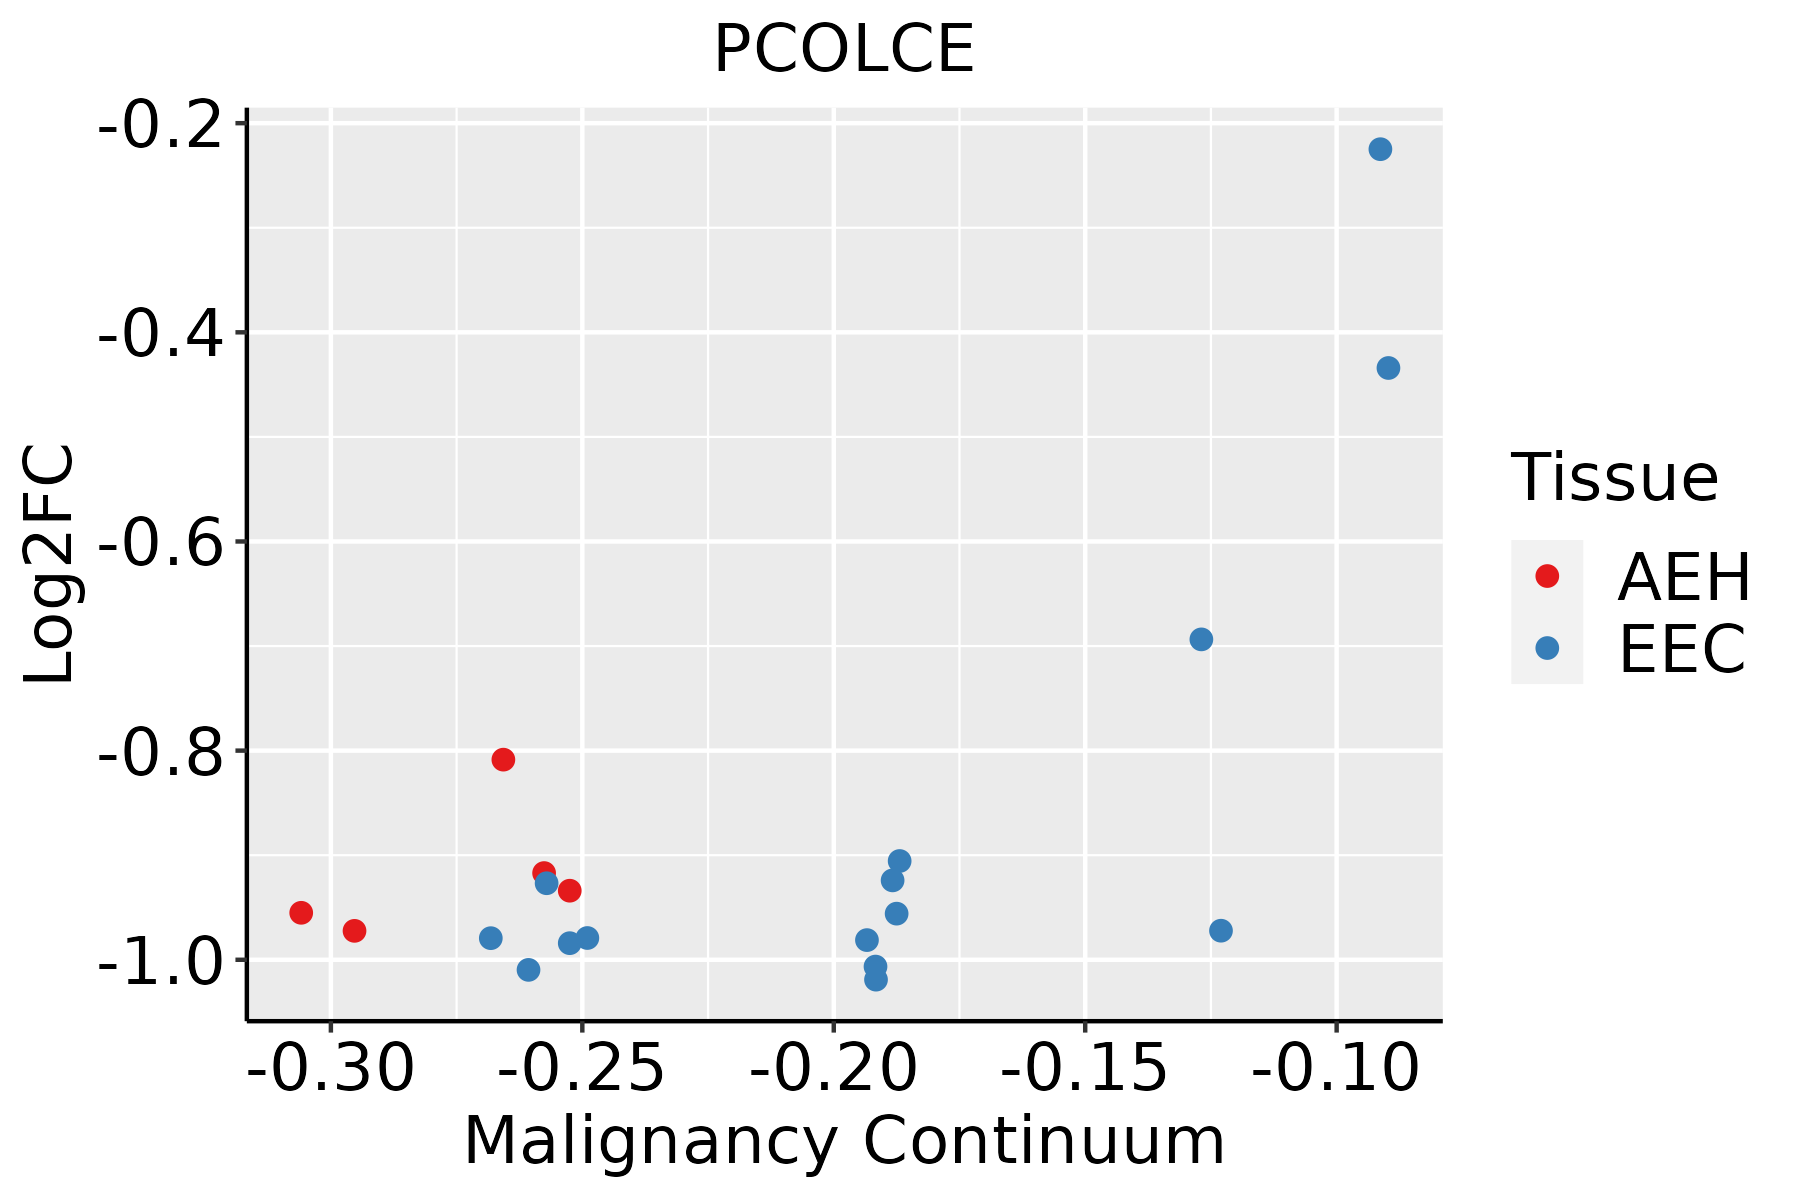 | AEH: Atypical endometrial hyperplasia |
| EEC: Endometrioid Cancer | ||
| Esophagus | 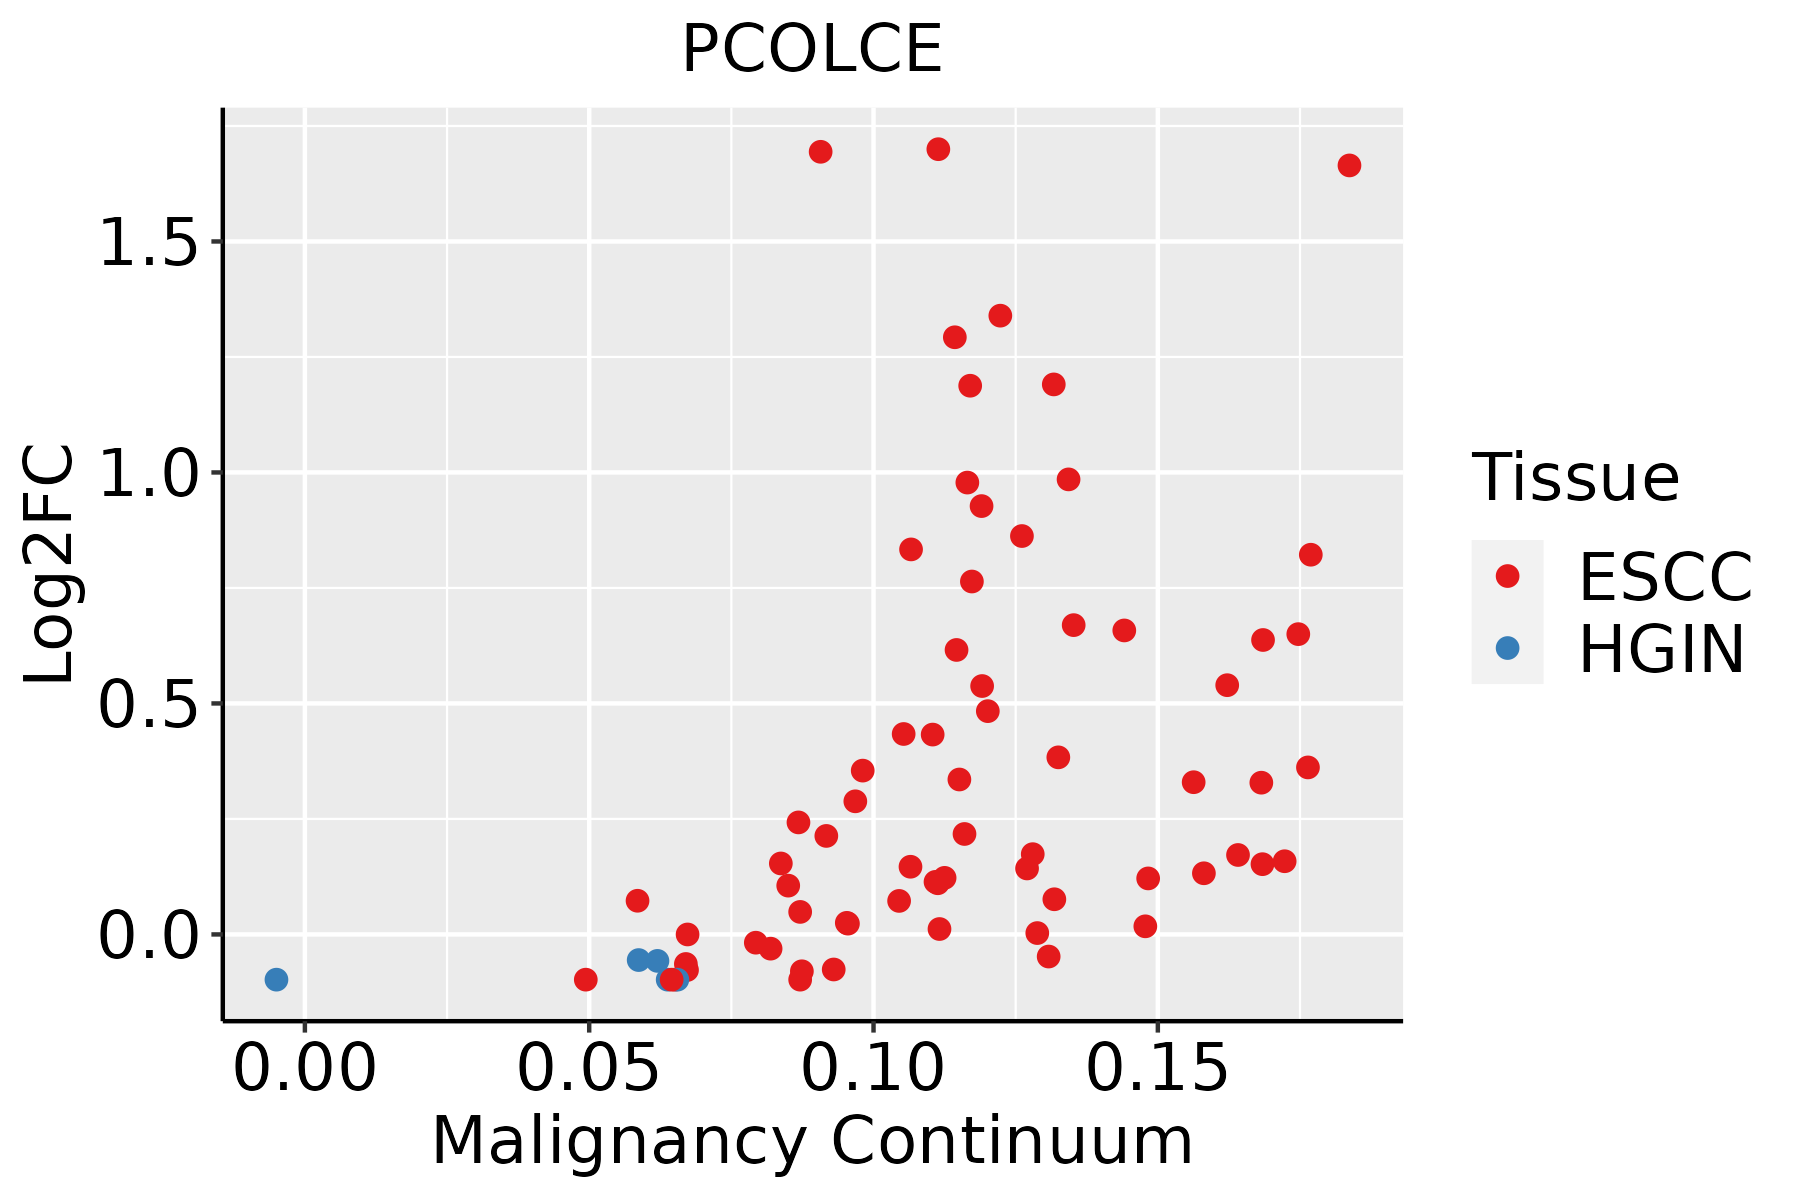 | ESCC: Esophageal squamous cell carcinoma |
| HGIN: High-grade intraepithelial neoplasias | ||
| LGIN: Low-grade intraepithelial neoplasias | ||
| Liver | 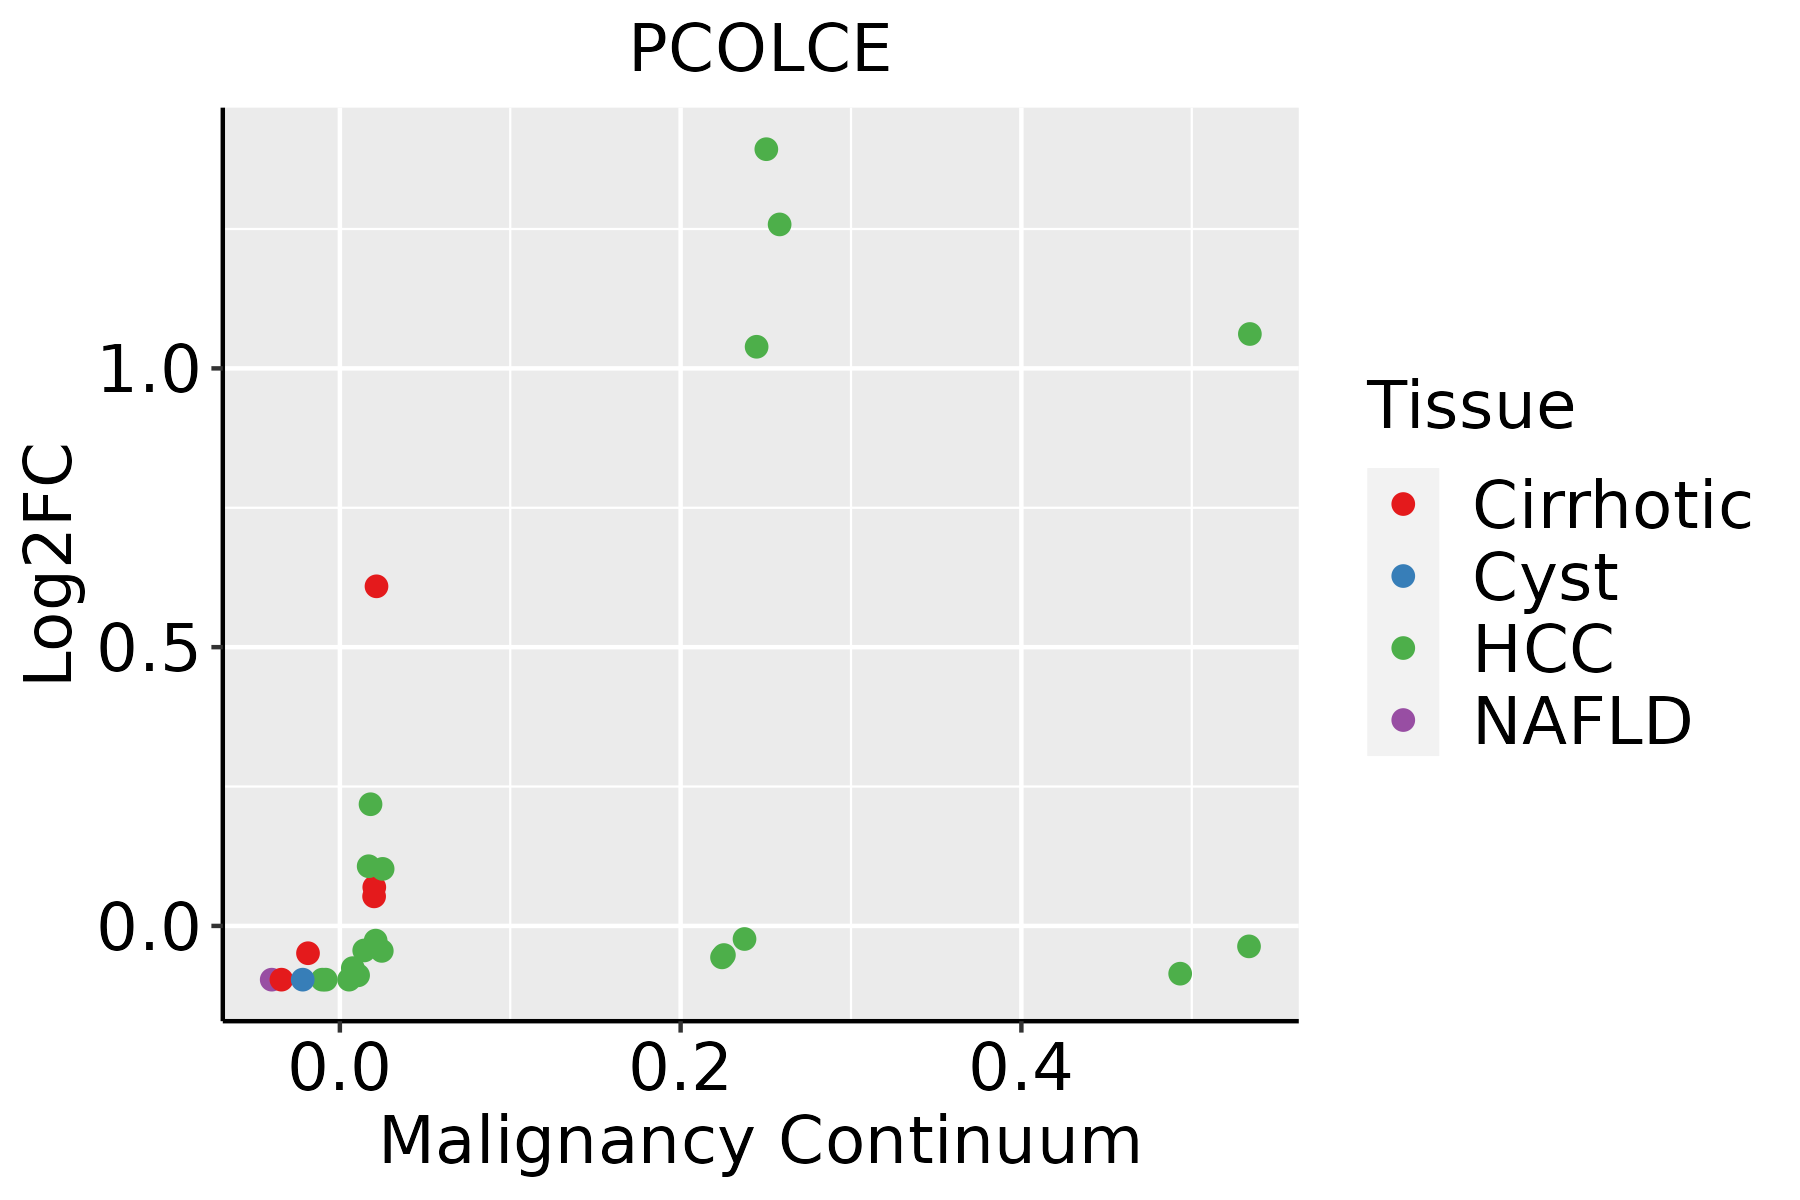 | HCC: Hepatocellular carcinoma |
| NAFLD: Non-alcoholic fatty liver disease | ||
| Skin |  | AK: Actinic keratosis |
| cSCC: Cutaneous squamous cell carcinoma | ||
| SCCIS:squamous cell carcinoma in situ | ||
| Thyroid | 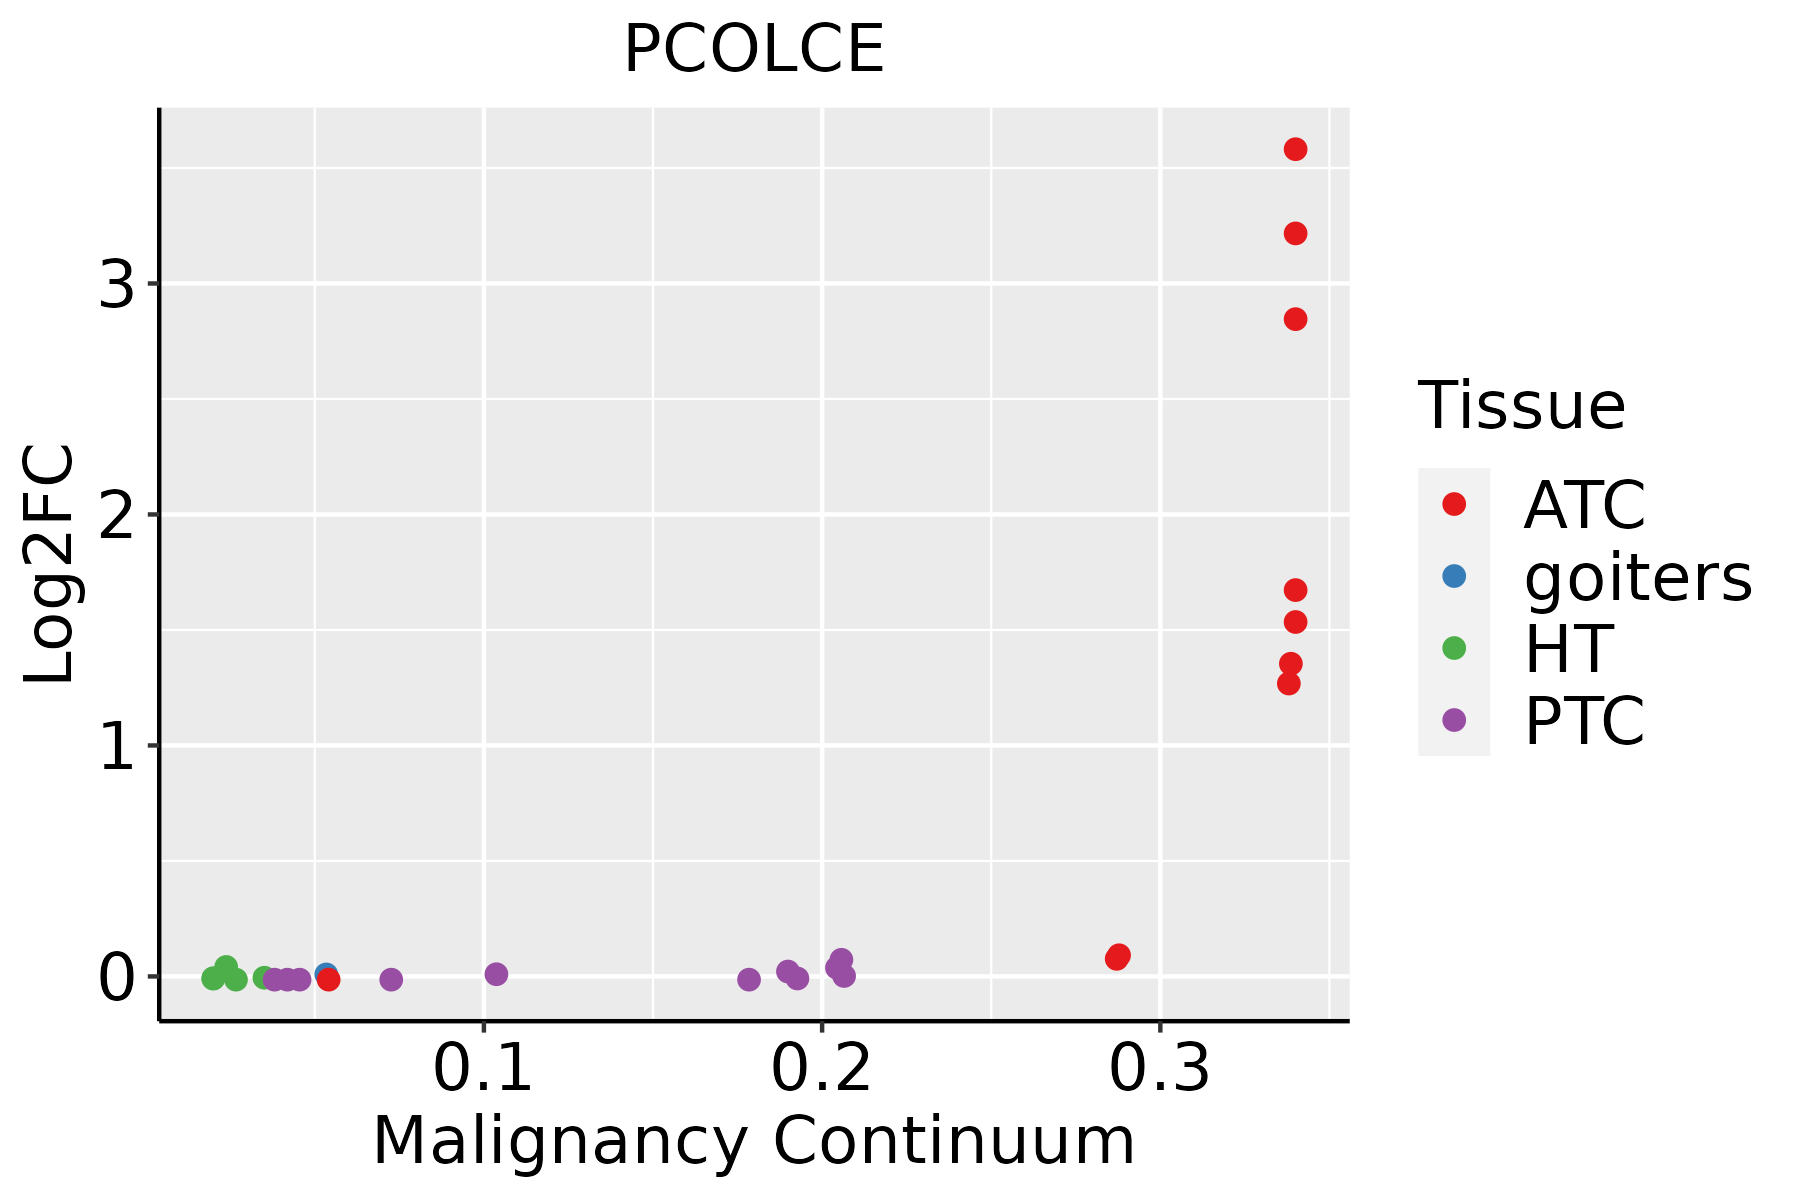 | ATC: Anaplastic thyroid cancer |
| HT: Hashimoto's thyroiditis | ||
| PTC: Papillary thyroid cancer |
| ∗log2FC in expression of this searched gene in stem-like cells from each diseased tissue sample relative to stem-like cells in normal samples in each tissue plotted against the malignancy continuum. Samples are colored based on if they are from different disease stage. |
Top |
Malignant transformation related pathway analysis |
| Find out the enriched GO biological processes and KEGG pathways involved in transition from healthy to precancer to cancer |
| Tissue | Disease Stage | Enriched GO biological Processes |
| Colorectum | AD |  |
| Colorectum | SER |  |
| Colorectum | MSS |  |
| Colorectum | MSI-H |  |
| Colorectum | FAP |  |
| ∗Top 15 enriched GO BP terms are showed in the bar plot of each disease state in each tissue. Each row represents a significant GO biological process which is colored according to the -log10(p.adjust). |
| Page: 1 2 3 4 5 6 7 8 9 |
| GO ID | Tissue | Disease Stage | Description | Gene Ratio | Bg Ratio | pvalue | p.adjust | Count |
| GO:004586216 | Endometrium | AEH | positive regulation of proteolysis | 81/2100 | 372/18723 | 2.72e-09 | 2.06e-07 | 81 |
| GO:005254716 | Endometrium | AEH | regulation of peptidase activity | 85/2100 | 461/18723 | 2.47e-06 | 7.11e-05 | 85 |
| GO:001095216 | Endometrium | AEH | positive regulation of peptidase activity | 44/2100 | 197/18723 | 5.53e-06 | 1.38e-04 | 44 |
| GO:004586217 | Endometrium | EEC | positive regulation of proteolysis | 83/2168 | 372/18723 | 2.32e-09 | 1.86e-07 | 83 |
| GO:005254717 | Endometrium | EEC | regulation of peptidase activity | 91/2168 | 461/18723 | 2.00e-07 | 8.93e-06 | 91 |
| GO:001095217 | Endometrium | EEC | positive regulation of peptidase activity | 44/2168 | 197/18723 | 1.25e-05 | 2.54e-04 | 44 |
| GO:0045862111 | Esophagus | ESCC | positive regulation of proteolysis | 256/8552 | 372/18723 | 7.88e-20 | 9.43e-18 | 256 |
| GO:0010952111 | Esophagus | ESCC | positive regulation of peptidase activity | 133/8552 | 197/18723 | 4.31e-10 | 1.14e-08 | 133 |
| GO:0052547111 | Esophagus | ESCC | regulation of peptidase activity | 275/8552 | 461/18723 | 7.54e-10 | 1.88e-08 | 275 |
| GO:004586212 | Liver | Cirrhotic | positive regulation of proteolysis | 163/4634 | 372/18723 | 4.18e-16 | 5.14e-14 | 163 |
| GO:005254712 | Liver | Cirrhotic | regulation of peptidase activity | 185/4634 | 461/18723 | 1.32e-13 | 1.09e-11 | 185 |
| GO:00109527 | Liver | Cirrhotic | positive regulation of peptidase activity | 81/4634 | 197/18723 | 2.89e-07 | 7.03e-06 | 81 |
| GO:004586222 | Liver | HCC | positive regulation of proteolysis | 232/7958 | 372/18723 | 5.66e-15 | 3.98e-13 | 232 |
| GO:005254722 | Liver | HCC | regulation of peptidase activity | 247/7958 | 461/18723 | 8.28e-07 | 1.27e-05 | 247 |
| GO:001095212 | Liver | HCC | positive regulation of peptidase activity | 110/7958 | 197/18723 | 1.04e-04 | 8.98e-04 | 110 |
| GO:005254727 | Skin | AK | regulation of peptidase activity | 88/1910 | 461/18723 | 4.65e-09 | 3.44e-07 | 88 |
| GO:004586228 | Skin | AK | positive regulation of proteolysis | 74/1910 | 372/18723 | 1.32e-08 | 8.20e-07 | 74 |
| GO:001095226 | Skin | AK | positive regulation of peptidase activity | 39/1910 | 197/18723 | 3.82e-05 | 6.31e-04 | 39 |
| GO:0045862112 | Skin | SCCIS | positive regulation of proteolysis | 43/919 | 372/18723 | 1.69e-07 | 1.91e-05 | 43 |
| GO:0052547112 | Skin | SCCIS | regulation of peptidase activity | 46/919 | 461/18723 | 4.09e-06 | 1.82e-04 | 46 |
| Page: 1 2 |
| Pathway ID | Tissue | Disease Stage | Description | Gene Ratio | Bg Ratio | pvalue | p.adjust | qvalue | Count |
| Page: 1 |
Top |
Cell-cell communication analysis |
| Identification of potential cell-cell interactions between two cell types and their ligand-receptor pairs for different disease states |
| Ligand | Receptor | LRpair | Pathway | Tissue | Disease Stage |
| Page: 1 |
Top |
Single-cell gene regulatory network inference analysis |
| Find out the significant the regulons (TFs) and the target genes of each regulon across cell types for different disease states |
| TF | Cell Type | Tissue | Disease Stage | Target Gene | RSS | Regulon Activity |
| ∗The dot plots of a searched regulon are shown for all cell subpopulations in each disease state of each tissue based on the regulon specific score inferred using pySCENIC and by calculating the average expression. |
| Page: 1 |
Top |
Somatic mutation of malignant transformation related genes |
| Annotation of somatic variants for genes involved in malignant transformation |
| Hugo Symbol | Variant Class | Variant Classification | dbSNP RS | HGVSc | HGVSp | HGVSp Short | SWISSPROT | BIOTYPE | SIFT | PolyPhen | Tumor Sample Barcode | Tissue | Histology | Sex | Age | Stage | Therapy Types | Drugs | Outcome |
| PCOLCE | SNV | Missense_Mutation | novel | c.126N>T | p.Lys42Asn | p.K42N | Q15113 | protein_coding | deleterious(0.05) | benign(0.001) | TCGA-A7-A0DB-01 | Breast | breast invasive carcinoma | Female | <65 | I/II | Hormone Therapy | arimidex | SD |
| PCOLCE | SNV | Missense_Mutation | c.211N>A | p.Glu71Lys | p.E71K | Q15113 | protein_coding | tolerated(0.08) | benign(0.036) | TCGA-Q1-A73P-01 | Cervix | cervical & endocervical cancer | Female | <65 | I/II | Unknown | Unknown | SD | |
| PCOLCE | SNV | Missense_Mutation | novel | c.113N>C | p.Gly38Ala | p.G38A | Q15113 | protein_coding | deleterious(0) | probably_damaging(1) | TCGA-VS-A953-01 | Cervix | cervical & endocervical cancer | Female | <65 | I/II | Unknown | Unknown | PD |
| PCOLCE | SNV | Missense_Mutation | c.112N>A | p.Gly38Arg | p.G38R | Q15113 | protein_coding | deleterious(0) | probably_damaging(1) | TCGA-AZ-6607-01 | Colorectum | colon adenocarcinoma | Male | >=65 | III/IV | Unknown | Unknown | PD | |
| PCOLCE | SNV | Missense_Mutation | rs780465700 | c.346N>T | p.Arg116Trp | p.R116W | Q15113 | protein_coding | deleterious(0) | probably_damaging(0.995) | TCGA-CK-4951-01 | Colorectum | colon adenocarcinoma | Female | >=65 | I/II | Unknown | Unknown | PD |
| PCOLCE | SNV | Missense_Mutation | rs200657795 | c.1231N>A | p.Val411Ile | p.V411I | Q15113 | protein_coding | tolerated(0.85) | benign(0.003) | TCGA-D5-6530-01 | Colorectum | colon adenocarcinoma | Male | <65 | I/II | Unknown | Unknown | SD |
| PCOLCE | SNV | Missense_Mutation | c.115G>T | p.Gly39Trp | p.G39W | Q15113 | protein_coding | deleterious(0) | probably_damaging(1) | TCGA-G4-6588-01 | Colorectum | colon adenocarcinoma | Female | <65 | I/II | Unknown | Unknown | SD | |
| PCOLCE | deletion | Frame_Shift_Del | c.475delT | p.Cys159AlafsTer12 | p.C159Afs*12 | Q15113 | protein_coding | TCGA-AA-3947-01 | Colorectum | colon adenocarcinoma | Female | <65 | I/II | Unknown | Unknown | SD | |||
| PCOLCE | SNV | Missense_Mutation | novel | c.609G>T | p.Glu203Asp | p.E203D | Q15113 | protein_coding | tolerated(0.36) | benign(0.021) | TCGA-A5-A0G1-01 | Endometrium | uterine corpus endometrioid carcinoma | Female | >=65 | I/II | Unknown | Unknown | SD |
| PCOLCE | SNV | Missense_Mutation | novel | c.934G>T | p.Ala312Ser | p.A312S | Q15113 | protein_coding | tolerated(0.75) | benign(0) | TCGA-A5-A0G1-01 | Endometrium | uterine corpus endometrioid carcinoma | Female | >=65 | I/II | Unknown | Unknown | SD |
| Page: 1 2 3 4 5 |
Top |
Related drugs of malignant transformation related genes |
| Identification of chemicals and drugs interact with genes involved in malignant transfromation |
| (DGIdb 4.0) |
| Entrez ID | Symbol | Category | Interaction Types | Drug Claim Name | Drug Name | PMIDs |
| Page: 1 |

Copyright 2023-Present -The University of Texas Health Science Center at Houston |