
|
|||||
|
 | |
| |
| |
| |
| |
| |
|
Gene: PCNX2 |
Gene summary for PCNX2 |
| Gene information | Species | Human | Gene symbol | PCNX2 | Gene ID | 80003 |
| Gene name | pecanex 2 | |
| Gene Alias | PCNXL2 | |
| Cytomap | 1q42.2 | |
| Gene Type | protein-coding | GO ID | GO:0008150 | UniProtAcc | A6NKB5 |
Top |
Malignant transformation analysis |
| Identification of the aberrant gene expression in precancerous and cancerous lesions by comparing the gene expression of stem-like cells in diseased tissues with normal stem cells |
| Entrez ID | Symbol | Replicates | Species | Organ | Tissue | Adj P-value | Log2FC | Malignancy |
| 80003 | PCNX2 | HTA11_1938_2000001011 | Human | Colorectum | AD | 8.46e-04 | 4.62e-01 | -0.0811 |
| 80003 | PCNX2 | HTA11_1391_2000001011 | Human | Colorectum | AD | 2.50e-03 | 5.12e-01 | -0.059 |
| 80003 | PCNX2 | HTA11_7663_2000001011 | Human | Colorectum | SER | 5.84e-03 | 4.34e-01 | 0.0131 |
| 80003 | PCNX2 | HTA11_7696_3000711011 | Human | Colorectum | AD | 1.79e-02 | 1.91e-01 | 0.0674 |
| 80003 | PCNX2 | HTA11_6818_2000001021 | Human | Colorectum | AD | 6.20e-07 | 5.98e-01 | 0.0588 |
| 80003 | PCNX2 | HTA11_99999970781_79442 | Human | Colorectum | MSS | 1.49e-03 | 1.41e-01 | 0.294 |
| 80003 | PCNX2 | HTA11_99999965104_69814 | Human | Colorectum | MSS | 4.87e-04 | 4.02e-01 | 0.281 |
| 80003 | PCNX2 | HTA11_99999974143_84620 | Human | Colorectum | MSS | 3.63e-05 | 2.21e-01 | 0.3005 |
| 80003 | PCNX2 | A002-C-010 | Human | Colorectum | FAP | 1.27e-03 | 3.89e-01 | 0.242 |
| 80003 | PCNX2 | A001-C-108 | Human | Colorectum | FAP | 1.02e-02 | 3.94e-01 | -0.0272 |
| 80003 | PCNX2 | A002-C-021 | Human | Colorectum | FAP | 4.72e-16 | 5.28e-01 | 0.1171 |
| 80003 | PCNX2 | A001-C-104 | Human | Colorectum | FAP | 1.30e-03 | 4.47e-01 | 0.0184 |
| 80003 | PCNX2 | A015-C-202 | Human | Colorectum | FAP | 4.97e-02 | 3.09e-01 | -0.0849 |
| 80003 | PCNX2 | A015-C-002 | Human | Colorectum | FAP | 2.96e-02 | 3.98e-01 | -0.0763 |
| 80003 | PCNX2 | A008-E-015 | Human | Colorectum | FAP | 1.74e-07 | 3.94e-01 | 0.0177 |
| 80003 | PCNX2 | AEH-subject1 | Human | Endometrium | AEH | 2.66e-23 | 4.00e-01 | -0.3059 |
| 80003 | PCNX2 | AEH-subject2 | Human | Endometrium | AEH | 1.07e-12 | 3.01e-01 | -0.2525 |
| 80003 | PCNX2 | AEH-subject3 | Human | Endometrium | AEH | 2.44e-20 | 4.33e-01 | -0.2576 |
| 80003 | PCNX2 | AEH-subject4 | Human | Endometrium | AEH | 1.17e-16 | 4.06e-01 | -0.2657 |
| 80003 | PCNX2 | AEH-subject5 | Human | Endometrium | AEH | 1.69e-11 | 2.43e-01 | -0.2953 |
| Page: 1 2 3 |
| Tissue | Expression Dynamics | Abbreviation |
| Colorectum (GSE201348) | 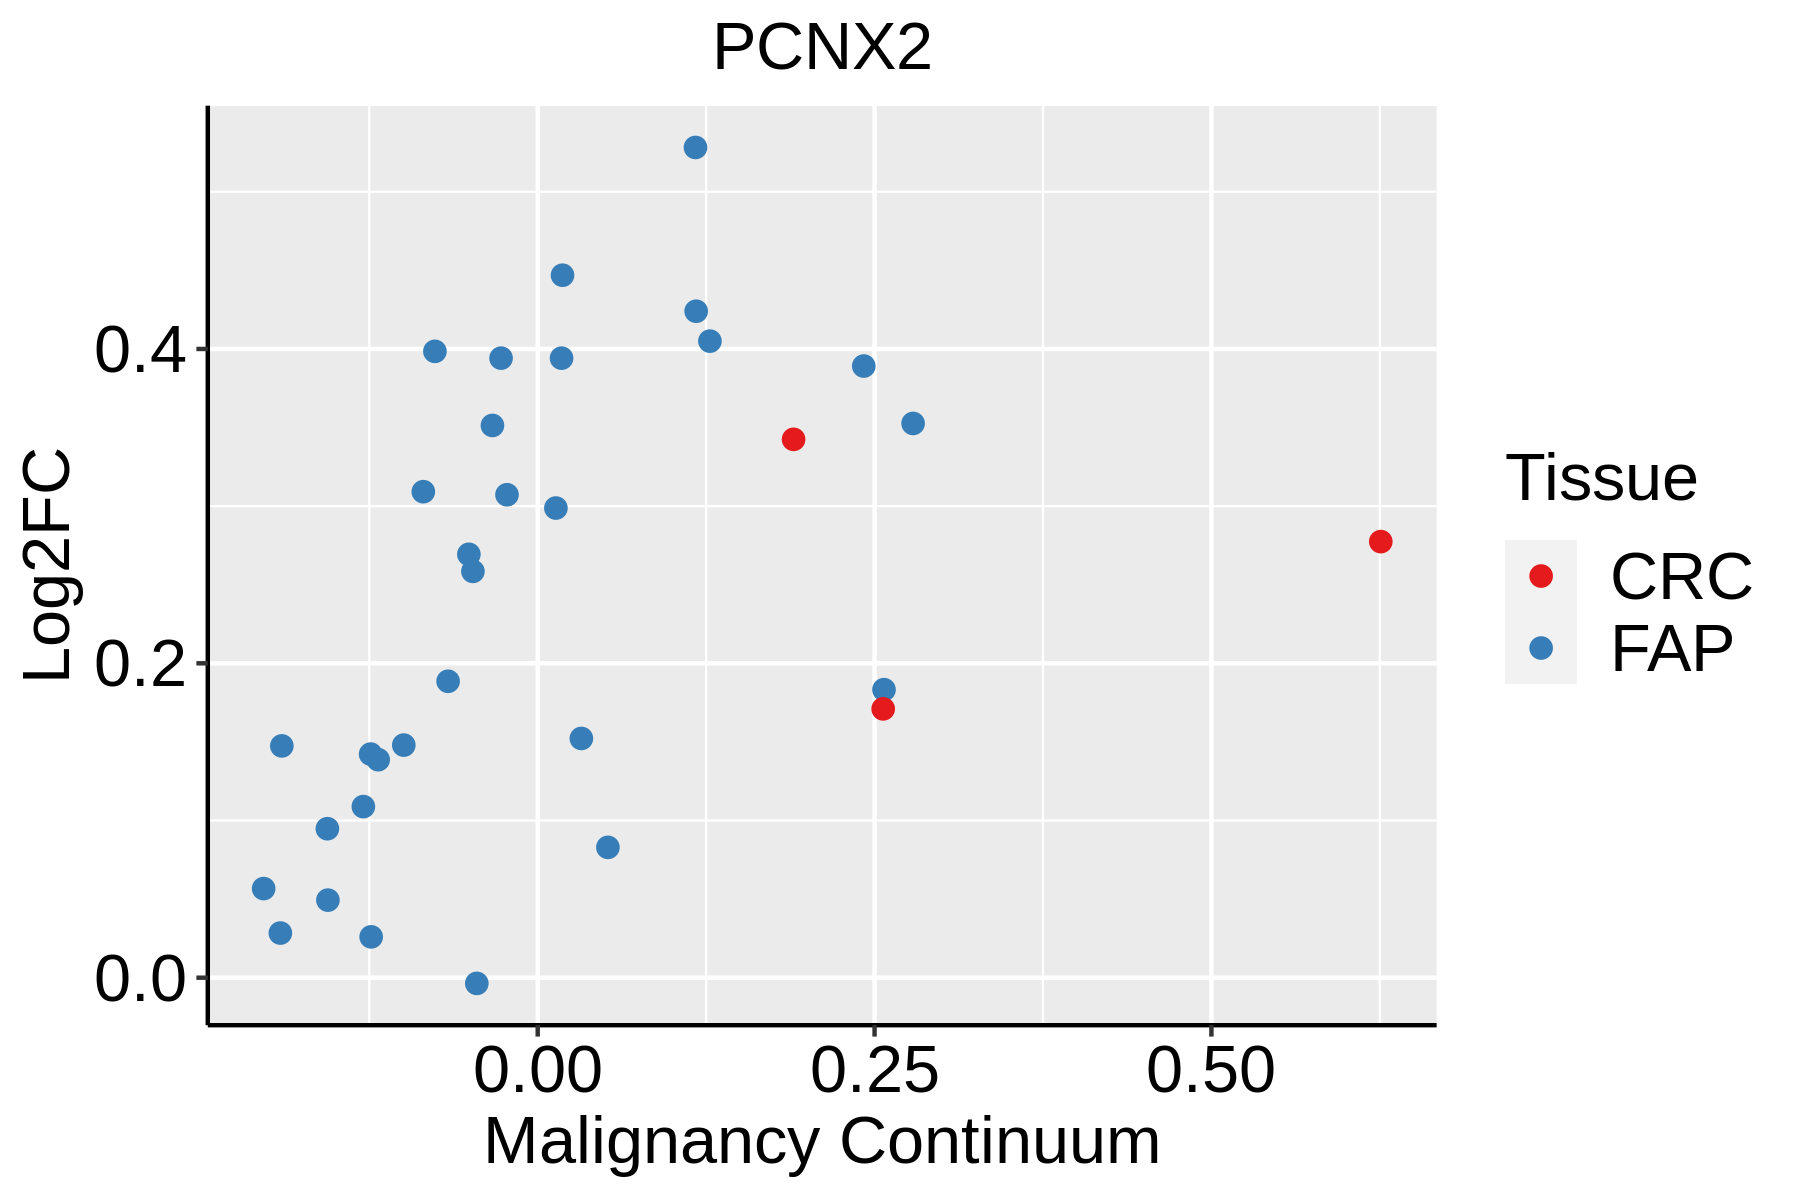 | FAP: Familial adenomatous polyposis |
| CRC: Colorectal cancer | ||
| Colorectum (HTA11) |  | AD: Adenomas |
| SER: Sessile serrated lesions | ||
| MSI-H: Microsatellite-high colorectal cancer | ||
| MSS: Microsatellite stable colorectal cancer | ||
| Endometrium | 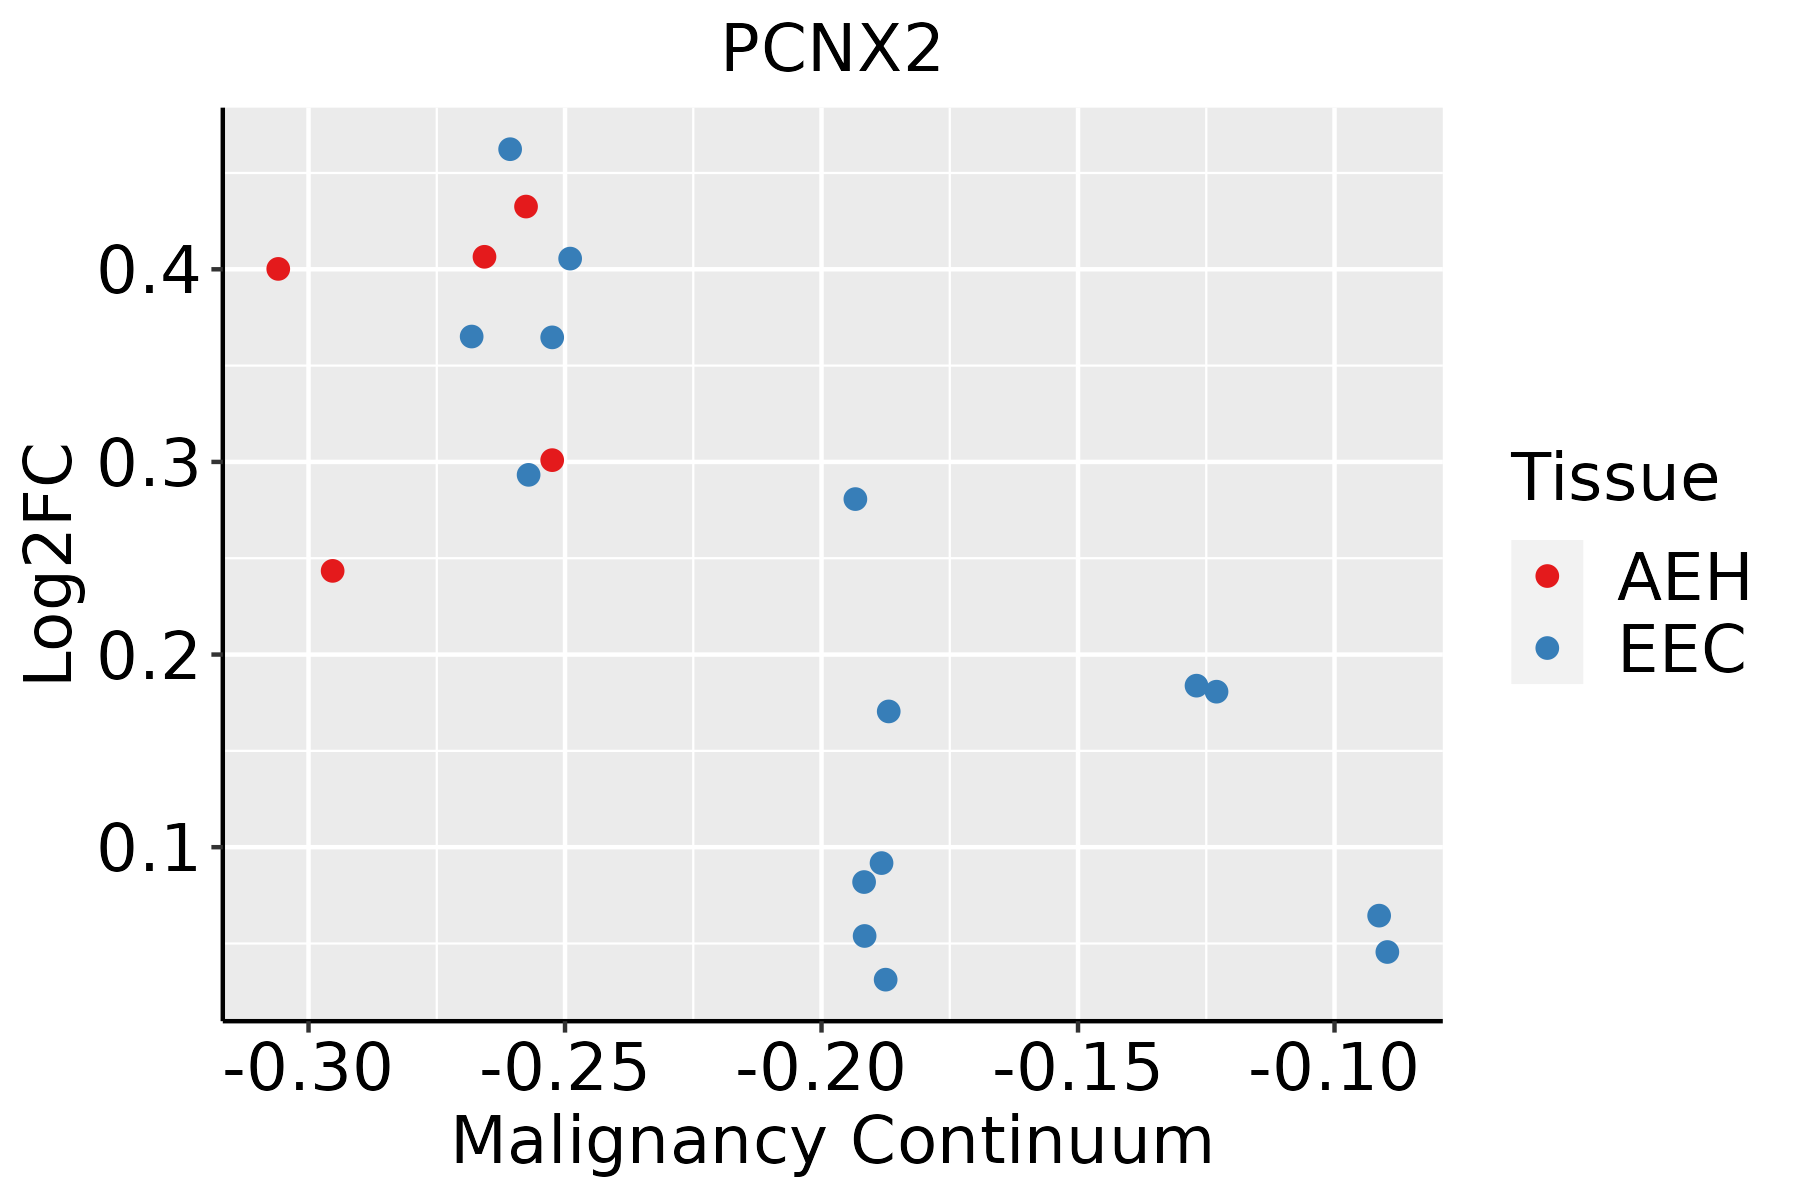 | AEH: Atypical endometrial hyperplasia |
| EEC: Endometrioid Cancer | ||
| Thyroid | 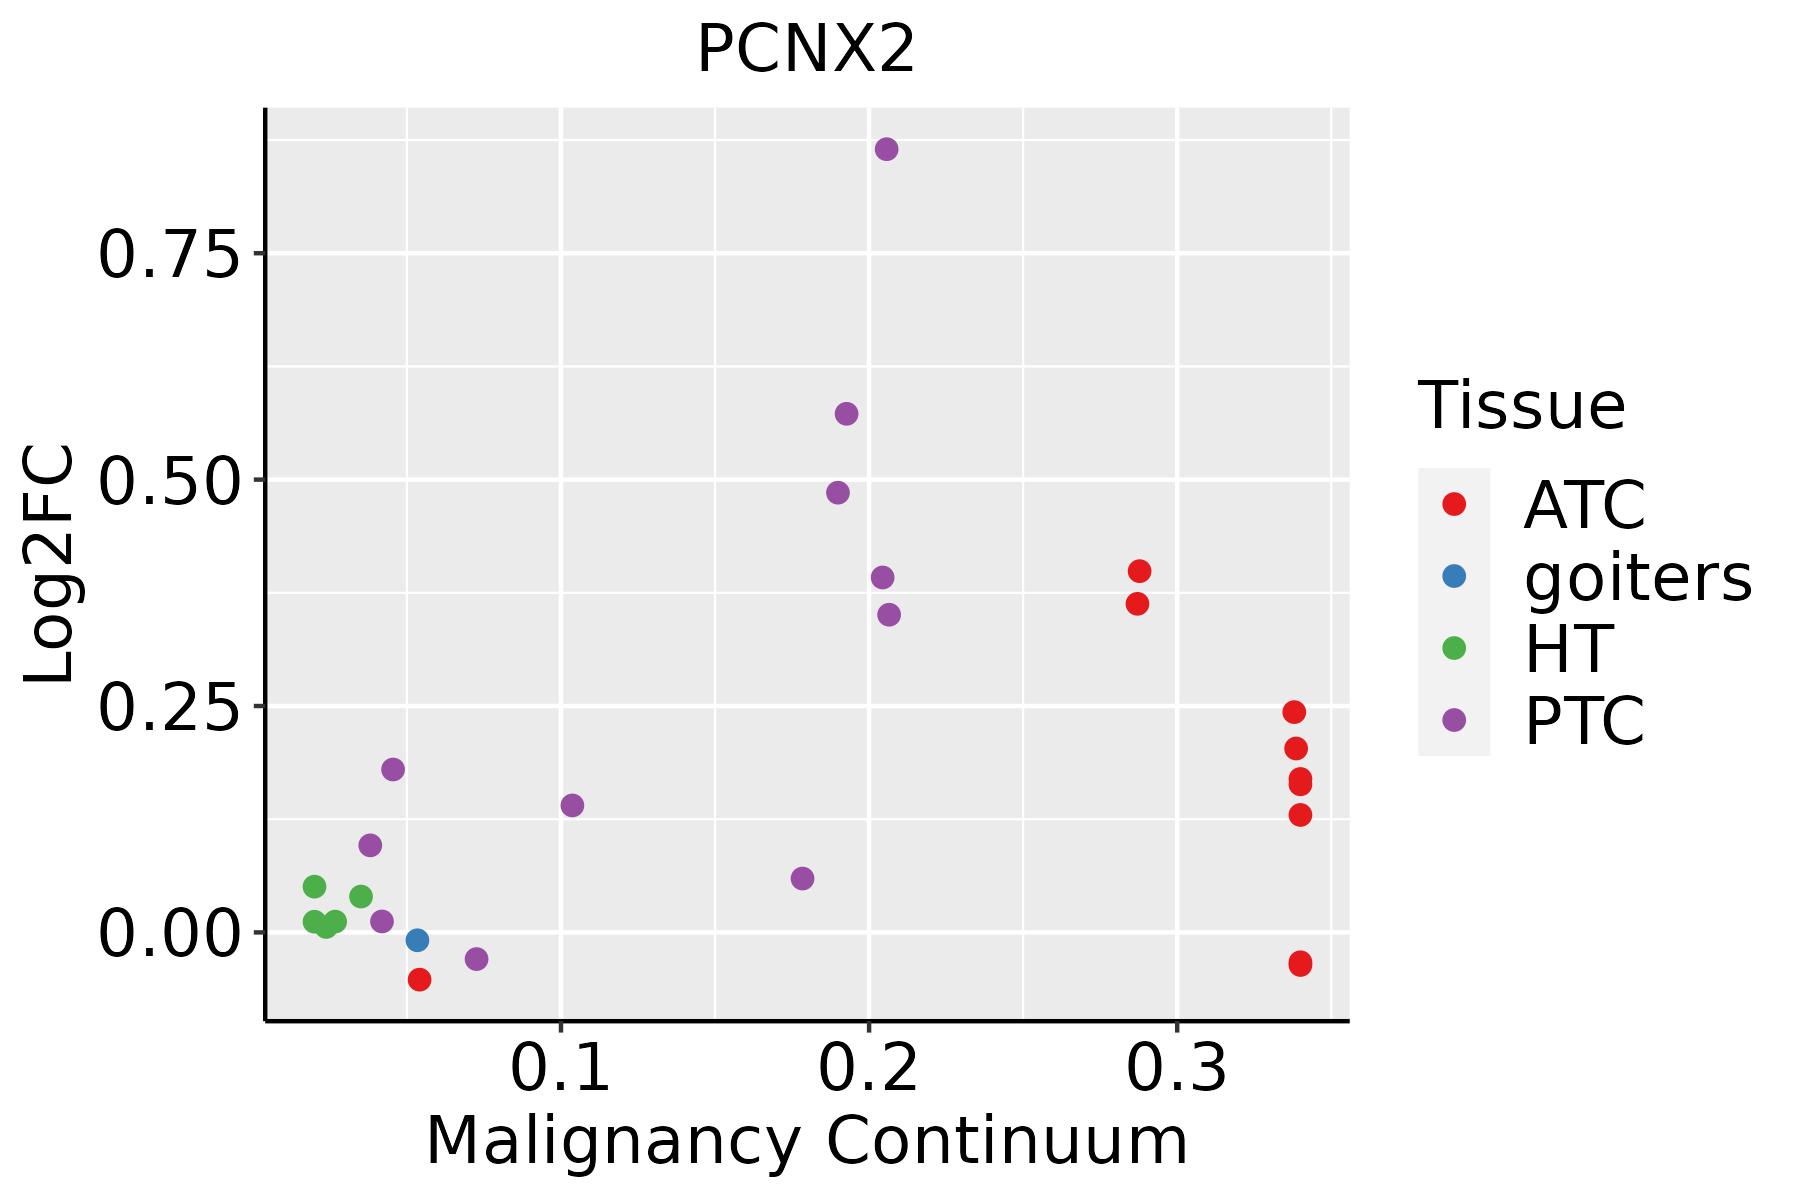 | ATC: Anaplastic thyroid cancer |
| HT: Hashimoto's thyroiditis | ||
| PTC: Papillary thyroid cancer |
| ∗log2FC in expression of this searched gene in stem-like cells from each diseased tissue sample relative to stem-like cells in normal samples in each tissue plotted against the malignancy continuum. Samples are colored based on if they are from different disease stage. |
Top |
Malignant transformation related pathway analysis |
| Find out the enriched GO biological processes and KEGG pathways involved in transition from healthy to precancer to cancer |
| Tissue | Disease Stage | Enriched GO biological Processes |
| Colorectum | AD |  |
| Colorectum | SER |  |
| Colorectum | MSS |  |
| Colorectum | MSI-H |  |
| Colorectum | FAP |  |
| ∗Top 15 enriched GO BP terms are showed in the bar plot of each disease state in each tissue. Each row represents a significant GO biological process which is colored according to the -log10(p.adjust). |
| Page: 1 2 3 4 5 6 7 8 9 |
| GO ID | Tissue | Disease Stage | Description | Gene Ratio | Bg Ratio | pvalue | p.adjust | Count |
| Page: 1 |
| Pathway ID | Tissue | Disease Stage | Description | Gene Ratio | Bg Ratio | pvalue | p.adjust | qvalue | Count |
| Page: 1 |
Top |
Cell-cell communication analysis |
| Identification of potential cell-cell interactions between two cell types and their ligand-receptor pairs for different disease states |
| Ligand | Receptor | LRpair | Pathway | Tissue | Disease Stage |
| Page: 1 |
Top |
Single-cell gene regulatory network inference analysis |
| Find out the significant the regulons (TFs) and the target genes of each regulon across cell types for different disease states |
| TF | Cell Type | Tissue | Disease Stage | Target Gene | RSS | Regulon Activity |
| ∗The dot plots of a searched regulon are shown for all cell subpopulations in each disease state of each tissue based on the regulon specific score inferred using pySCENIC and by calculating the average expression. |
| Page: 1 |
Top |
Somatic mutation of malignant transformation related genes |
| Annotation of somatic variants for genes involved in malignant transformation |
| Hugo Symbol | Variant Class | Variant Classification | dbSNP RS | HGVSc | HGVSp | HGVSp Short | SWISSPROT | BIOTYPE | SIFT | PolyPhen | Tumor Sample Barcode | Tissue | Histology | Sex | Age | Stage | Therapy Types | Drugs | Outcome |
| PCNX2 | SNV | Missense_Mutation | c.596C>G | p.Ala199Gly | p.A199G | A6NKB5 | protein_coding | tolerated_low_confidence(0.15) | possibly_damaging(0.549) | TCGA-A2-A0T0-01 | Breast | breast invasive carcinoma | Female | <65 | I/II | Chemotherapy | taxotere | SD | |
| PCNX2 | SNV | Missense_Mutation | novel | c.5154N>G | p.Ile1718Met | p.I1718M | A6NKB5 | protein_coding | deleterious(0.01) | probably_damaging(0.914) | TCGA-A2-A3Y0-01 | Breast | breast invasive carcinoma | Female | <65 | I/II | Chemotherapy | adriamycin | CR |
| PCNX2 | SNV | Missense_Mutation | novel | c.6311N>G | p.Glu2104Gly | p.E2104G | A6NKB5 | protein_coding | tolerated_low_confidence(0.18) | benign(0.054) | TCGA-A8-A09Q-01 | Breast | breast invasive carcinoma | Female | >=65 | III/IV | Hormone Therapy | anastrozole | SD |
| PCNX2 | SNV | Missense_Mutation | c.4389N>A | p.Met1463Ile | p.M1463I | A6NKB5 | protein_coding | deleterious(0) | benign(0.09) | TCGA-A8-A09Z-01 | Breast | breast invasive carcinoma | Female | >=65 | I/II | Unknown | Unknown | SD | |
| PCNX2 | SNV | Missense_Mutation | novel | c.2558C>G | p.Ser853Cys | p.S853C | A6NKB5 | protein_coding | deleterious(0) | probably_damaging(0.979) | TCGA-AC-A23H-01 | Breast | breast invasive carcinoma | Female | >=65 | I/II | Unknown | Unknown | PD |
| PCNX2 | SNV | Missense_Mutation | novel | c.5608C>T | p.Arg1870Trp | p.R1870W | A6NKB5 | protein_coding | deleterious(0) | probably_damaging(0.996) | TCGA-AN-A046-01 | Breast | breast invasive carcinoma | Female | >=65 | I/II | Unknown | Unknown | SD |
| PCNX2 | SNV | Missense_Mutation | rs745867353 | c.893N>A | p.Arg298Gln | p.R298Q | A6NKB5 | protein_coding | tolerated_low_confidence(1) | benign(0) | TCGA-AN-A0AK-01 | Breast | breast invasive carcinoma | Female | >=65 | I/II | Unknown | Unknown | SD |
| PCNX2 | SNV | Missense_Mutation | c.5552N>A | p.Gly1851Glu | p.G1851E | A6NKB5 | protein_coding | deleterious(0.02) | possibly_damaging(0.496) | TCGA-AO-A0J7-01 | Breast | breast invasive carcinoma | Female | >=65 | I/II | Chemotherapy | doxorubicin | SD | |
| PCNX2 | SNV | Missense_Mutation | rs372337688 | c.4396N>A | p.Asp1466Asn | p.D1466N | A6NKB5 | protein_coding | deleterious(0.04) | benign(0.125) | TCGA-B6-A0RG-01 | Breast | breast invasive carcinoma | Female | <65 | I/II | Unknown | Unknown | SD |
| PCNX2 | SNV | Missense_Mutation | c.460C>T | p.His154Tyr | p.H154Y | A6NKB5 | protein_coding | tolerated(0.05) | benign(0.091) | TCGA-BH-A0BG-01 | Breast | breast invasive carcinoma | Female | >=65 | I/II | Unknown | Unknown | SD |
| Page: 1 2 3 4 5 6 7 8 9 10 11 12 13 14 15 16 17 18 19 20 21 |
Top |
Related drugs of malignant transformation related genes |
| Identification of chemicals and drugs interact with genes involved in malignant transfromation |
| (DGIdb 4.0) |
| Entrez ID | Symbol | Category | Interaction Types | Drug Claim Name | Drug Name | PMIDs |
| Page: 1 |

Copyright 2023-Present -The University of Texas Health Science Center at Houston |