
|
|||||
|
 | |
| |
| |
| |
| |
| |
|
Gene: PCNX1 |
Gene summary for PCNX1 |
| Gene information | Species | Human | Gene symbol | PCNX1 | Gene ID | 22990 |
| Gene name | pecanex 1 | |
| Gene Alias | PCNX | |
| Cytomap | 14q24.2 | |
| Gene Type | protein-coding | GO ID | GO:0005575 | UniProtAcc | Q96RV3 |
Top |
Malignant transformation analysis |
| Identification of the aberrant gene expression in precancerous and cancerous lesions by comparing the gene expression of stem-like cells in diseased tissues with normal stem cells |
| Entrez ID | Symbol | Replicates | Species | Organ | Tissue | Adj P-value | Log2FC | Malignancy |
| 22990 | PCNX1 | CCI_2 | Human | Cervix | CC | 9.56e-03 | 5.89e-01 | 0.5249 |
| 22990 | PCNX1 | CCI_3 | Human | Cervix | CC | 2.90e-03 | 5.63e-01 | 0.516 |
| 22990 | PCNX1 | Tumor | Human | Cervix | CC | 4.20e-08 | -1.96e-01 | 0.1241 |
| 22990 | PCNX1 | L1 | Human | Cervix | CC | 2.03e-02 | -1.67e-01 | 0.0802 |
| 22990 | PCNX1 | AEH-subject1 | Human | Endometrium | AEH | 3.02e-19 | 3.92e-01 | -0.3059 |
| 22990 | PCNX1 | AEH-subject2 | Human | Endometrium | AEH | 2.67e-12 | 2.72e-01 | -0.2525 |
| 22990 | PCNX1 | AEH-subject3 | Human | Endometrium | AEH | 3.99e-06 | 1.91e-01 | -0.2576 |
| 22990 | PCNX1 | AEH-subject4 | Human | Endometrium | AEH | 1.74e-24 | 5.58e-01 | -0.2657 |
| 22990 | PCNX1 | AEH-subject5 | Human | Endometrium | AEH | 2.44e-20 | 4.09e-01 | -0.2953 |
| 22990 | PCNX1 | EEC-subject1 | Human | Endometrium | EEC | 1.31e-19 | 3.81e-01 | -0.2682 |
| 22990 | PCNX1 | EEC-subject2 | Human | Endometrium | EEC | 8.15e-11 | 3.18e-01 | -0.2607 |
| 22990 | PCNX1 | EEC-subject3 | Human | Endometrium | EEC | 1.89e-07 | 2.58e-01 | -0.2525 |
| 22990 | PCNX1 | EEC-subject4 | Human | Endometrium | EEC | 1.14e-15 | 3.50e-01 | -0.2571 |
| 22990 | PCNX1 | EEC-subject5 | Human | Endometrium | EEC | 5.07e-16 | 3.55e-01 | -0.249 |
| 22990 | PCNX1 | GSM5276935 | Human | Endometrium | EEC | 3.71e-04 | 1.02e-01 | -0.123 |
| 22990 | PCNX1 | GSM5276937 | Human | Endometrium | EEC | 5.05e-07 | 1.54e-01 | -0.0897 |
| 22990 | PCNX1 | GSM6177621_NYU_UCEC2_lib1_lib1 | Human | Endometrium | EEC | 7.85e-04 | 1.82e-01 | -0.1934 |
| 22990 | PCNX1 | GSM6177623_NYU_UCEC3_Vis | Human | Endometrium | EEC | 1.88e-08 | 2.42e-01 | -0.1269 |
| 22990 | PCNX1 | NAFLD1 | Human | Liver | NAFLD | 1.05e-09 | 8.12e-01 | -0.04 |
| 22990 | PCNX1 | S41 | Human | Liver | Cirrhotic | 8.05e-04 | 5.26e-01 | -0.0343 |
| Page: 1 2 3 4 |
| Tissue | Expression Dynamics | Abbreviation |
| Cervix | 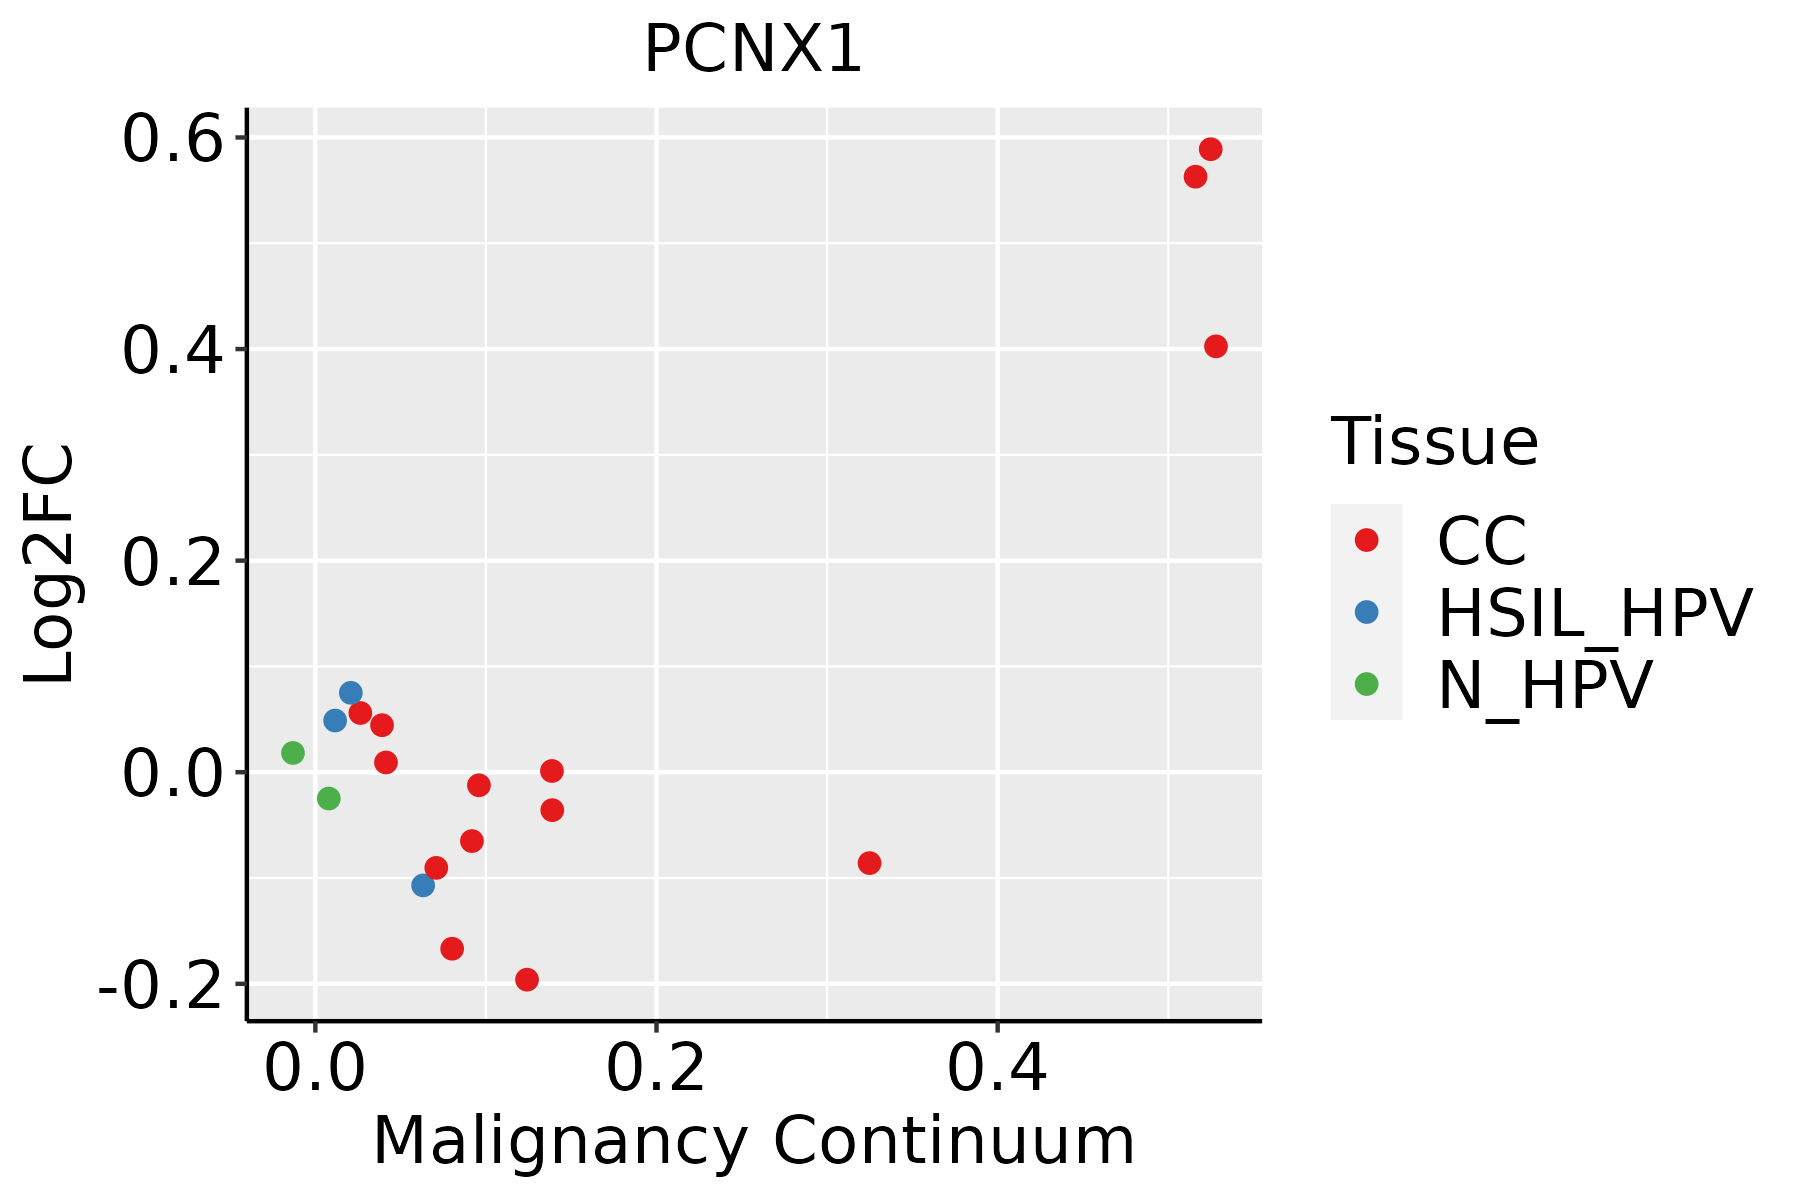 | CC: Cervix cancer |
| HSIL_HPV: HPV-infected high-grade squamous intraepithelial lesions | ||
| N_HPV: HPV-infected normal cervix | ||
| Endometrium |  | AEH: Atypical endometrial hyperplasia |
| EEC: Endometrioid Cancer | ||
| Liver | 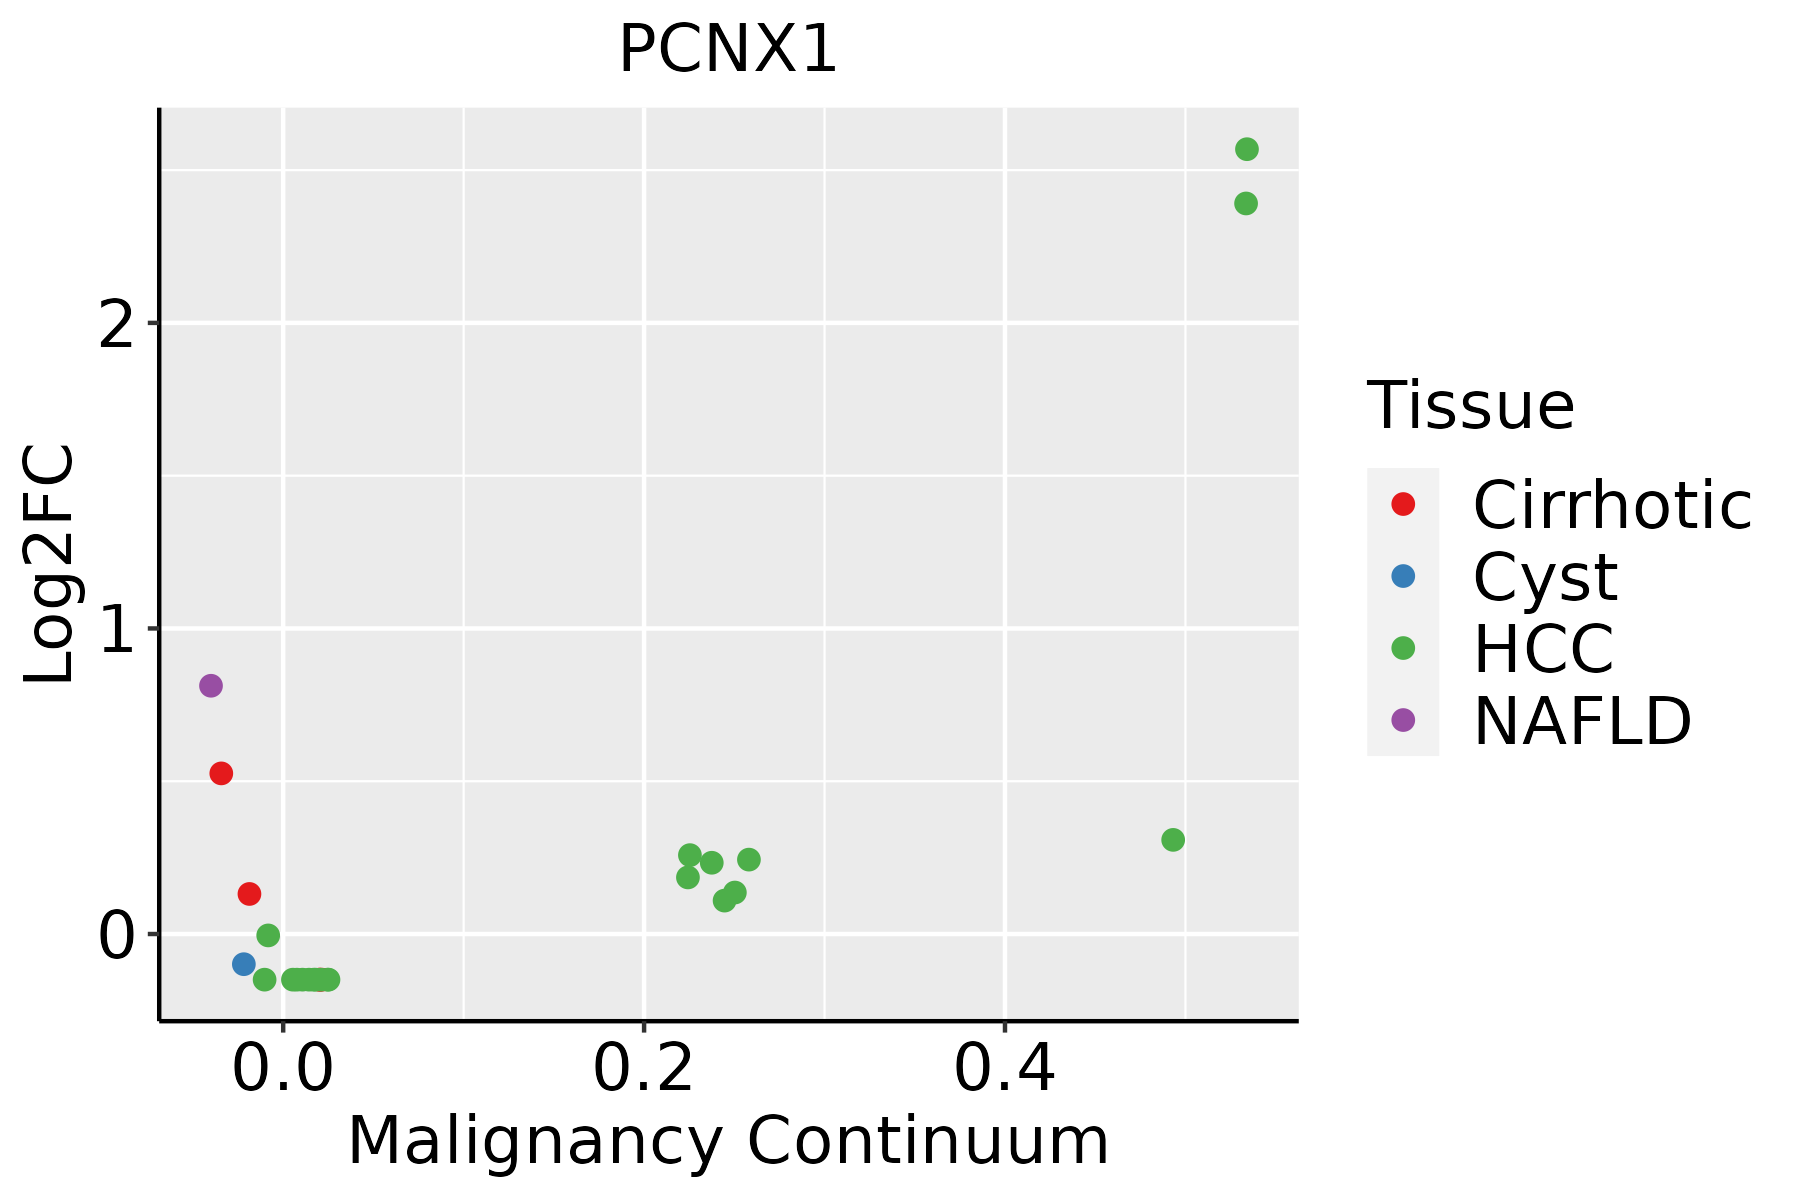 | HCC: Hepatocellular carcinoma |
| NAFLD: Non-alcoholic fatty liver disease | ||
| Lung | 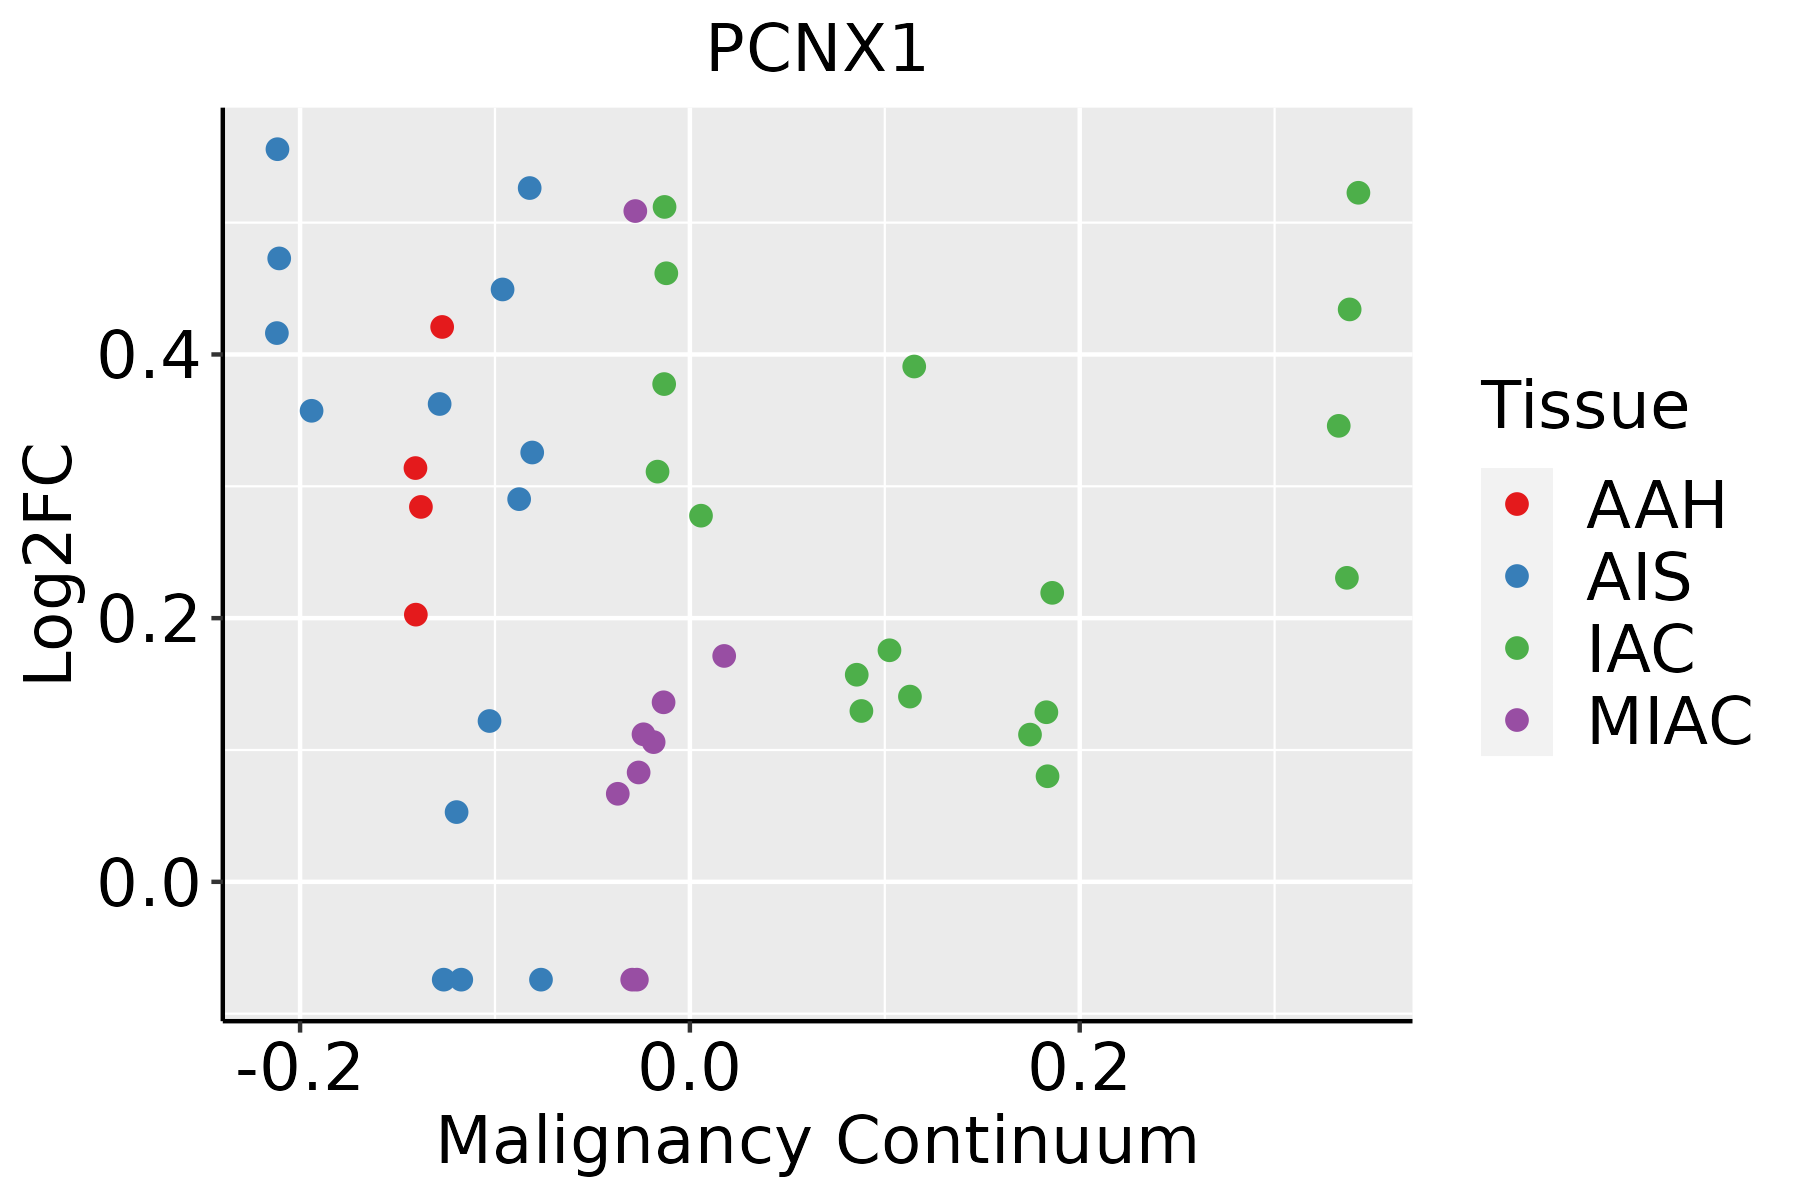 | AAH: Atypical adenomatous hyperplasia |
| AIS: Adenocarcinoma in situ | ||
| IAC: Invasive lung adenocarcinoma | ||
| MIA: Minimally invasive adenocarcinoma | ||
| Oral Cavity | 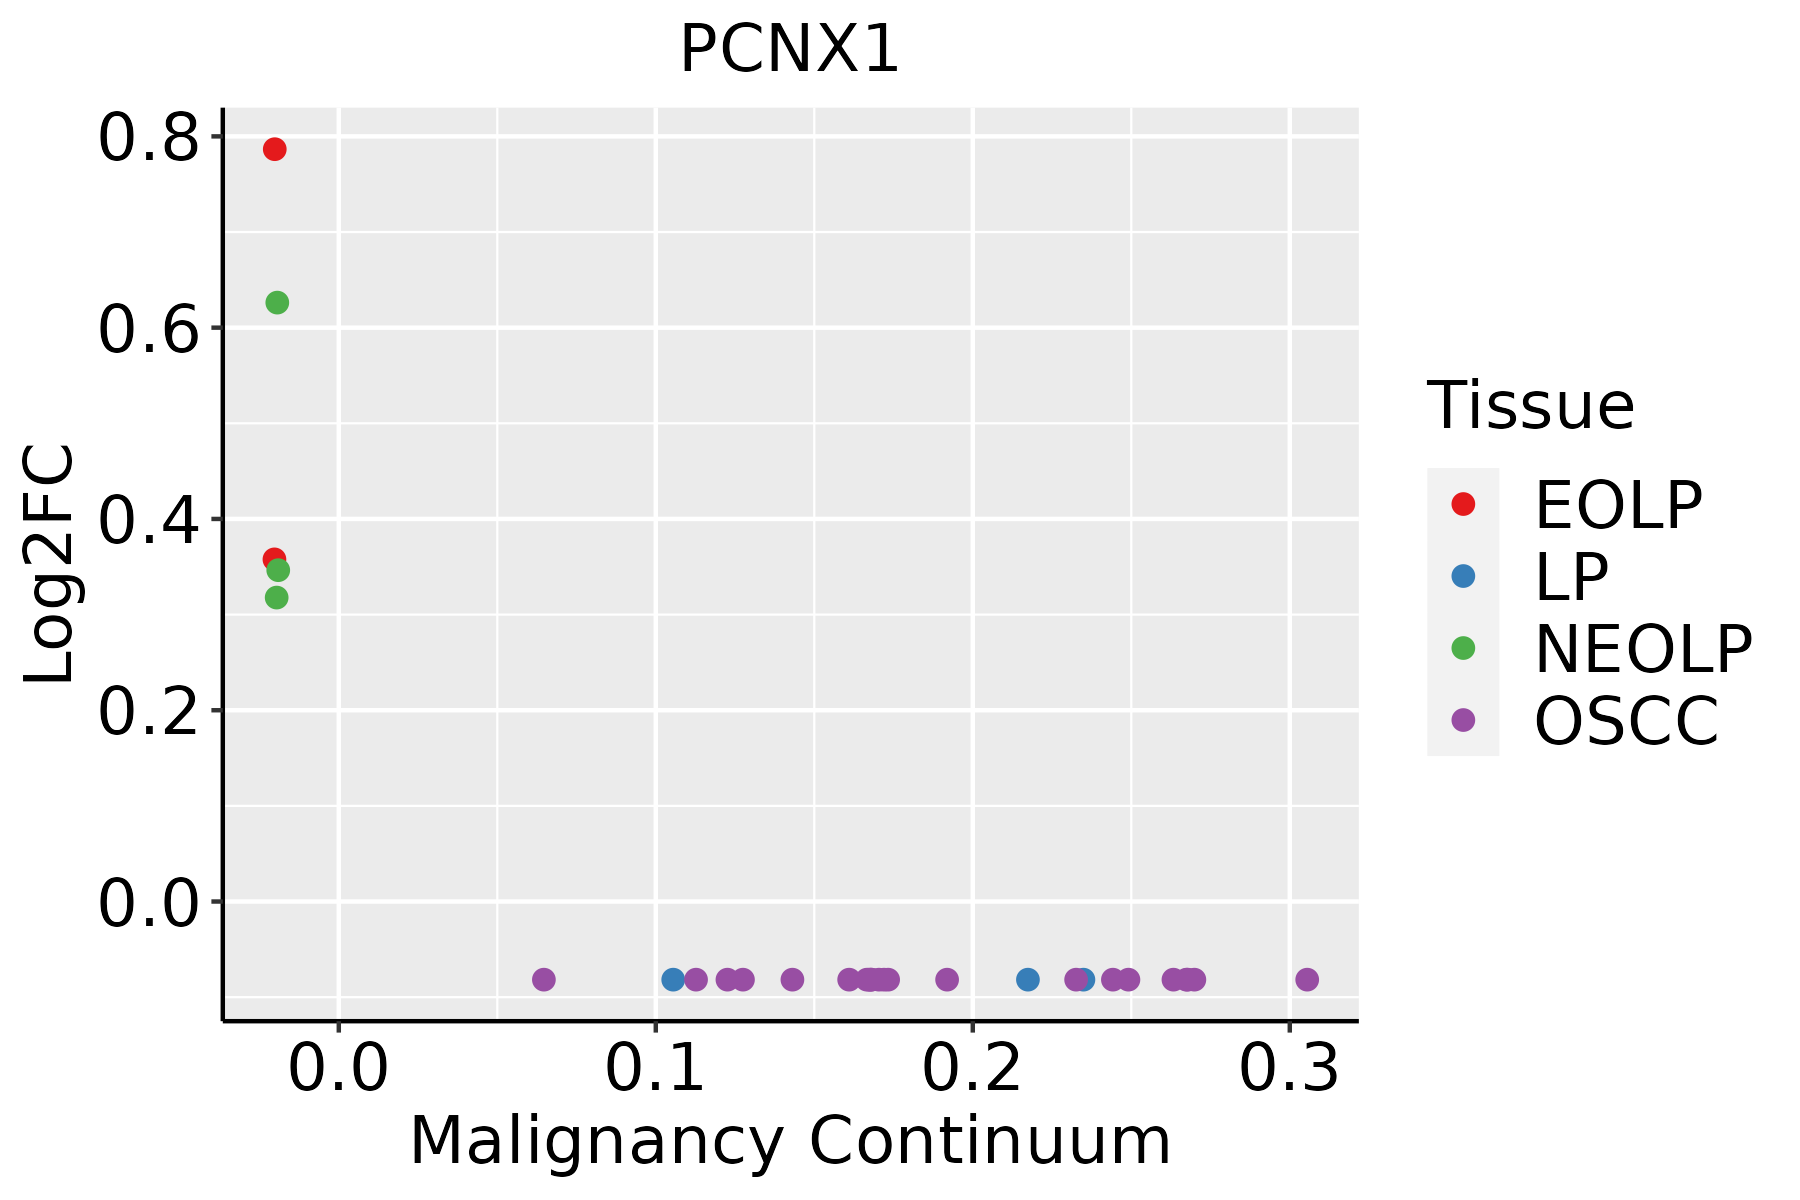 | EOLP: Erosive Oral lichen planus |
| LP: leukoplakia | ||
| NEOLP: Non-erosive oral lichen planus | ||
| OSCC: Oral squamous cell carcinoma | ||
| Prostate | 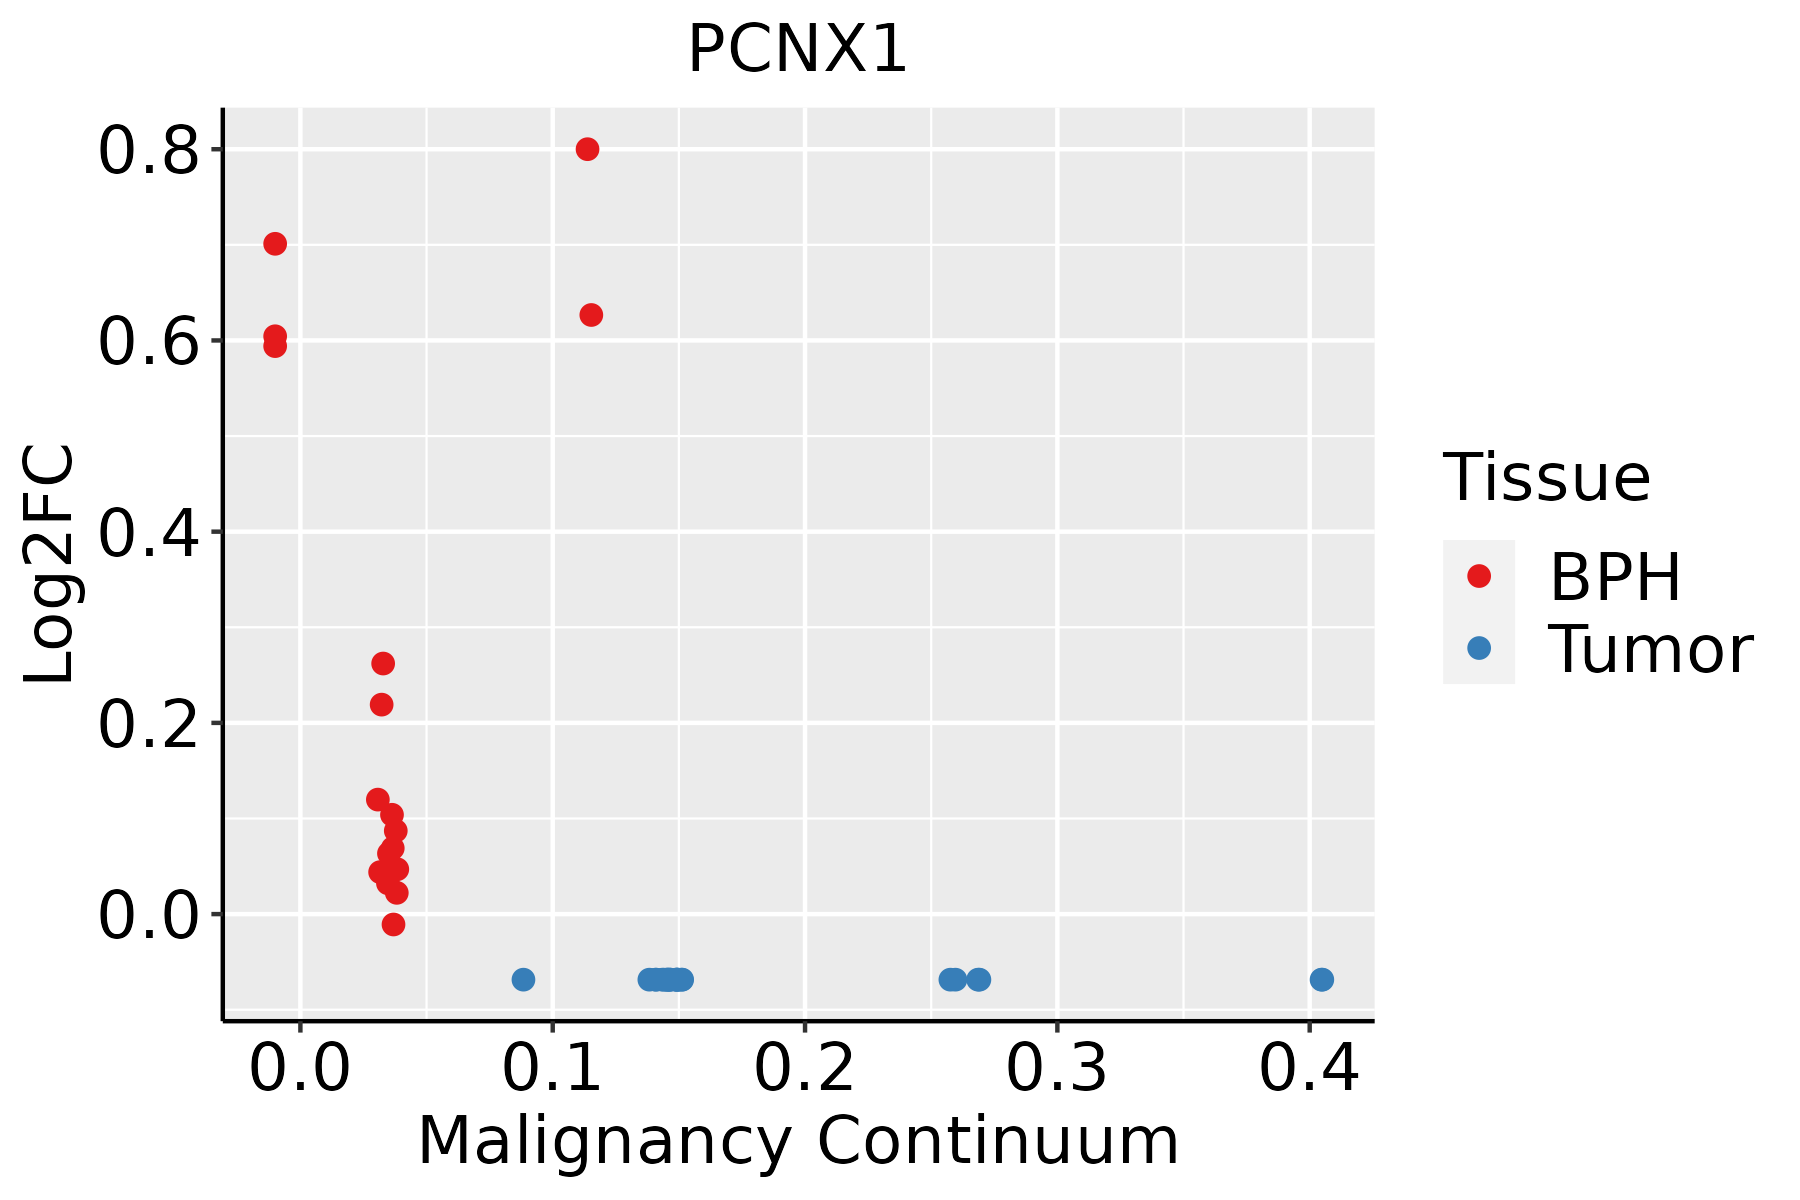 | BPH: Benign Prostatic Hyperplasia |
| Thyroid |  | ATC: Anaplastic thyroid cancer |
| HT: Hashimoto's thyroiditis | ||
| PTC: Papillary thyroid cancer |
| ∗log2FC in expression of this searched gene in stem-like cells from each diseased tissue sample relative to stem-like cells in normal samples in each tissue plotted against the malignancy continuum. Samples are colored based on if they are from different disease stage. |
Top |
Malignant transformation related pathway analysis |
| Find out the enriched GO biological processes and KEGG pathways involved in transition from healthy to precancer to cancer |
| Tissue | Disease Stage | Enriched GO biological Processes |
| Colorectum | AD |  |
| Colorectum | SER |  |
| Colorectum | MSS |  |
| Colorectum | MSI-H |  |
| Colorectum | FAP |  |
| ∗Top 15 enriched GO BP terms are showed in the bar plot of each disease state in each tissue. Each row represents a significant GO biological process which is colored according to the -log10(p.adjust). |
| Page: 1 2 3 4 5 6 7 8 9 |
| GO ID | Tissue | Disease Stage | Description | Gene Ratio | Bg Ratio | pvalue | p.adjust | Count |
| Page: 1 |
| Pathway ID | Tissue | Disease Stage | Description | Gene Ratio | Bg Ratio | pvalue | p.adjust | qvalue | Count |
| Page: 1 |
Top |
Cell-cell communication analysis |
| Identification of potential cell-cell interactions between two cell types and their ligand-receptor pairs for different disease states |
| Ligand | Receptor | LRpair | Pathway | Tissue | Disease Stage |
| Page: 1 |
Top |
Single-cell gene regulatory network inference analysis |
| Find out the significant the regulons (TFs) and the target genes of each regulon across cell types for different disease states |
| TF | Cell Type | Tissue | Disease Stage | Target Gene | RSS | Regulon Activity |
| ∗The dot plots of a searched regulon are shown for all cell subpopulations in each disease state of each tissue based on the regulon specific score inferred using pySCENIC and by calculating the average expression. |
| Page: 1 |
Top |
Somatic mutation of malignant transformation related genes |
| Annotation of somatic variants for genes involved in malignant transformation |
| Hugo Symbol | Variant Class | Variant Classification | dbSNP RS | HGVSc | HGVSp | HGVSp Short | SWISSPROT | BIOTYPE | SIFT | PolyPhen | Tumor Sample Barcode | Tissue | Histology | Sex | Age | Stage | Therapy Types | Drugs | Outcome |
| PCNX1 | SNV | Missense_Mutation | c.2219N>A | p.Ala740Asp | p.A740D | Q96RV3 | protein_coding | tolerated(0.06) | probably_damaging(0.996) | TCGA-A2-A25C-01 | Breast | breast invasive carcinoma | Female | <65 | I/II | Chemotherapy | taxotere | SD | |
| PCNX1 | SNV | Missense_Mutation | c.1454N>T | p.Ser485Phe | p.S485F | Q96RV3 | protein_coding | tolerated(0.73) | possibly_damaging(0.545) | TCGA-AC-A23H-01 | Breast | breast invasive carcinoma | Female | >=65 | I/II | Unknown | Unknown | PD | |
| PCNX1 | SNV | Missense_Mutation | c.4211N>G | p.Ser1404Cys | p.S1404C | Q96RV3 | protein_coding | deleterious(0.03) | probably_damaging(0.993) | TCGA-AC-A23H-01 | Breast | breast invasive carcinoma | Female | >=65 | I/II | Unknown | Unknown | PD | |
| PCNX1 | SNV | Missense_Mutation | novel | c.3136N>A | p.Tyr1046Asn | p.Y1046N | Q96RV3 | protein_coding | deleterious(0) | probably_damaging(0.994) | TCGA-AC-A62V-01 | Breast | breast invasive carcinoma | Male | <65 | III/IV | Targeted Molecular therapy | denosumab | PD |
| PCNX1 | SNV | Missense_Mutation | novel | c.5693N>T | p.Ala1898Val | p.A1898V | Q96RV3 | protein_coding | tolerated(0.13) | possibly_damaging(0.902) | TCGA-AN-A0AK-01 | Breast | breast invasive carcinoma | Female | >=65 | I/II | Unknown | Unknown | SD |
| PCNX1 | SNV | Missense_Mutation | c.4187C>A | p.Ala1396Asp | p.A1396D | Q96RV3 | protein_coding | deleterious(0) | possibly_damaging(0.832) | TCGA-AO-A0J4-01 | Breast | breast invasive carcinoma | Female | <65 | I/II | Chemotherapy | doxorubicin | SD | |
| PCNX1 | SNV | Missense_Mutation | novel | c.1375A>T | p.Ser459Cys | p.S459C | Q96RV3 | protein_coding | deleterious_low_confidence(0.03) | benign(0) | TCGA-AR-A0U0-01 | Breast | breast invasive carcinoma | Female | >=65 | I/II | Unknown | Unknown | SD |
| PCNX1 | SNV | Missense_Mutation | c.5212N>A | p.Val1738Met | p.V1738M | Q96RV3 | protein_coding | tolerated(0.24) | benign(0.443) | TCGA-BH-A0RX-01 | Breast | breast invasive carcinoma | Female | <65 | I/II | Chemotherapy | fluorouracil | SD | |
| PCNX1 | SNV | Missense_Mutation | novel | c.3236G>C | p.Cys1079Ser | p.C1079S | Q96RV3 | protein_coding | deleterious(0.02) | probably_damaging(0.977) | TCGA-BH-A0W7-01 | Breast | breast invasive carcinoma | Female | <65 | I/II | Chemotherapy | taxotere | CR |
| PCNX1 | SNV | Missense_Mutation | c.6883C>T | p.His2295Tyr | p.H2295Y | Q96RV3 | protein_coding | deleterious_low_confidence(0.01) | benign(0.255) | TCGA-D8-A1JP-01 | Breast | breast invasive carcinoma | Female | >=65 | I/II | Hormone Therapy | tamoxiphen | SD |
| Page: 1 2 3 4 5 6 7 8 9 10 11 12 13 14 15 16 17 18 19 20 21 22 23 |
Top |
Related drugs of malignant transformation related genes |
| Identification of chemicals and drugs interact with genes involved in malignant transfromation |
| (DGIdb 4.0) |
| Entrez ID | Symbol | Category | Interaction Types | Drug Claim Name | Drug Name | PMIDs |
| Page: 1 |

Copyright 2023-Present -The University of Texas Health Science Center at Houston |