
|
|||||
|
 | |
| |
| |
| |
| |
| |
|
Gene: PCNT |
Gene summary for PCNT |
| Gene information | Species | Human | Gene symbol | PCNT | Gene ID | 5116 |
| Gene name | pericentrin | |
| Gene Alias | KEN | |
| Cytomap | 21q22.3 | |
| Gene Type | protein-coding | GO ID | GO:0000226 | UniProtAcc | O95613 |
Top |
Malignant transformation analysis |
| Identification of the aberrant gene expression in precancerous and cancerous lesions by comparing the gene expression of stem-like cells in diseased tissues with normal stem cells |
| Entrez ID | Symbol | Replicates | Species | Organ | Tissue | Adj P-value | Log2FC | Malignancy |
| 5116 | PCNT | LZE4T | Human | Esophagus | ESCC | 3.15e-02 | 1.17e-01 | 0.0811 |
| 5116 | PCNT | LZE22T | Human | Esophagus | ESCC | 4.33e-02 | 1.68e-01 | 0.068 |
| 5116 | PCNT | LZE24T | Human | Esophagus | ESCC | 7.35e-11 | 2.86e-01 | 0.0596 |
| 5116 | PCNT | P1T-E | Human | Esophagus | ESCC | 4.37e-05 | 3.06e-01 | 0.0875 |
| 5116 | PCNT | P2T-E | Human | Esophagus | ESCC | 1.03e-07 | 1.53e-01 | 0.1177 |
| 5116 | PCNT | P4T-E | Human | Esophagus | ESCC | 2.56e-09 | 2.04e-01 | 0.1323 |
| 5116 | PCNT | P5T-E | Human | Esophagus | ESCC | 3.28e-08 | 1.72e-01 | 0.1327 |
| 5116 | PCNT | P9T-E | Human | Esophagus | ESCC | 1.29e-04 | 6.20e-02 | 0.1131 |
| 5116 | PCNT | P10T-E | Human | Esophagus | ESCC | 3.42e-20 | 3.79e-01 | 0.116 |
| 5116 | PCNT | P12T-E | Human | Esophagus | ESCC | 1.23e-06 | 1.98e-01 | 0.1122 |
| 5116 | PCNT | P15T-E | Human | Esophagus | ESCC | 1.09e-03 | 6.81e-02 | 0.1149 |
| 5116 | PCNT | P16T-E | Human | Esophagus | ESCC | 6.17e-11 | 1.93e-01 | 0.1153 |
| 5116 | PCNT | P17T-E | Human | Esophagus | ESCC | 1.62e-05 | 1.97e-01 | 0.1278 |
| 5116 | PCNT | P20T-E | Human | Esophagus | ESCC | 3.64e-05 | 8.94e-02 | 0.1124 |
| 5116 | PCNT | P21T-E | Human | Esophagus | ESCC | 2.34e-11 | 2.13e-01 | 0.1617 |
| 5116 | PCNT | P22T-E | Human | Esophagus | ESCC | 1.35e-10 | 1.61e-01 | 0.1236 |
| 5116 | PCNT | P23T-E | Human | Esophagus | ESCC | 1.72e-03 | 1.01e-01 | 0.108 |
| 5116 | PCNT | P24T-E | Human | Esophagus | ESCC | 3.57e-06 | 1.47e-01 | 0.1287 |
| 5116 | PCNT | P26T-E | Human | Esophagus | ESCC | 8.43e-05 | 1.25e-01 | 0.1276 |
| 5116 | PCNT | P27T-E | Human | Esophagus | ESCC | 2.70e-16 | 3.45e-01 | 0.1055 |
| Page: 1 2 3 |
| Tissue | Expression Dynamics | Abbreviation |
| Esophagus | 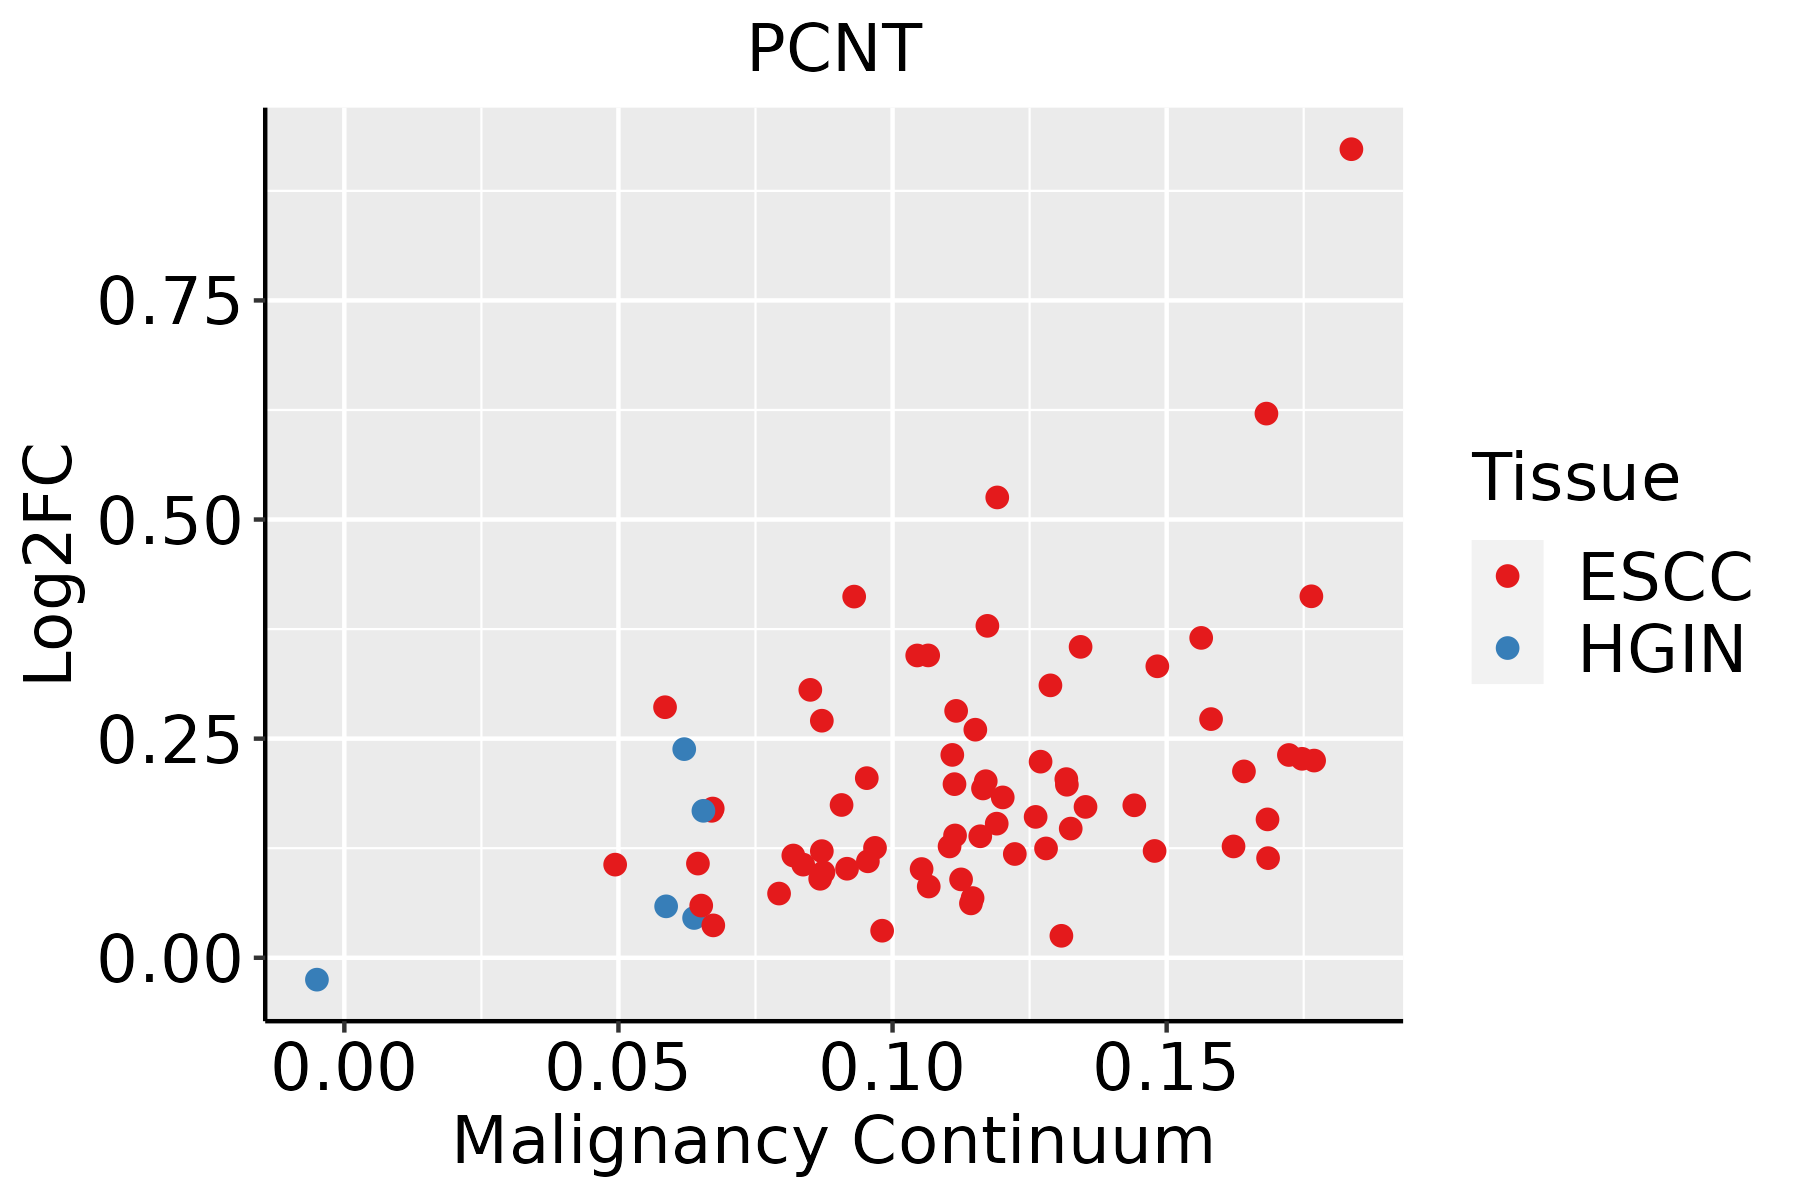 | ESCC: Esophageal squamous cell carcinoma |
| HGIN: High-grade intraepithelial neoplasias | ||
| LGIN: Low-grade intraepithelial neoplasias | ||
| Liver | 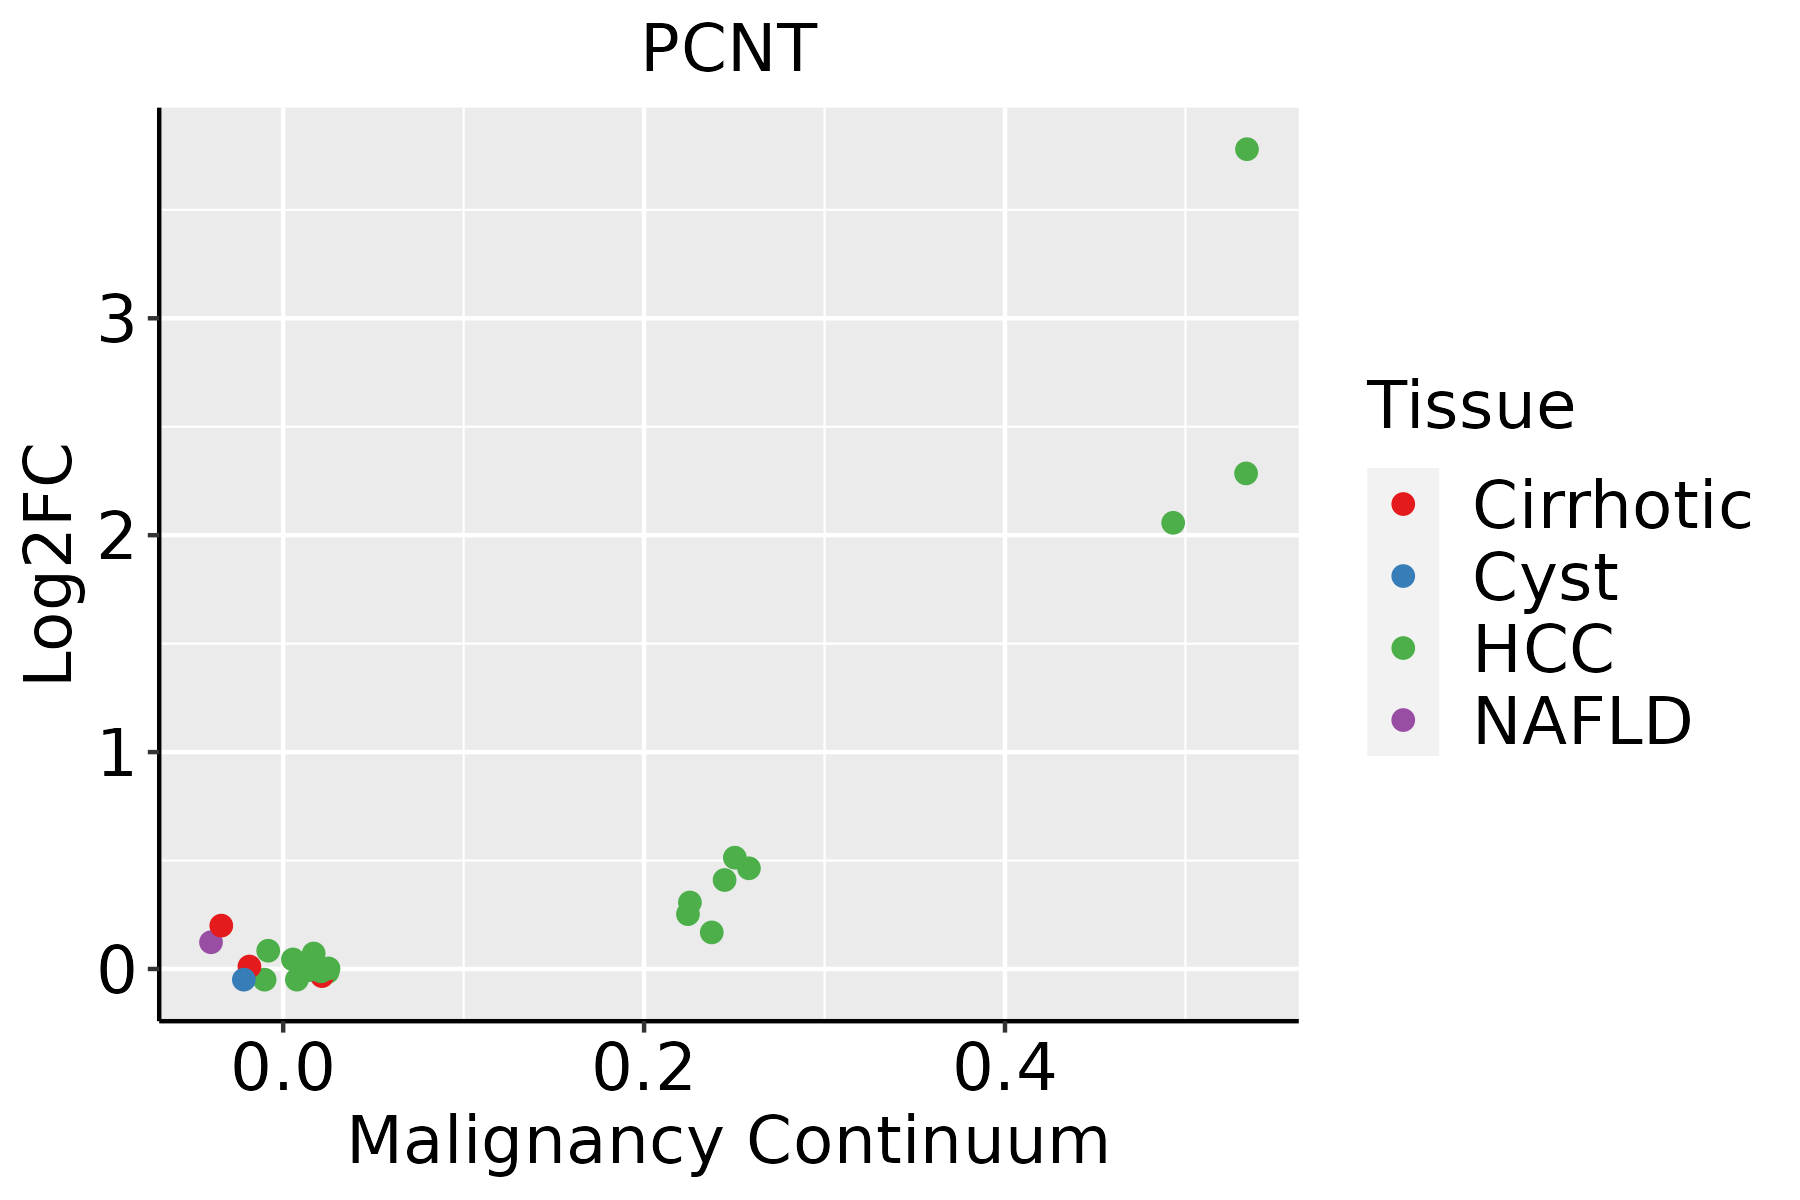 | HCC: Hepatocellular carcinoma |
| NAFLD: Non-alcoholic fatty liver disease |
| ∗log2FC in expression of this searched gene in stem-like cells from each diseased tissue sample relative to stem-like cells in normal samples in each tissue plotted against the malignancy continuum. Samples are colored based on if they are from different disease stage. |
Top |
Malignant transformation related pathway analysis |
| Find out the enriched GO biological processes and KEGG pathways involved in transition from healthy to precancer to cancer |
| Tissue | Disease Stage | Enriched GO biological Processes |
| Colorectum | AD |  |
| Colorectum | SER |  |
| Colorectum | MSS |  |
| Colorectum | MSI-H |  |
| Colorectum | FAP |  |
| ∗Top 15 enriched GO BP terms are showed in the bar plot of each disease state in each tissue. Each row represents a significant GO biological process which is colored according to the -log10(p.adjust). |
| Page: 1 2 3 4 5 6 7 8 9 |
| GO ID | Tissue | Disease Stage | Description | Gene Ratio | Bg Ratio | pvalue | p.adjust | Count |
| GO:003238618 | Esophagus | ESCC | regulation of intracellular transport | 243/8552 | 337/18723 | 3.20e-23 | 7.25e-21 | 243 |
| GO:0033157110 | Esophagus | ESCC | regulation of intracellular protein transport | 169/8552 | 229/18723 | 3.31e-18 | 3.23e-16 | 169 |
| GO:0032388110 | Esophagus | ESCC | positive regulation of intracellular transport | 152/8552 | 202/18723 | 7.89e-18 | 7.36e-16 | 152 |
| GO:190285015 | Esophagus | ESCC | microtubule cytoskeleton organization involved in mitosis | 116/8552 | 147/18723 | 1.25e-16 | 9.91e-15 | 116 |
| GO:1904951111 | Esophagus | ESCC | positive regulation of establishment of protein localization | 216/8552 | 319/18723 | 1.01e-15 | 6.86e-14 | 216 |
| GO:000705214 | Esophagus | ESCC | mitotic spindle organization | 97/8552 | 120/18723 | 2.17e-15 | 1.33e-13 | 97 |
| GO:009031617 | Esophagus | ESCC | positive regulation of intracellular protein transport | 122/8552 | 160/18723 | 2.45e-15 | 1.49e-13 | 122 |
| GO:0051222111 | Esophagus | ESCC | positive regulation of protein transport | 204/8552 | 303/18723 | 1.56e-14 | 8.38e-13 | 204 |
| GO:000705114 | Esophagus | ESCC | spindle organization | 134/8552 | 184/18723 | 5.70e-14 | 2.87e-12 | 134 |
| GO:003238621 | Liver | HCC | regulation of intracellular transport | 231/7958 | 337/18723 | 1.99e-22 | 3.40e-20 | 231 |
| GO:003315721 | Liver | HCC | regulation of intracellular protein transport | 165/7958 | 229/18723 | 8.37e-20 | 1.15e-17 | 165 |
| GO:003238821 | Liver | HCC | positive regulation of intracellular transport | 148/7958 | 202/18723 | 5.15e-19 | 6.66e-17 | 148 |
| GO:009031621 | Liver | HCC | positive regulation of intracellular protein transport | 121/7958 | 160/18723 | 1.27e-17 | 1.39e-15 | 121 |
| GO:190495122 | Liver | HCC | positive regulation of establishment of protein localization | 207/7958 | 319/18723 | 3.95e-16 | 3.29e-14 | 207 |
| GO:005122222 | Liver | HCC | positive regulation of protein transport | 194/7958 | 303/18723 | 2.41e-14 | 1.56e-12 | 194 |
| GO:000705111 | Liver | HCC | spindle organization | 116/7958 | 184/18723 | 1.40e-08 | 3.40e-07 | 116 |
| GO:000705211 | Liver | HCC | mitotic spindle organization | 80/7958 | 120/18723 | 7.43e-08 | 1.50e-06 | 80 |
| GO:190285011 | Liver | HCC | microtubule cytoskeleton organization involved in mitosis | 93/7958 | 147/18723 | 2.91e-07 | 5.09e-06 | 93 |
| Page: 1 |
| Pathway ID | Tissue | Disease Stage | Description | Gene Ratio | Bg Ratio | pvalue | p.adjust | qvalue | Count |
| Page: 1 |
Top |
Cell-cell communication analysis |
| Identification of potential cell-cell interactions between two cell types and their ligand-receptor pairs for different disease states |
| Ligand | Receptor | LRpair | Pathway | Tissue | Disease Stage |
| Page: 1 |
Top |
Single-cell gene regulatory network inference analysis |
| Find out the significant the regulons (TFs) and the target genes of each regulon across cell types for different disease states |
| TF | Cell Type | Tissue | Disease Stage | Target Gene | RSS | Regulon Activity |
| ∗The dot plots of a searched regulon are shown for all cell subpopulations in each disease state of each tissue based on the regulon specific score inferred using pySCENIC and by calculating the average expression. |
| Page: 1 |
Top |
Somatic mutation of malignant transformation related genes |
| Annotation of somatic variants for genes involved in malignant transformation |
| Hugo Symbol | Variant Class | Variant Classification | dbSNP RS | HGVSc | HGVSp | HGVSp Short | SWISSPROT | BIOTYPE | SIFT | PolyPhen | Tumor Sample Barcode | Tissue | Histology | Sex | Age | Stage | Therapy Types | Drugs | Outcome |
| PCNT | SNV | Missense_Mutation | novel | c.238N>T | p.Asp80Tyr | p.D80Y | O95613 | protein_coding | deleterious(0) | possibly_damaging(0.72) | TCGA-5L-AAT1-01 | Breast | breast invasive carcinoma | Female | <65 | III/IV | Hormone Therapy | letrozol | SD |
| PCNT | SNV | Missense_Mutation | c.4901N>T | p.Pro1634Leu | p.P1634L | O95613 | protein_coding | tolerated(0.25) | benign(0.013) | TCGA-A2-A04N-01 | Breast | breast invasive carcinoma | Female | >=65 | I/II | Chemotherapy | cytoxan | SD | |
| PCNT | SNV | Missense_Mutation | rs201188810 | c.1907N>A | p.Arg636His | p.R636H | O95613 | protein_coding | tolerated(0.53) | benign(0) | TCGA-A8-A09A-01 | Breast | breast invasive carcinoma | Female | <65 | I/II | Hormone Therapy | tamoxiphen | SD |
| PCNT | SNV | Missense_Mutation | rs751935483 | c.3557G>A | p.Arg1186His | p.R1186H | O95613 | protein_coding | deleterious(0.04) | probably_damaging(0.997) | TCGA-A8-A09Z-01 | Breast | breast invasive carcinoma | Female | >=65 | I/II | Unknown | Unknown | SD |
| PCNT | SNV | Missense_Mutation | rs758557613 | c.3104N>A | p.Arg1035Gln | p.R1035Q | O95613 | protein_coding | tolerated(0.05) | benign(0.015) | TCGA-AN-A046-01 | Breast | breast invasive carcinoma | Female | >=65 | I/II | Unknown | Unknown | SD |
| PCNT | SNV | Missense_Mutation | rs200878443 | c.8453N>A | p.Ser2818Tyr | p.S2818Y | O95613 | protein_coding | tolerated(0.09) | possibly_damaging(0.459) | TCGA-AN-A046-01 | Breast | breast invasive carcinoma | Female | >=65 | I/II | Unknown | Unknown | SD |
| PCNT | SNV | Missense_Mutation | c.3973G>C | p.Glu1325Gln | p.E1325Q | O95613 | protein_coding | tolerated(0.8) | benign(0.01) | TCGA-AN-A0FX-01 | Breast | breast invasive carcinoma | Female | <65 | I/II | Unknown | Unknown | SD | |
| PCNT | SNV | Missense_Mutation | c.4516C>T | p.Leu1506Phe | p.L1506F | O95613 | protein_coding | deleterious(0) | probably_damaging(0.997) | TCGA-AO-A128-01 | Breast | breast invasive carcinoma | Female | <65 | I/II | Chemotherapy | doxorubicin | SD | |
| PCNT | SNV | Missense_Mutation | rs766015045 | c.4954N>A | p.Glu1652Lys | p.E1652K | O95613 | protein_coding | deleterious(0.01) | possibly_damaging(0.552) | TCGA-AO-A12D-01 | Breast | breast invasive carcinoma | Female | <65 | I/II | Chemotherapy | cyclophosphamide | SD |
| PCNT | SNV | Missense_Mutation | rs535351693 | c.2494N>A | p.Asp832Asn | p.D832N | O95613 | protein_coding | deleterious(0) | benign(0.125) | TCGA-AQ-A54N-01 | Breast | breast invasive carcinoma | Female | <65 | I/II | Unknown | Unknown | SD |
| Page: 1 2 3 4 5 6 7 8 9 10 11 12 13 14 15 16 17 18 19 20 21 22 23 24 25 26 27 28 29 30 31 32 |
Top |
Related drugs of malignant transformation related genes |
| Identification of chemicals and drugs interact with genes involved in malignant transfromation |
| (DGIdb 4.0) |
| Entrez ID | Symbol | Category | Interaction Types | Drug Claim Name | Drug Name | PMIDs |
| Page: 1 |

Copyright 2023-Present -The University of Texas Health Science Center at Houston |