| Tissue | Expression Dynamics | Abbreviation |
| Breast | 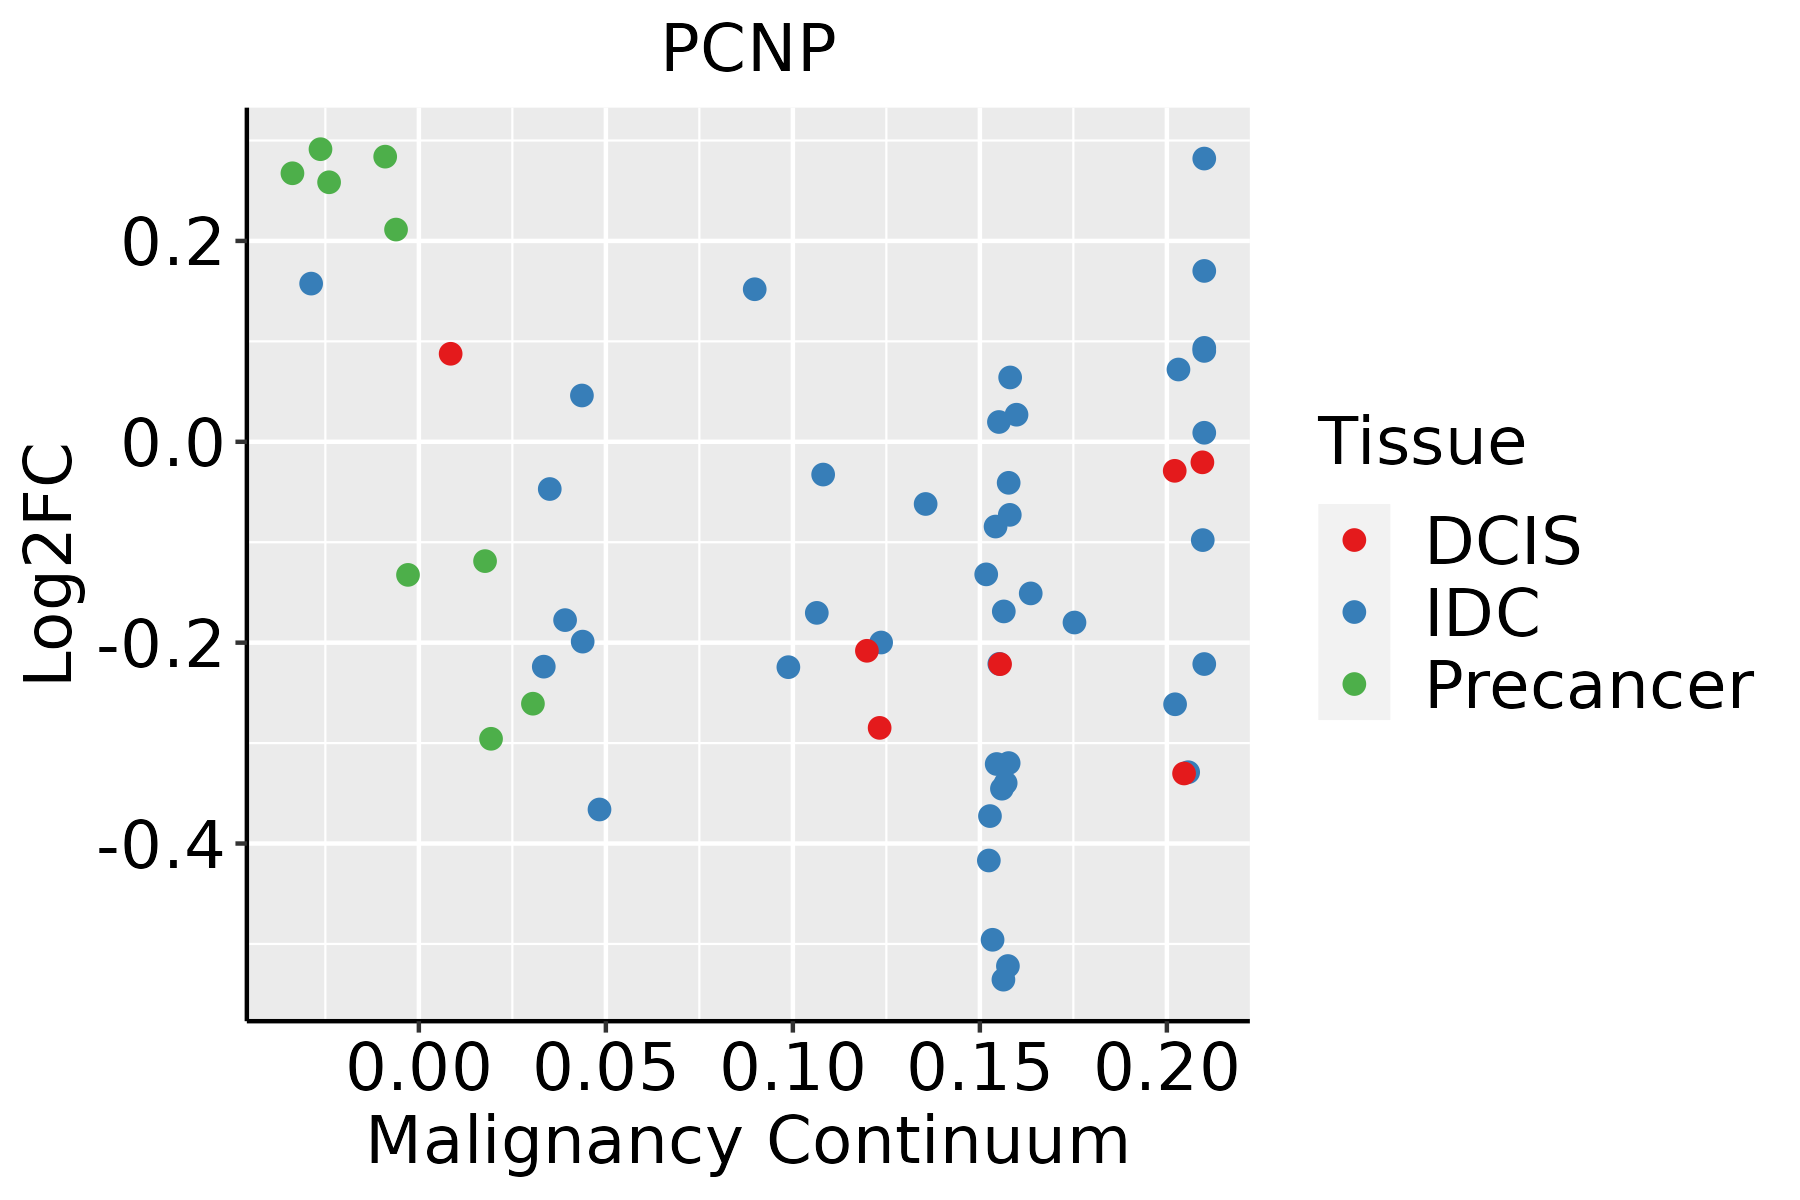 | IDC: Invasive ductal carcinoma |
| DCIS: Ductal carcinoma in situ |
| Precancer(BRCA1-mut): Precancerous lesion from BRCA1 mutation carriers |
| Colorectum (GSE201348) |  | FAP: Familial adenomatous polyposis |
| CRC: Colorectal cancer |
| Colorectum (HTA11) | 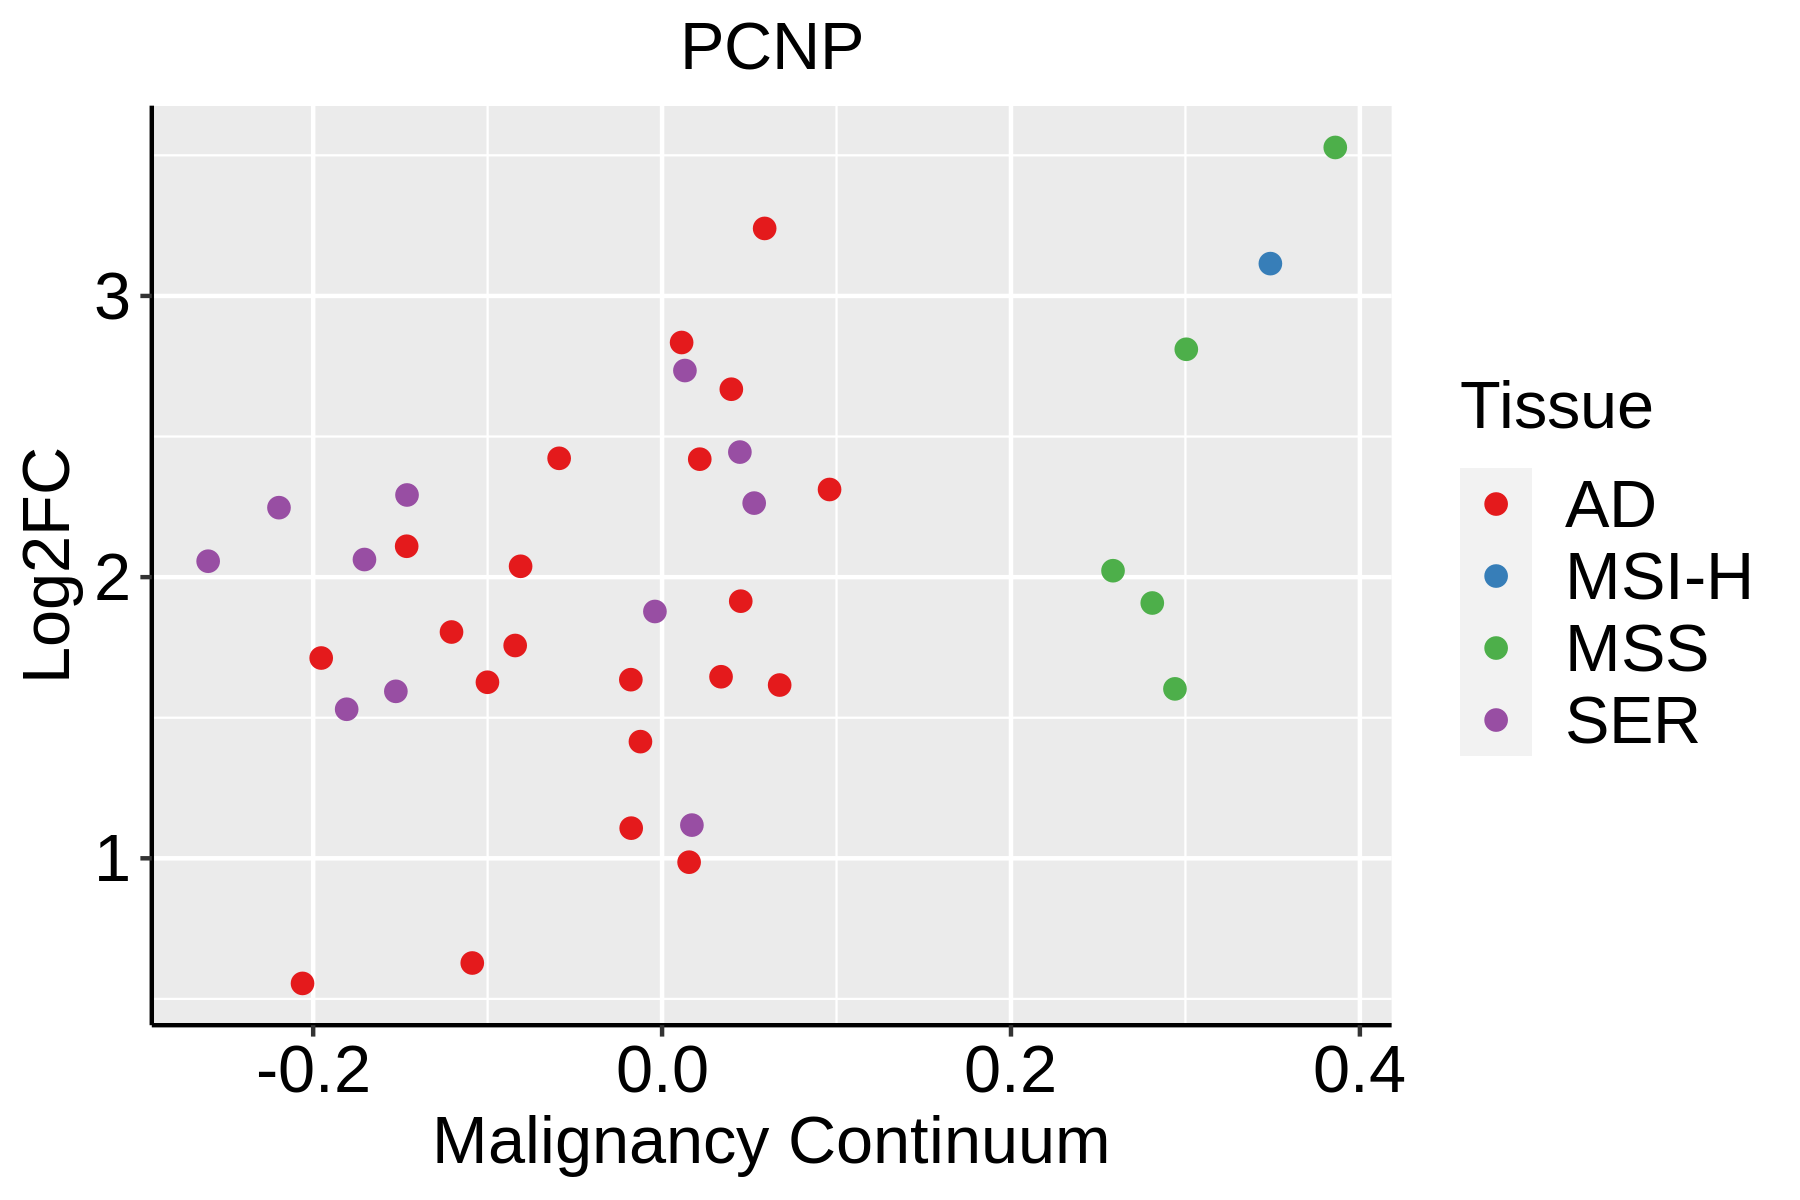 | AD: Adenomas |
| SER: Sessile serrated lesions |
| MSI-H: Microsatellite-high colorectal cancer |
| MSS: Microsatellite stable colorectal cancer |
| Endometrium | 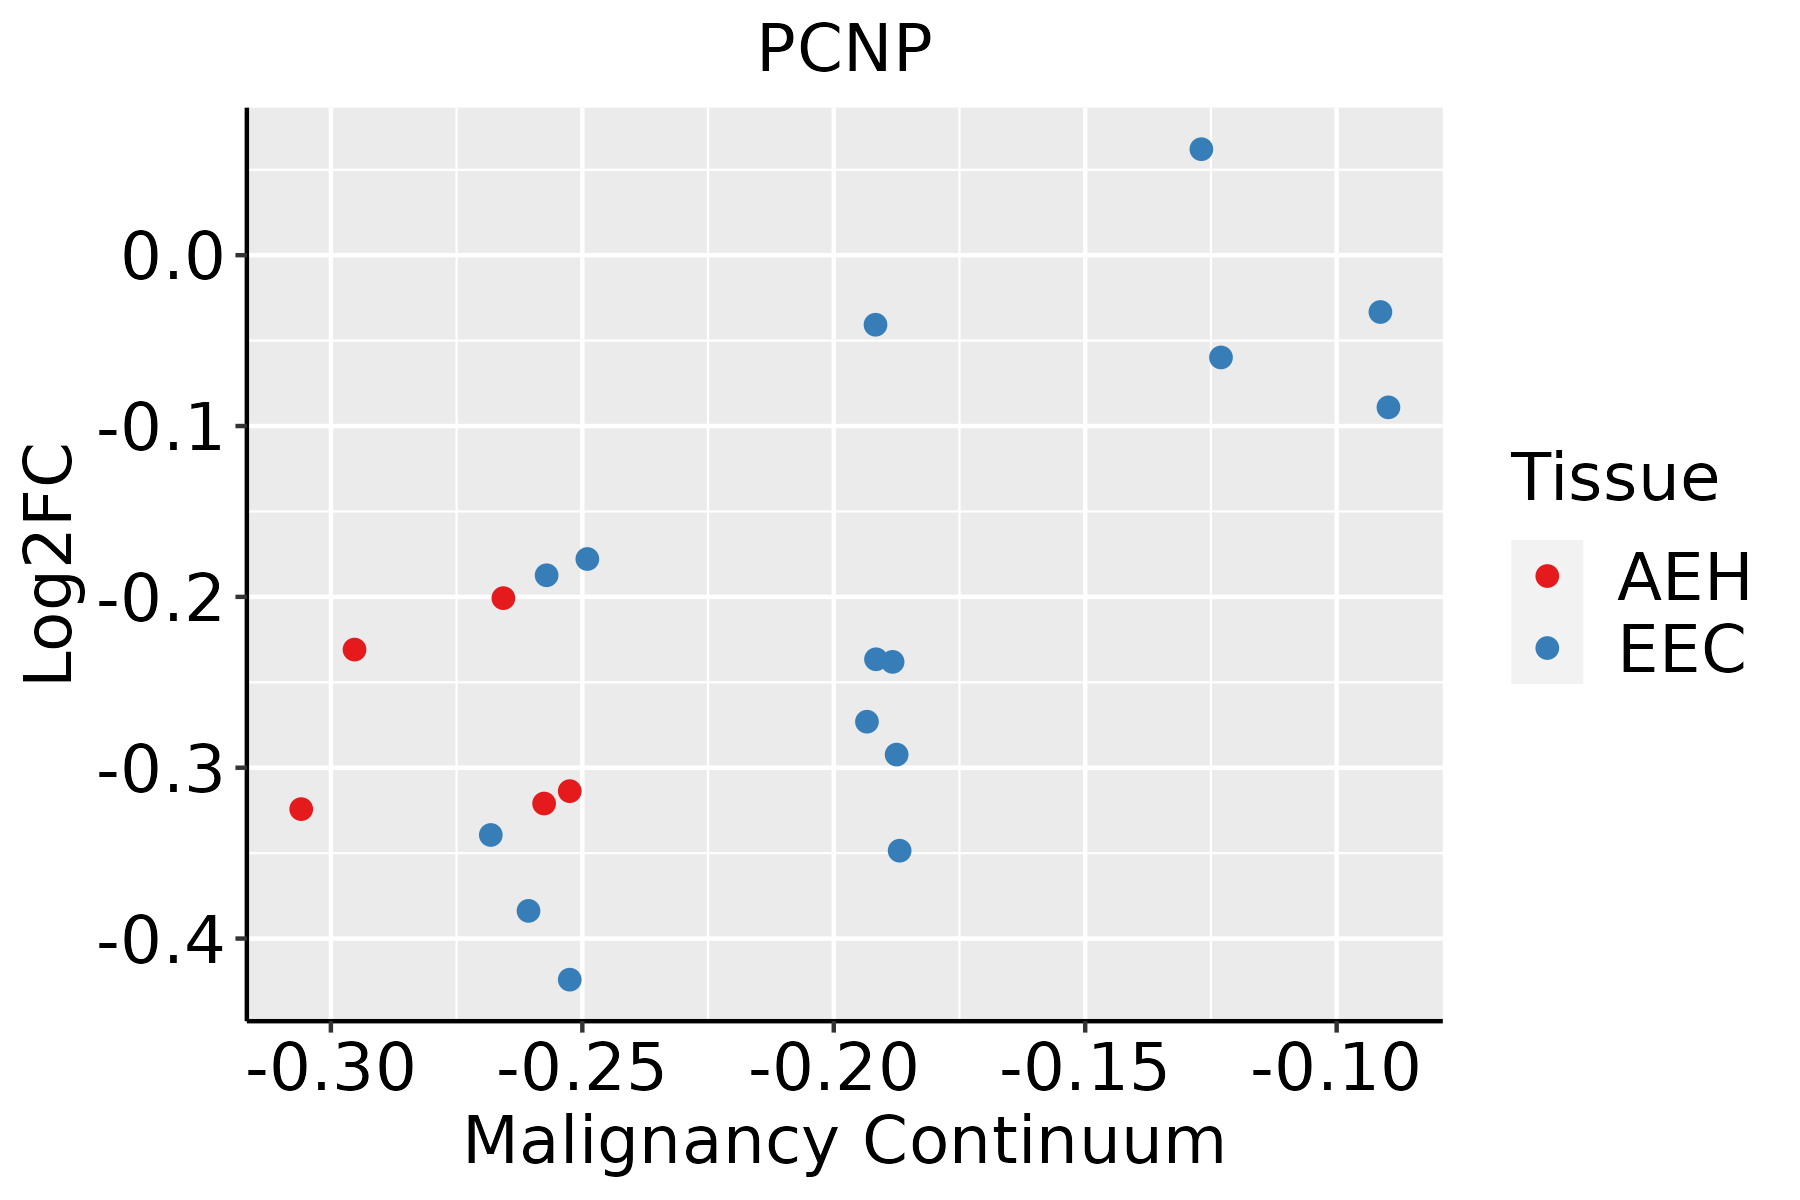 | AEH: Atypical endometrial hyperplasia |
| EEC: Endometrioid Cancer |
| Esophagus | 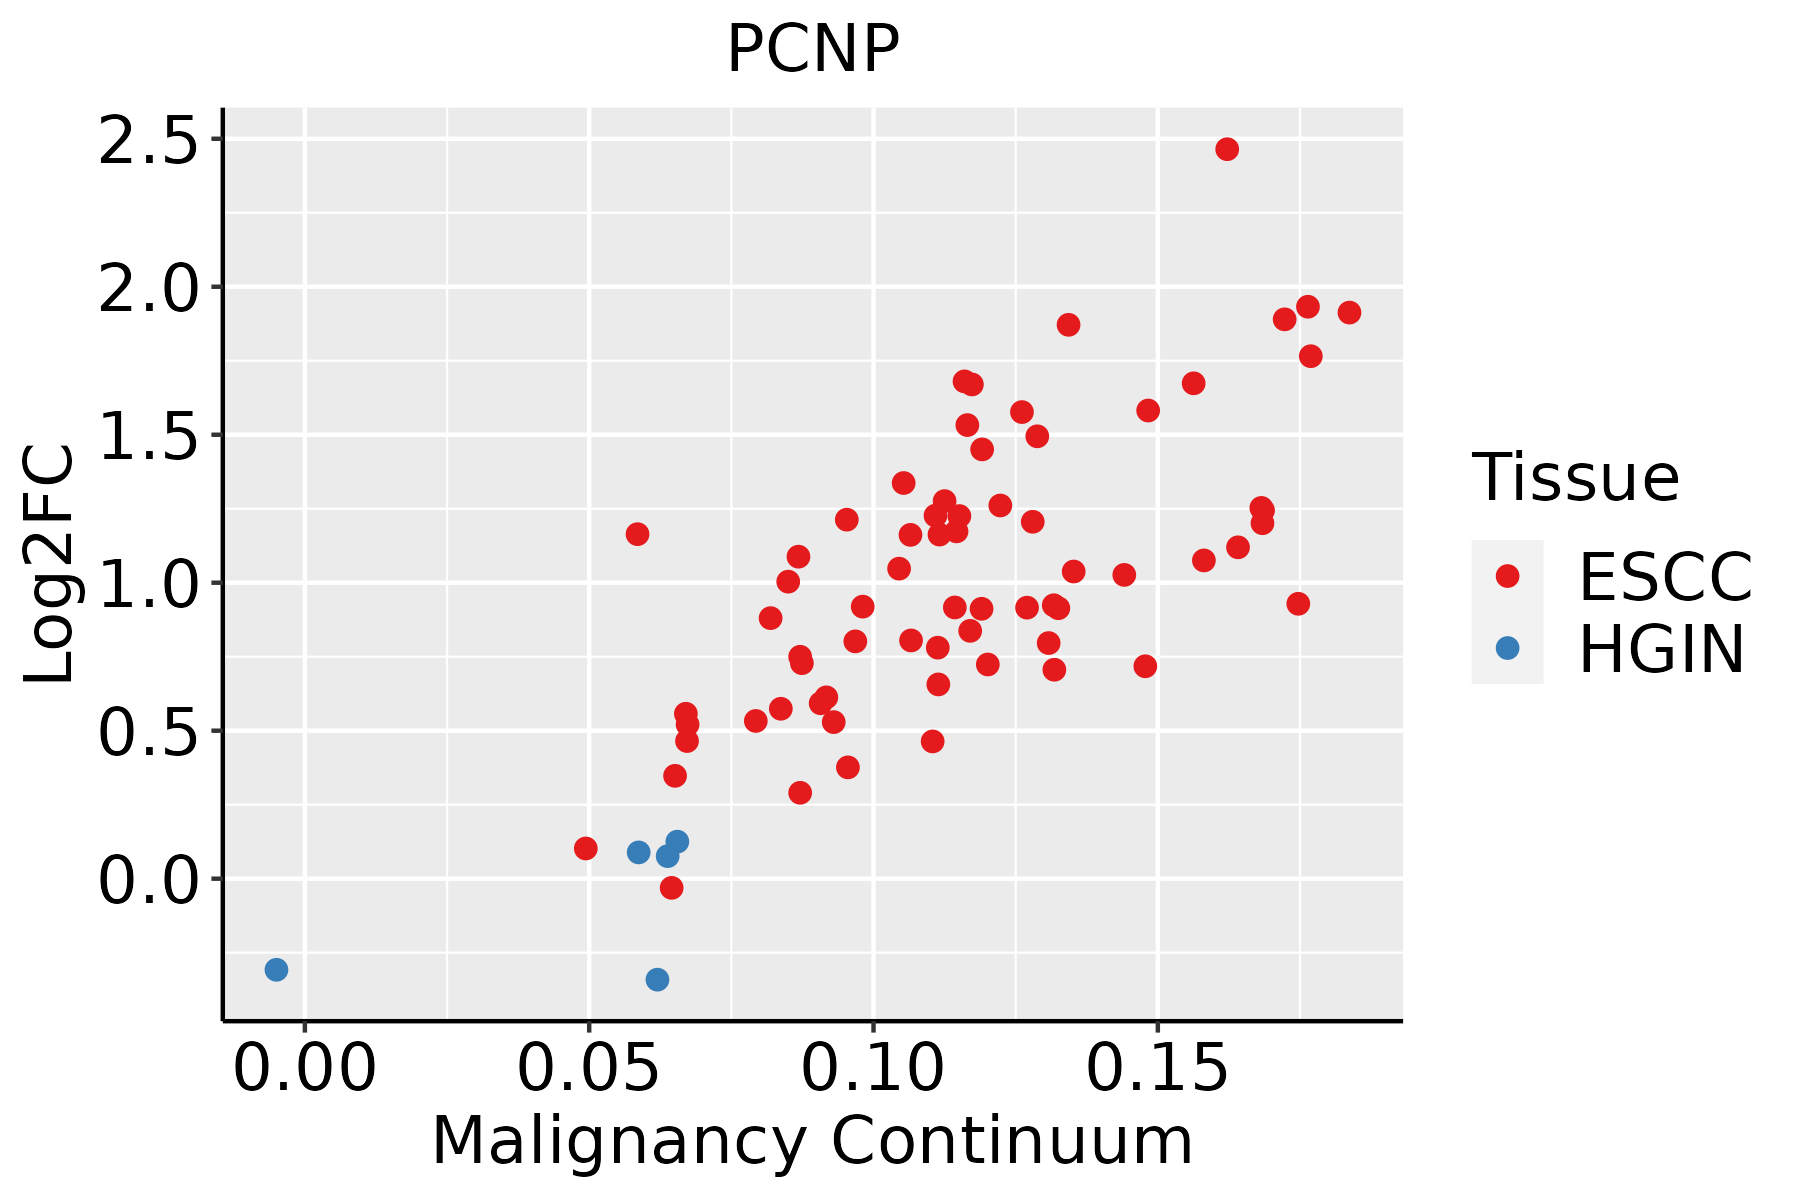 | ESCC: Esophageal squamous cell carcinoma |
| HGIN: High-grade intraepithelial neoplasias |
| LGIN: Low-grade intraepithelial neoplasias |
| Liver |  | HCC: Hepatocellular carcinoma |
| NAFLD: Non-alcoholic fatty liver disease |
| Oral Cavity | 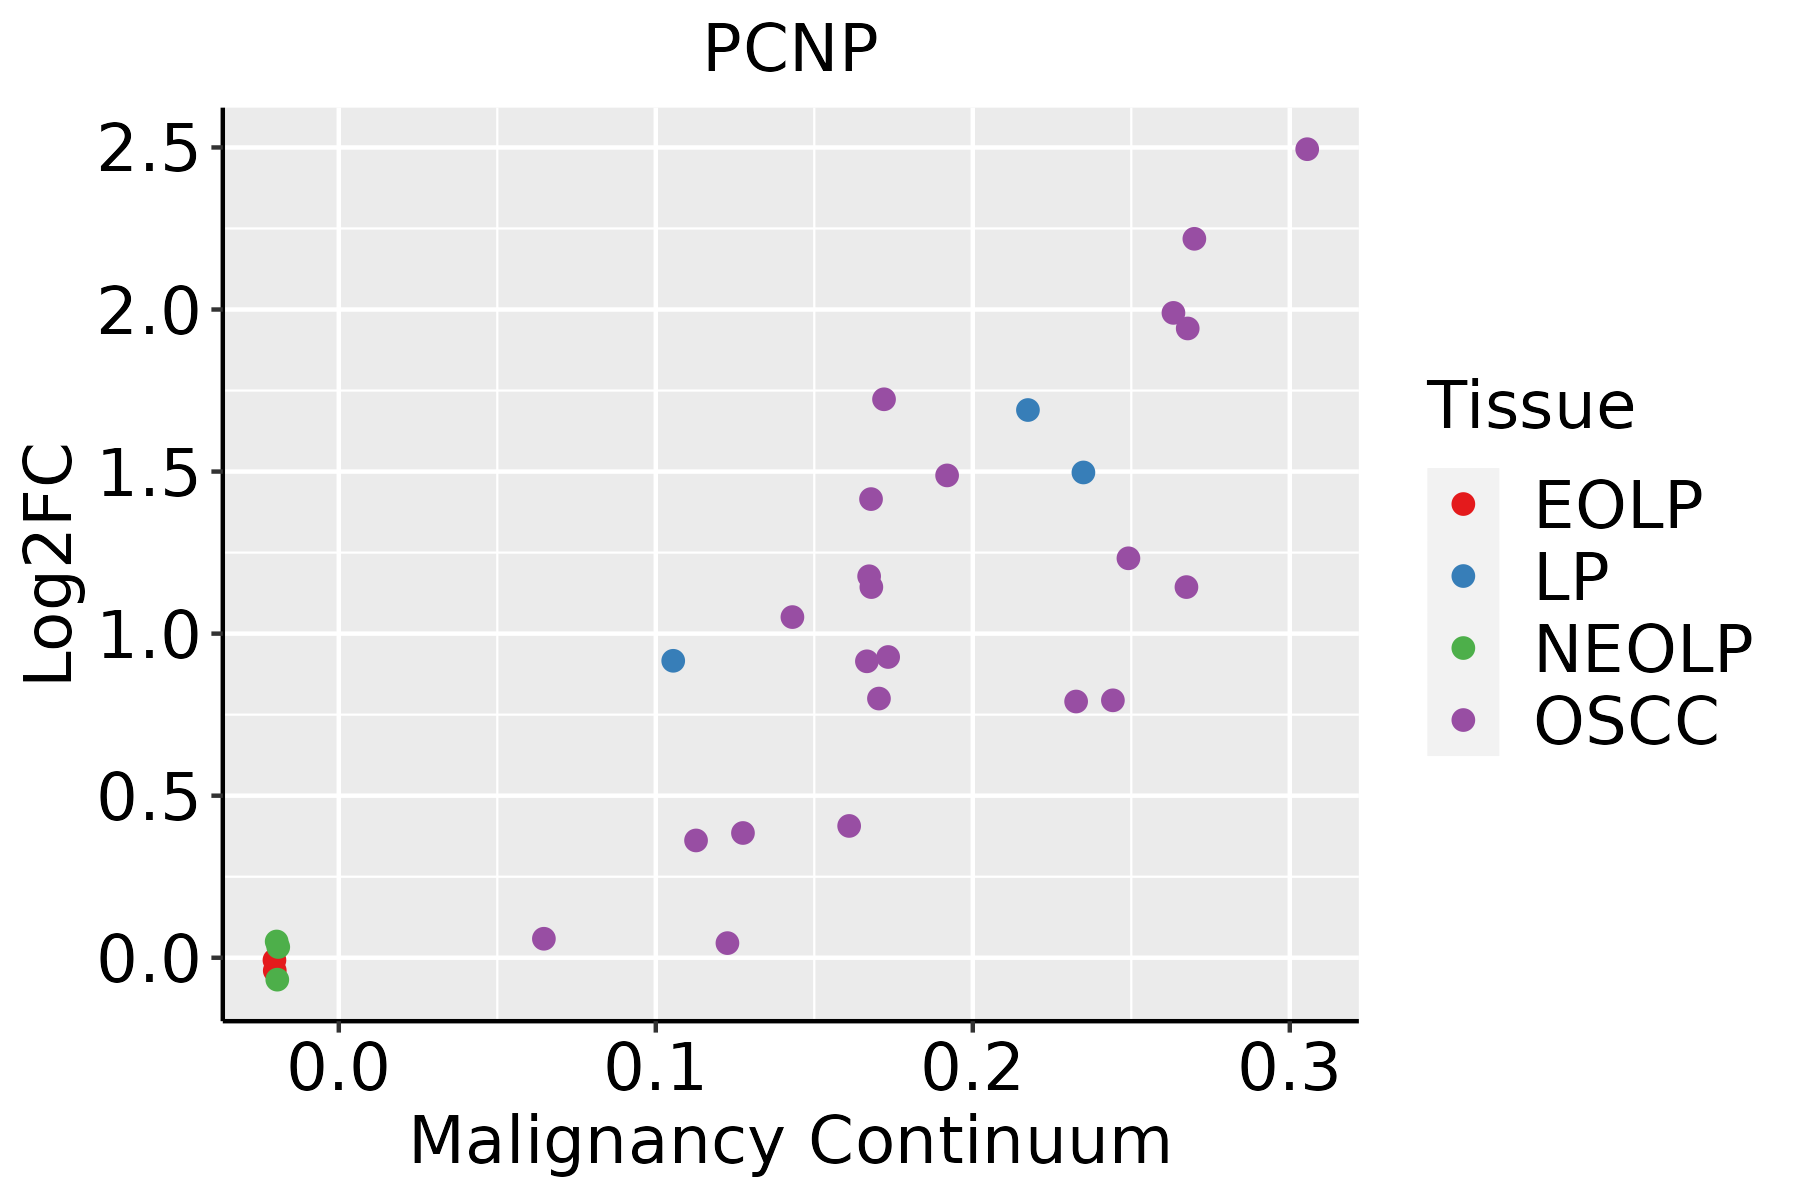 | EOLP: Erosive Oral lichen planus |
| LP: leukoplakia |
| NEOLP: Non-erosive oral lichen planus |
| OSCC: Oral squamous cell carcinoma |
| Skin | 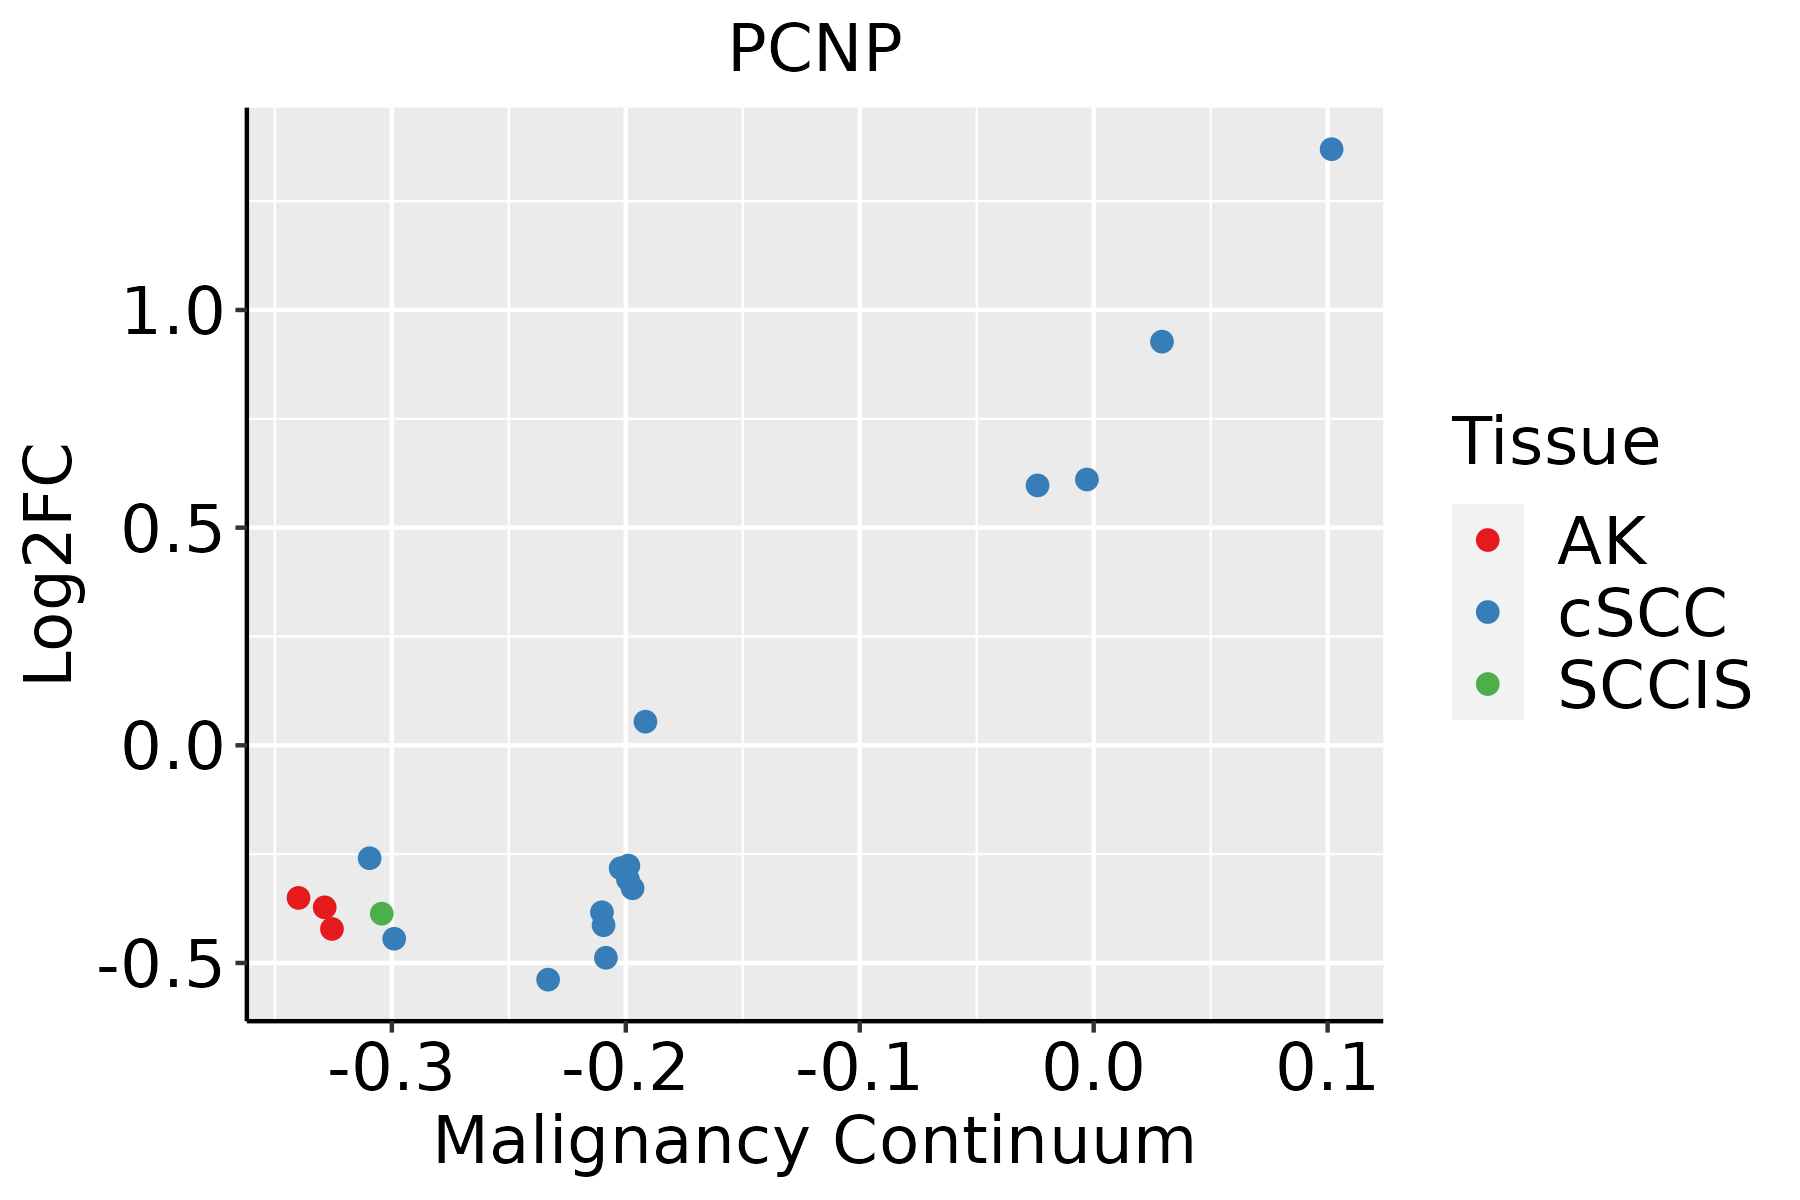 | AK: Actinic keratosis |
| cSCC: Cutaneous squamous cell carcinoma |
| SCCIS:squamous cell carcinoma in situ |
| Thyroid | 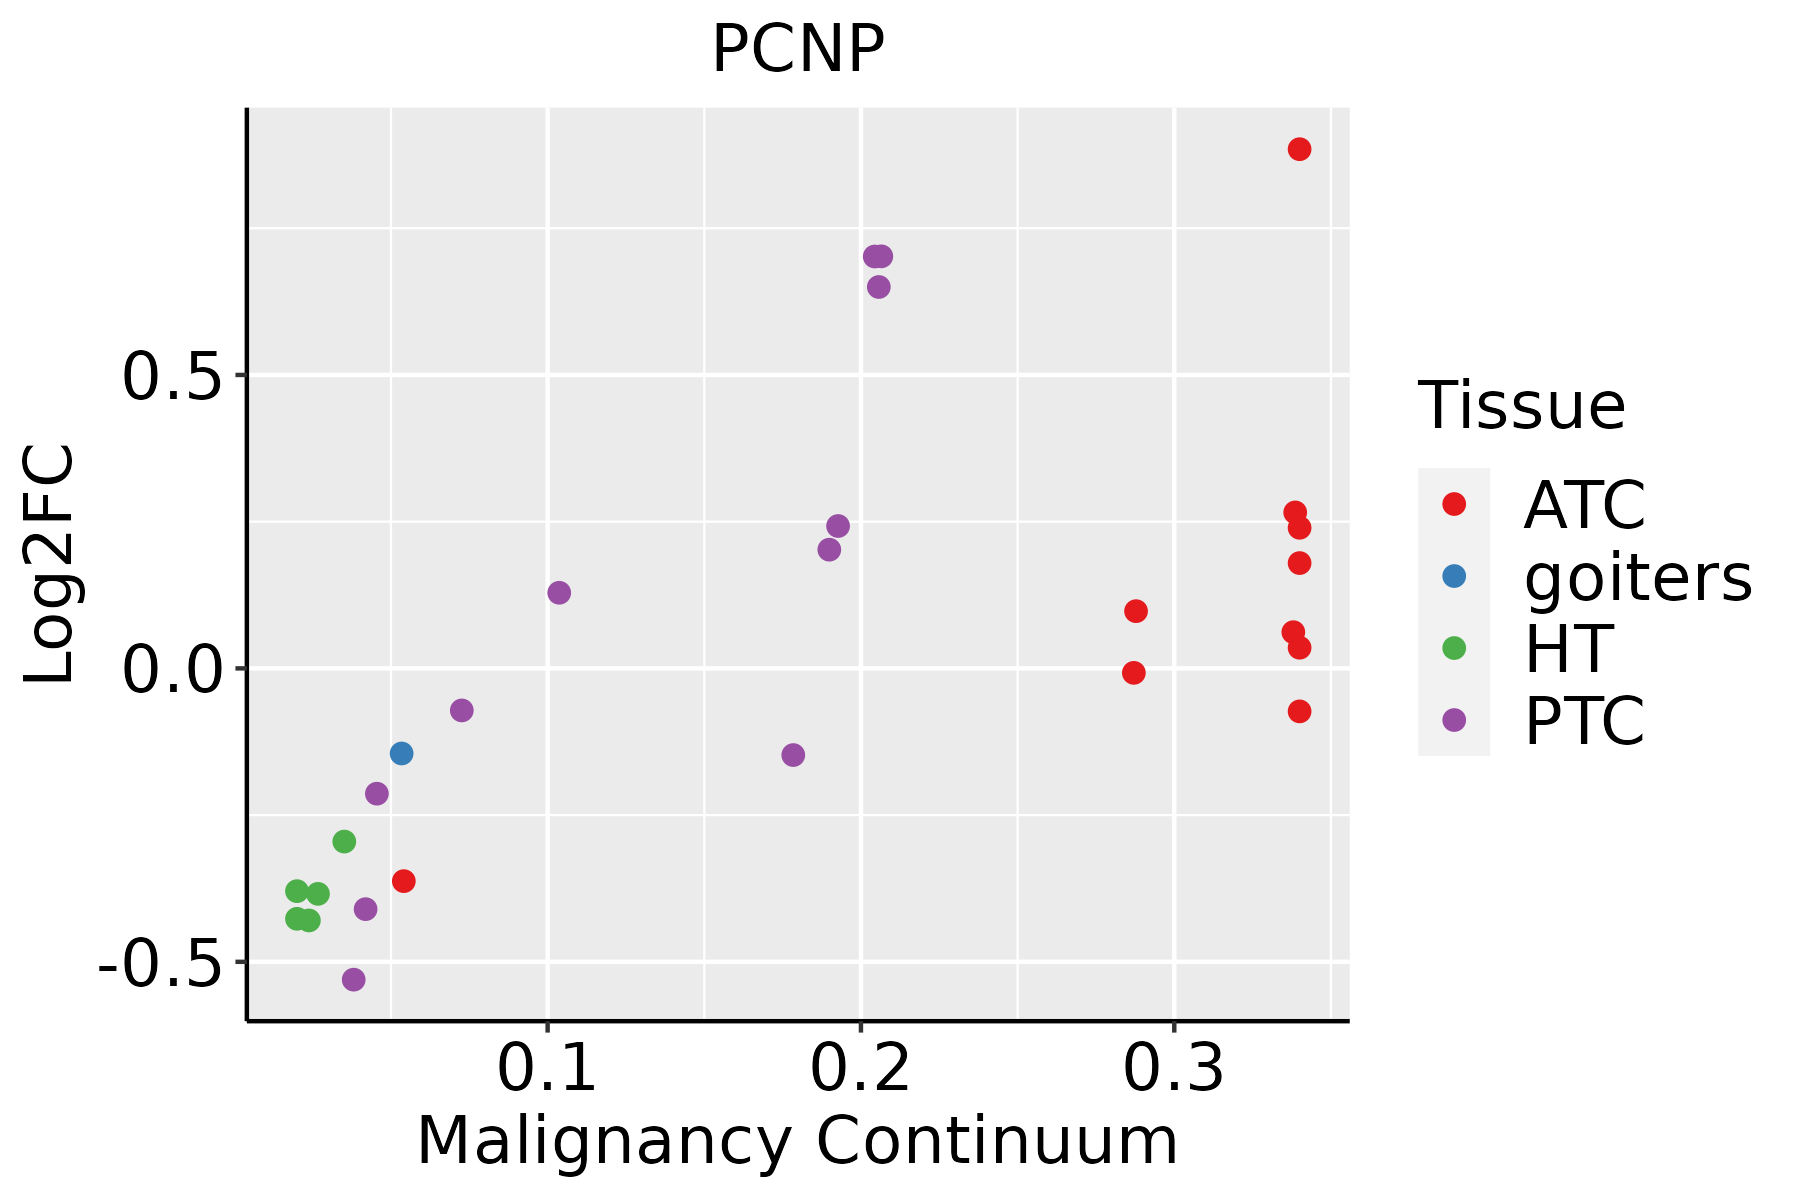 | ATC: Anaplastic thyroid cancer |
| HT: Hashimoto's thyroiditis |
| PTC: Papillary thyroid cancer |
| GO ID | Tissue | Disease Stage | Description | Gene Ratio | Bg Ratio | pvalue | p.adjust | Count |
| GO:00104989 | Breast | Precancer | proteasomal protein catabolic process | 58/1080 | 490/18723 | 1.54e-07 | 8.05e-06 | 58 |
| GO:00431619 | Breast | Precancer | proteasome-mediated ubiquitin-dependent protein catabolic process | 42/1080 | 412/18723 | 2.49e-04 | 3.72e-03 | 42 |
| GO:001049814 | Breast | IDC | proteasomal protein catabolic process | 75/1434 | 490/18723 | 5.59e-09 | 4.41e-07 | 75 |
| GO:004316114 | Breast | IDC | proteasome-mediated ubiquitin-dependent protein catabolic process | 57/1434 | 412/18723 | 9.55e-06 | 2.68e-04 | 57 |
| GO:001049824 | Breast | DCIS | proteasomal protein catabolic process | 75/1390 | 490/18723 | 1.44e-09 | 1.40e-07 | 75 |
| GO:004316124 | Breast | DCIS | proteasome-mediated ubiquitin-dependent protein catabolic process | 57/1390 | 412/18723 | 3.76e-06 | 1.16e-04 | 57 |
| GO:0010498 | Colorectum | AD | proteasomal protein catabolic process | 174/3918 | 490/18723 | 3.18e-14 | 7.66e-12 | 174 |
| GO:0043161 | Colorectum | AD | proteasome-mediated ubiquitin-dependent protein catabolic process | 141/3918 | 412/18723 | 1.77e-10 | 1.68e-08 | 141 |
| GO:00104981 | Colorectum | SER | proteasomal protein catabolic process | 132/2897 | 490/18723 | 3.08e-11 | 5.55e-09 | 132 |
| GO:00431611 | Colorectum | SER | proteasome-mediated ubiquitin-dependent protein catabolic process | 105/2897 | 412/18723 | 7.48e-08 | 4.70e-06 | 105 |
| GO:00104982 | Colorectum | MSS | proteasomal protein catabolic process | 157/3467 | 490/18723 | 2.39e-13 | 5.25e-11 | 157 |
| GO:00431612 | Colorectum | MSS | proteasome-mediated ubiquitin-dependent protein catabolic process | 127/3467 | 412/18723 | 7.70e-10 | 6.32e-08 | 127 |
| GO:00104983 | Colorectum | MSI-H | proteasomal protein catabolic process | 71/1319 | 490/18723 | 4.67e-09 | 6.03e-07 | 71 |
| GO:00431613 | Colorectum | MSI-H | proteasome-mediated ubiquitin-dependent protein catabolic process | 53/1319 | 412/18723 | 1.51e-05 | 6.62e-04 | 53 |
| GO:00431614 | Colorectum | FAP | proteasome-mediated ubiquitin-dependent protein catabolic process | 98/2622 | 412/18723 | 5.41e-08 | 4.20e-06 | 98 |
| GO:00104984 | Colorectum | FAP | proteasomal protein catabolic process | 110/2622 | 490/18723 | 2.12e-07 | 1.26e-05 | 110 |
| GO:001049816 | Endometrium | AEH | proteasomal protein catabolic process | 108/2100 | 490/18723 | 2.73e-12 | 4.67e-10 | 108 |
| GO:004316116 | Endometrium | AEH | proteasome-mediated ubiquitin-dependent protein catabolic process | 88/2100 | 412/18723 | 1.54e-09 | 1.36e-07 | 88 |
| GO:001049817 | Endometrium | EEC | proteasomal protein catabolic process | 112/2168 | 490/18723 | 6.99e-13 | 1.40e-10 | 112 |
| GO:004316117 | Endometrium | EEC | proteasome-mediated ubiquitin-dependent protein catabolic process | 92/2168 | 412/18723 | 3.01e-10 | 3.23e-08 | 92 |
| Hugo Symbol | Variant Class | Variant Classification | dbSNP RS | HGVSc | HGVSp | HGVSp Short | SWISSPROT | BIOTYPE | SIFT | PolyPhen | Tumor Sample Barcode | Tissue | Histology | Sex | Age | Stage | Therapy Types | Drugs | Outcome |
| PCNP | SNV | Missense_Mutation | | c.529N>C | p.Asp177His | p.D177H | Q8WW12 | protein_coding | deleterious_low_confidence(0) | benign(0.22) | TCGA-C5-A1BM-01 | Cervix | cervical & endocervical cancer | Female | >=65 | I/II | Unknown | Unknown | SD |
| PCNP | SNV | Missense_Mutation | | c.428C>T | p.Ala143Val | p.A143V | Q8WW12 | protein_coding | deleterious(0) | probably_damaging(0.986) | TCGA-G4-6302-01 | Colorectum | colon adenocarcinoma | Female | >=65 | I/II | Unknown | Unknown | SD |
| PCNP | SNV | Missense_Mutation | | c.534N>G | p.Asn178Lys | p.N178K | Q8WW12 | protein_coding | deleterious_low_confidence(0) | benign(0.017) | TCGA-AG-A002-01 | Colorectum | rectum adenocarcinoma | Male | <65 | I/II | Unknown | Unknown | SD |
| PCNP | SNV | Missense_Mutation | novel | c.220N>A | p.Ala74Thr | p.A74T | Q8WW12 | protein_coding | deleterious(0.01) | benign(0.088) | TCGA-AP-A059-01 | Endometrium | uterine corpus endometrioid carcinoma | Female | >=65 | I/II | Unknown | Unknown | SD |
| PCNP | SNV | Missense_Mutation | | c.259N>G | p.Ser87Ala | p.S87A | Q8WW12 | protein_coding | deleterious(0.04) | probably_damaging(0.98) | TCGA-B5-A11H-01 | Endometrium | uterine corpus endometrioid carcinoma | Female | >=65 | III/IV | Hormone Therapy | megace | SD |
| PCNP | SNV | Missense_Mutation | novel | c.283N>A | p.Pro95Thr | p.P95T | Q8WW12 | protein_coding | tolerated(0.12) | probably_damaging(0.976) | TCGA-B5-A1MR-01 | Endometrium | uterine corpus endometrioid carcinoma | Female | >=65 | III/IV | Unknown | Unknown | SD |
| PCNP | SNV | Missense_Mutation | | c.529G>T | p.Asp177Tyr | p.D177Y | Q8WW12 | protein_coding | deleterious_low_confidence(0) | benign(0.001) | TCGA-B5-A1MX-01 | Endometrium | uterine corpus endometrioid carcinoma | Female | <65 | I/II | Hormone Therapy | megace | SD |
| PCNP | insertion | Frame_Shift_Ins | novel | c.123_124insG | p.Glu43GlyfsTer8 | p.E43Gfs*8 | Q8WW12 | protein_coding | | | TCGA-DF-A2KY-01 | Endometrium | uterine corpus endometrioid carcinoma | Female | <65 | III/IV | Chemotherapy | carboplatin | SD |
| PCNP | SNV | Missense_Mutation | | c.379G>A | p.Glu127Lys | p.E127K | Q8WW12 | protein_coding | deleterious(0) | possibly_damaging(0.828) | TCGA-44-A47A-01 | Lung | lung adenocarcinoma | Female | >=65 | I/II | Unknown | Unknown | PD |
| PCNP | SNV | Missense_Mutation | | c.144C>A | p.Ser48Arg | p.S48R | Q8WW12 | protein_coding | tolerated_low_confidence(0.06) | probably_damaging(0.918) | TCGA-49-4507-01 | Lung | lung adenocarcinoma | Female | >=65 | III/IV | Chemotherapy | taxol | PD |


