
|
|||||
|
 | |
| |
| |
| |
| |
| |
|
Gene: PCNA |
Gene summary for PCNA |
| Gene information | Species | Human | Gene symbol | PCNA | Gene ID | 5111 |
| Gene name | proliferating cell nuclear antigen | |
| Gene Alias | ATLD2 | |
| Cytomap | 20p12.3 | |
| Gene Type | protein-coding | GO ID | GO:0000003 | UniProtAcc | P12004 |
Top |
Malignant transformation analysis |
| Identification of the aberrant gene expression in precancerous and cancerous lesions by comparing the gene expression of stem-like cells in diseased tissues with normal stem cells |
| Entrez ID | Symbol | Replicates | Species | Organ | Tissue | Adj P-value | Log2FC | Malignancy |
| 5111 | PCNA | GSM4909281 | Human | Breast | IDC | 1.92e-06 | 2.96e-01 | 0.21 |
| 5111 | PCNA | GSM4909282 | Human | Breast | IDC | 1.54e-24 | 5.82e-01 | -0.0288 |
| 5111 | PCNA | GSM4909285 | Human | Breast | IDC | 9.22e-23 | 5.19e-01 | 0.21 |
| 5111 | PCNA | GSM4909288 | Human | Breast | IDC | 1.92e-03 | 3.95e-01 | 0.0988 |
| 5111 | PCNA | GSM4909298 | Human | Breast | IDC | 5.22e-04 | 2.09e-01 | 0.1551 |
| 5111 | PCNA | GSM4909311 | Human | Breast | IDC | 6.26e-03 | -1.10e-01 | 0.1534 |
| 5111 | PCNA | GSM4909319 | Human | Breast | IDC | 2.74e-07 | -4.81e-02 | 0.1563 |
| 5111 | PCNA | brca2 | Human | Breast | Precancer | 4.18e-06 | 2.44e-01 | -0.024 |
| 5111 | PCNA | M2 | Human | Breast | IDC | 1.98e-09 | 6.53e-01 | 0.21 |
| 5111 | PCNA | NCCBC14 | Human | Breast | DCIS | 1.86e-03 | 1.63e-01 | 0.2021 |
| 5111 | PCNA | NCCBC5 | Human | Breast | DCIS | 4.22e-07 | 3.47e-01 | 0.2046 |
| 5111 | PCNA | P1 | Human | Breast | IDC | 1.40e-05 | 6.24e-03 | 0.1527 |
| 5111 | PCNA | P2 | Human | Breast | IDC | 1.56e-02 | 3.51e-01 | 0.21 |
| 5111 | PCNA | DCIS2 | Human | Breast | DCIS | 8.61e-24 | 2.79e-02 | 0.0085 |
| 5111 | PCNA | CA_HPV_3 | Human | Cervix | CC | 1.87e-04 | 2.66e-01 | 0.0414 |
| 5111 | PCNA | Tumor | Human | Cervix | CC | 1.91e-14 | 5.58e-01 | 0.1241 |
| 5111 | PCNA | sample3 | Human | Cervix | CC | 2.99e-20 | 5.95e-01 | 0.1387 |
| 5111 | PCNA | T3 | Human | Cervix | CC | 2.42e-25 | 6.42e-01 | 0.1389 |
| 5111 | PCNA | HTA11_1938_2000001011 | Human | Colorectum | AD | 5.14e-08 | 3.94e-01 | -0.0811 |
| 5111 | PCNA | HTA11_78_2000001011 | Human | Colorectum | AD | 2.49e-06 | 3.68e-01 | -0.1088 |
| Page: 1 2 3 4 5 6 7 8 |
| Tissue | Expression Dynamics | Abbreviation |
| Breast | 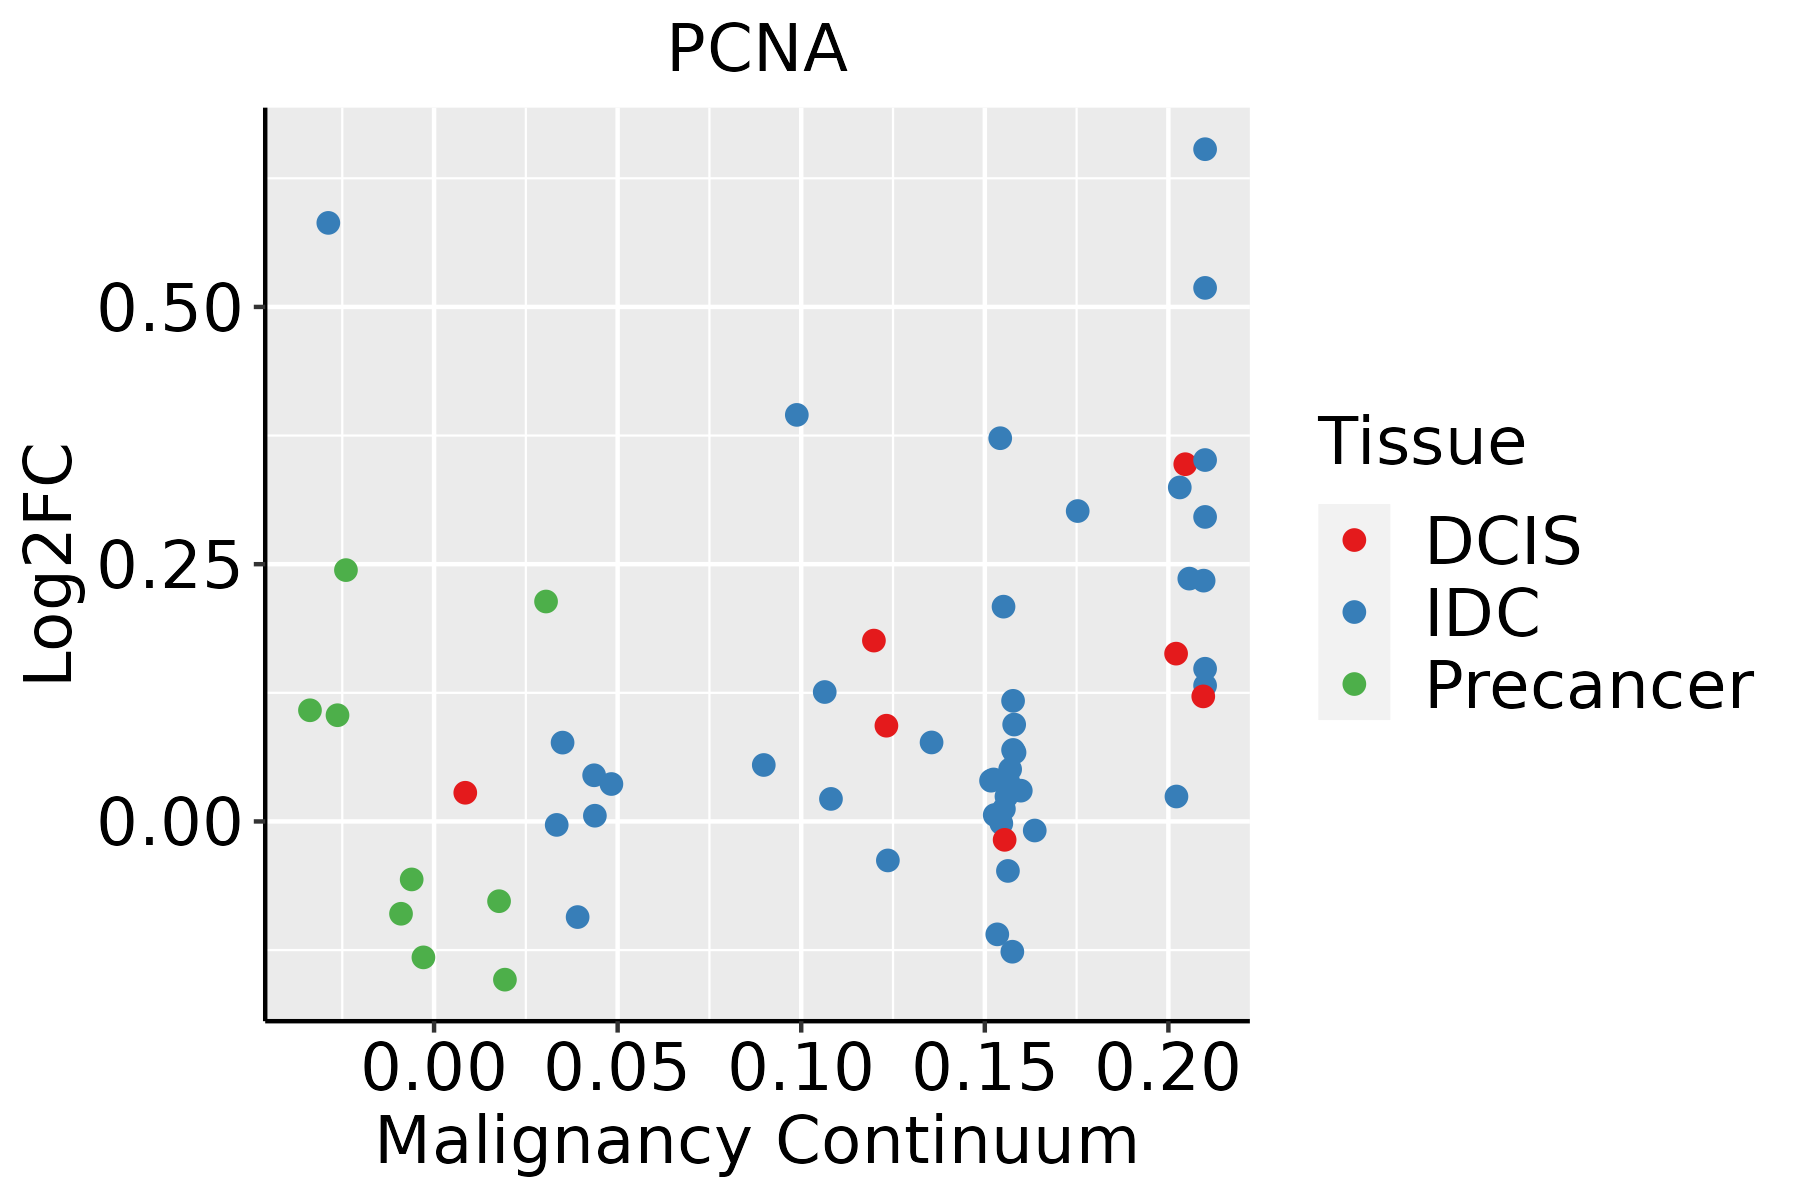 | IDC: Invasive ductal carcinoma |
| DCIS: Ductal carcinoma in situ | ||
| Precancer(BRCA1-mut): Precancerous lesion from BRCA1 mutation carriers | ||
| Cervix | 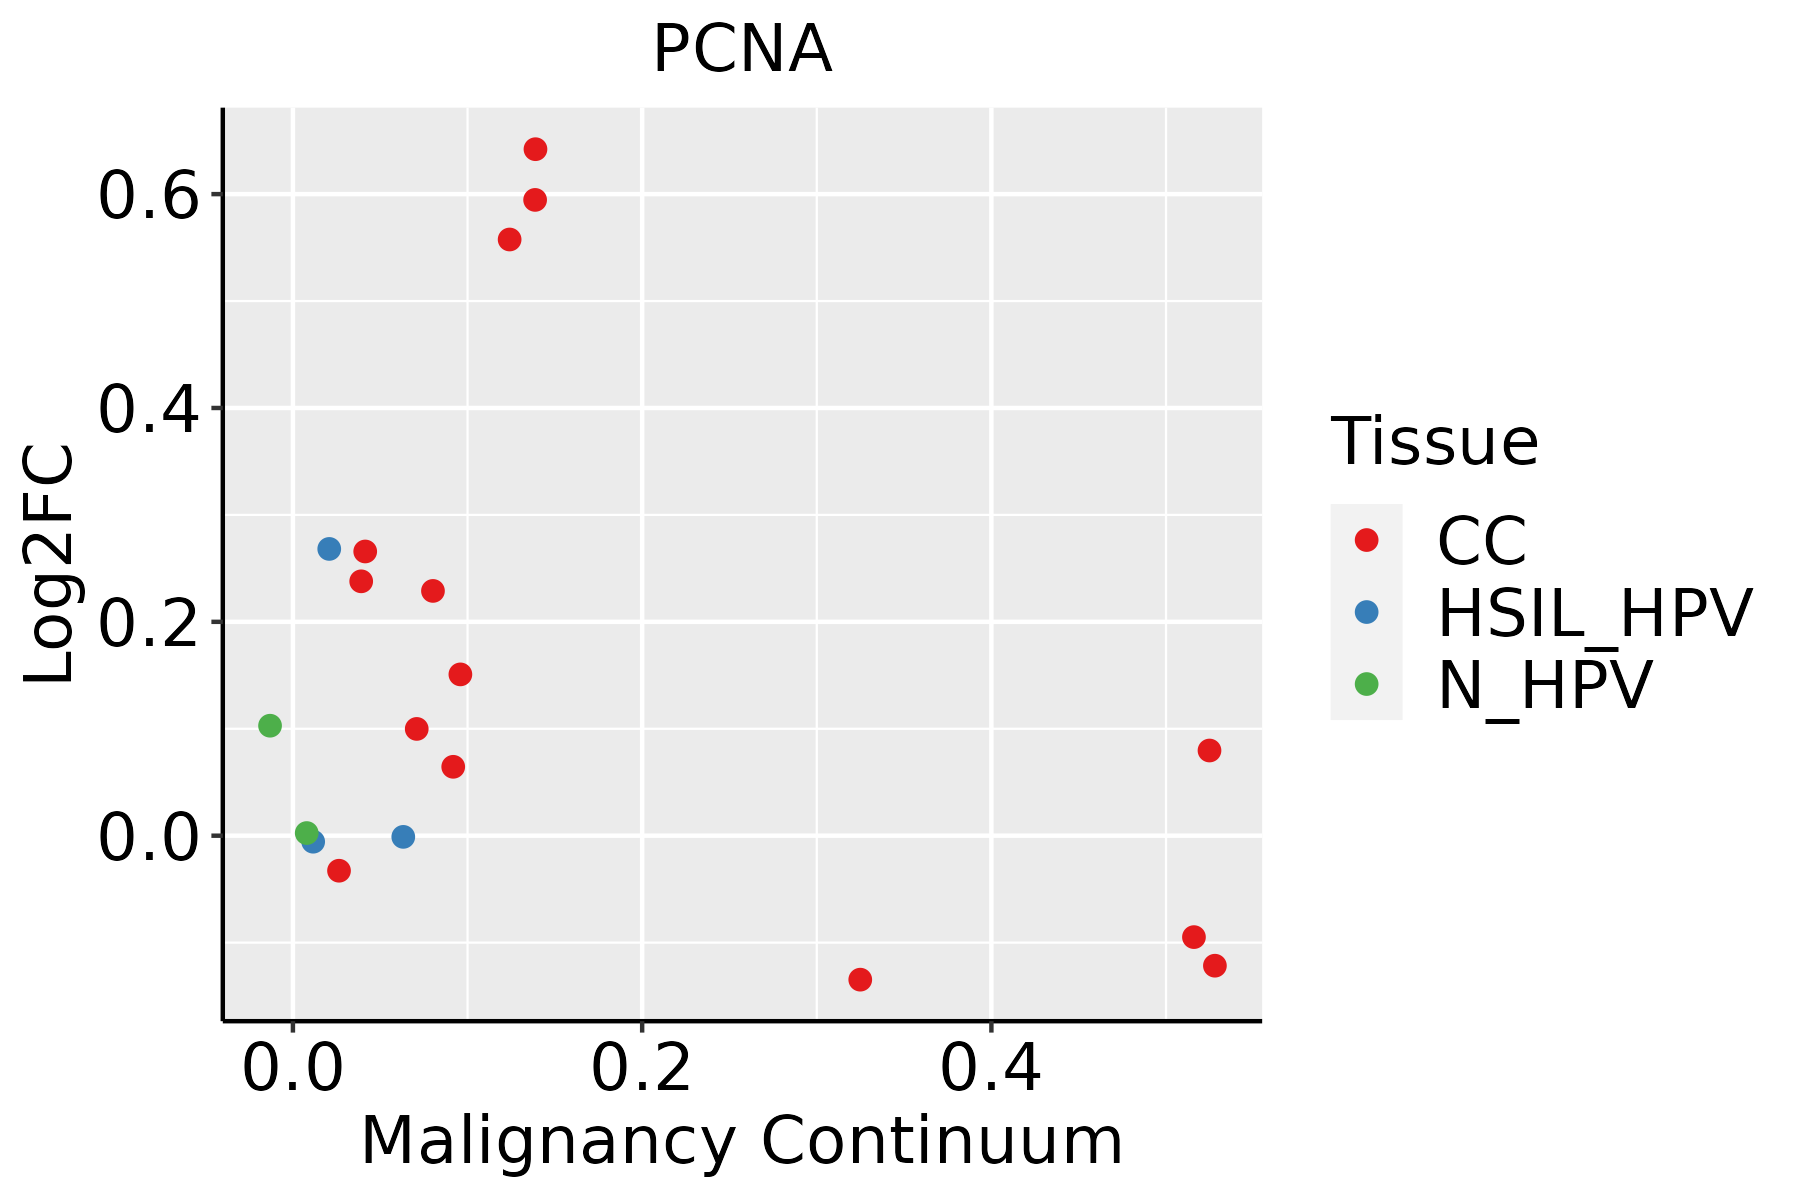 | CC: Cervix cancer |
| HSIL_HPV: HPV-infected high-grade squamous intraepithelial lesions | ||
| N_HPV: HPV-infected normal cervix | ||
| Colorectum (GSE201348) |  | FAP: Familial adenomatous polyposis |
| CRC: Colorectal cancer | ||
| Colorectum (HTA11) |  | AD: Adenomas |
| SER: Sessile serrated lesions | ||
| MSI-H: Microsatellite-high colorectal cancer | ||
| MSS: Microsatellite stable colorectal cancer | ||
| Esophagus | 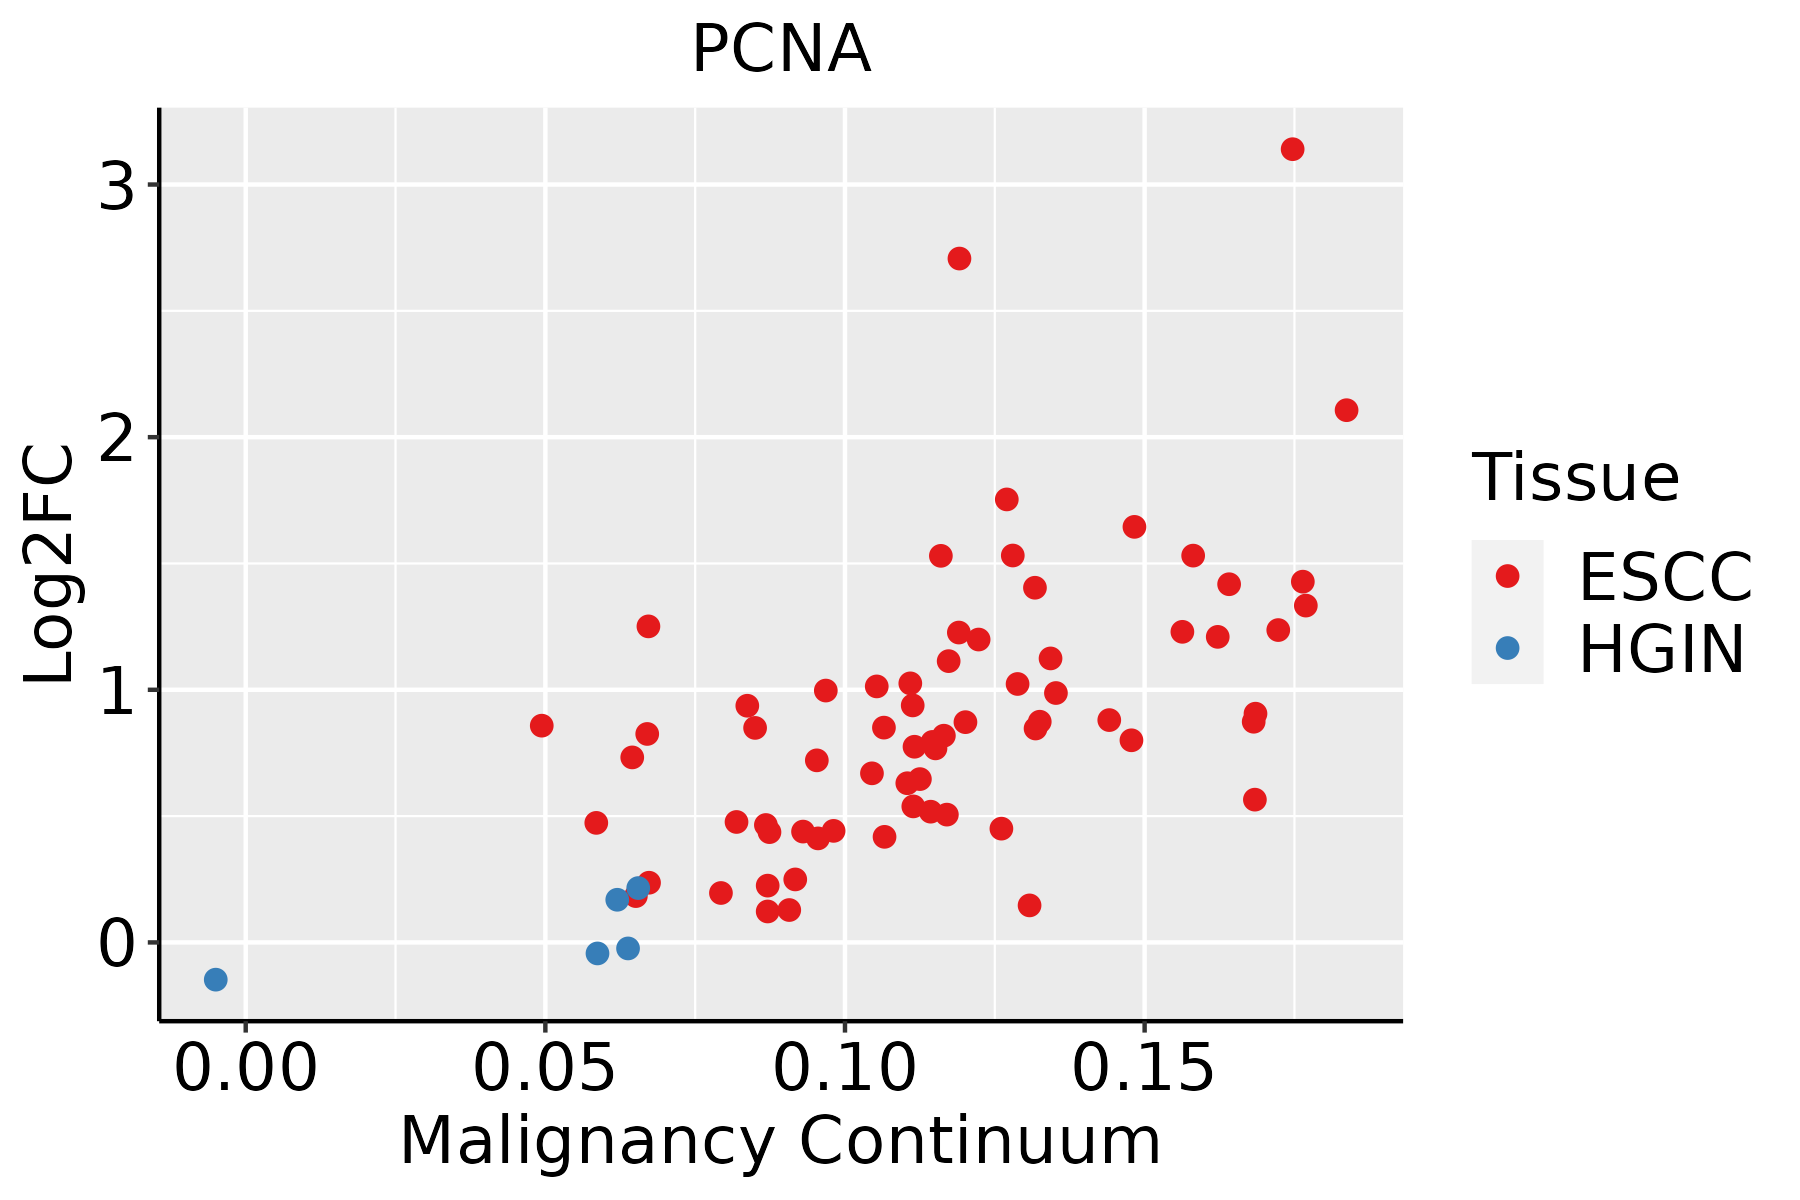 | ESCC: Esophageal squamous cell carcinoma |
| HGIN: High-grade intraepithelial neoplasias | ||
| LGIN: Low-grade intraepithelial neoplasias | ||
| Liver |  | HCC: Hepatocellular carcinoma |
| NAFLD: Non-alcoholic fatty liver disease | ||
| Oral Cavity | 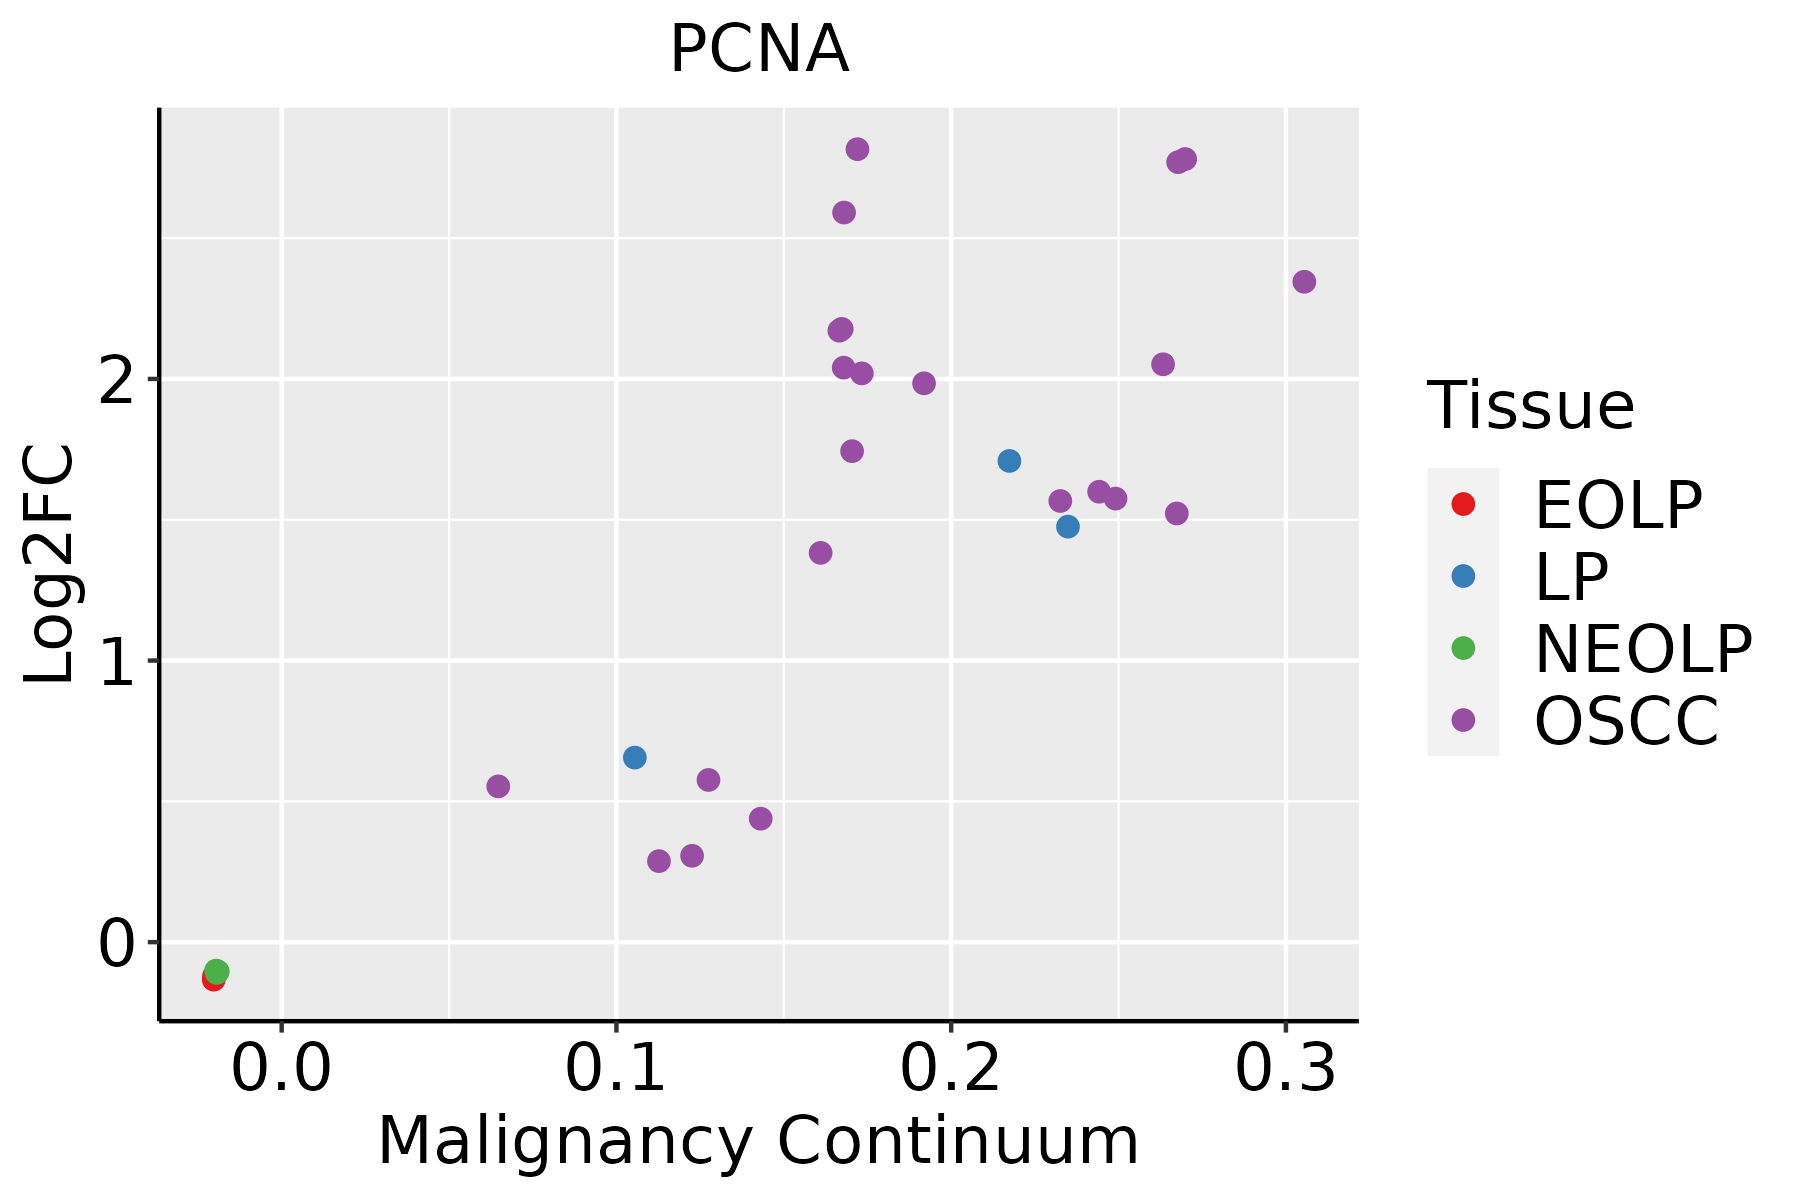 | EOLP: Erosive Oral lichen planus |
| LP: leukoplakia | ||
| NEOLP: Non-erosive oral lichen planus | ||
| OSCC: Oral squamous cell carcinoma | ||
| Skin |  | AK: Actinic keratosis |
| cSCC: Cutaneous squamous cell carcinoma | ||
| SCCIS:squamous cell carcinoma in situ | ||
| Thyroid | 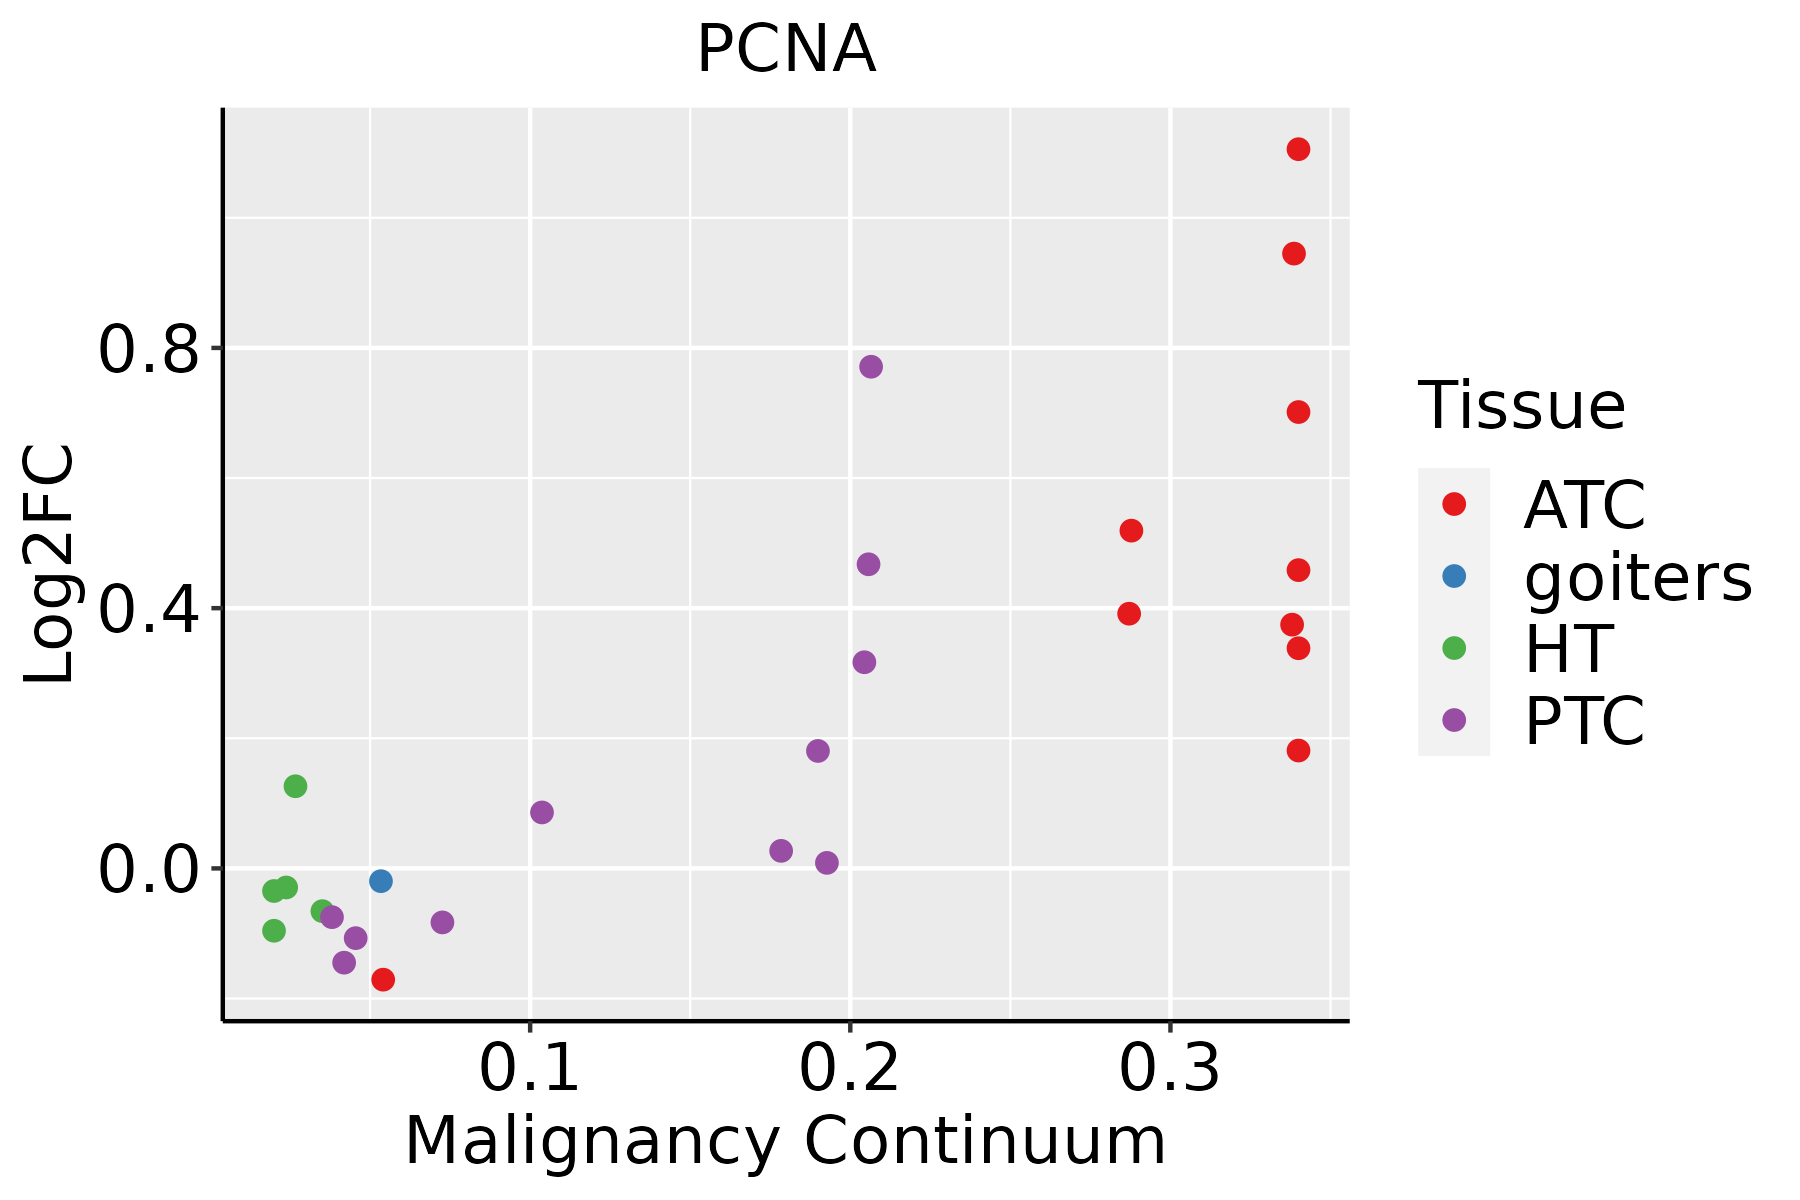 | ATC: Anaplastic thyroid cancer |
| HT: Hashimoto's thyroiditis | ||
| PTC: Papillary thyroid cancer |
| ∗log2FC in expression of this searched gene in stem-like cells from each diseased tissue sample relative to stem-like cells in normal samples in each tissue plotted against the malignancy continuum. Samples are colored based on if they are from different disease stage. |
Top |
Malignant transformation related pathway analysis |
| Find out the enriched GO biological processes and KEGG pathways involved in transition from healthy to precancer to cancer |
| Tissue | Disease Stage | Enriched GO biological Processes |
| Colorectum | AD |  |
| Colorectum | SER |  |
| Colorectum | MSS |  |
| Colorectum | MSI-H |  |
| Colorectum | FAP |  |
| ∗Top 15 enriched GO BP terms are showed in the bar plot of each disease state in each tissue. Each row represents a significant GO biological process which is colored according to the -log10(p.adjust). |
| Page: 1 2 3 4 5 6 7 8 9 |
| GO ID | Tissue | Disease Stage | Description | Gene Ratio | Bg Ratio | pvalue | p.adjust | Count |
| GO:00069799 | Breast | Precancer | response to oxidative stress | 70/1080 | 446/18723 | 1.59e-14 | 4.26e-12 | 70 |
| GO:00485459 | Breast | Precancer | response to steroid hormone | 53/1080 | 339/18723 | 3.07e-11 | 3.66e-09 | 53 |
| GO:00621979 | Breast | Precancer | cellular response to chemical stress | 51/1080 | 337/18723 | 2.40e-10 | 2.34e-08 | 51 |
| GO:00003029 | Breast | Precancer | response to reactive oxygen species | 38/1080 | 222/18723 | 1.47e-09 | 1.23e-07 | 38 |
| GO:00319608 | Breast | Precancer | response to corticosteroid | 30/1080 | 167/18723 | 2.50e-08 | 1.65e-06 | 30 |
| GO:00345999 | Breast | Precancer | cellular response to oxidative stress | 42/1080 | 288/18723 | 2.78e-08 | 1.79e-06 | 42 |
| GO:00425429 | Breast | Precancer | response to hydrogen peroxide | 26/1080 | 146/18723 | 2.52e-07 | 1.26e-05 | 26 |
| GO:00513848 | Breast | Precancer | response to glucocorticoid | 26/1080 | 148/18723 | 3.32e-07 | 1.57e-05 | 26 |
| GO:00100389 | Breast | Precancer | response to metal ion | 47/1080 | 373/18723 | 3.88e-07 | 1.79e-05 | 47 |
| GO:00487329 | Breast | Precancer | gland development | 49/1080 | 436/18723 | 6.11e-06 | 1.73e-04 | 49 |
| GO:00974216 | Breast | Precancer | liver regeneration | 10/1080 | 35/18723 | 1.91e-05 | 4.52e-04 | 10 |
| GO:00466868 | Breast | Precancer | response to cadmium ion | 14/1080 | 68/18723 | 2.74e-05 | 6.21e-04 | 14 |
| GO:00346149 | Breast | Precancer | cellular response to reactive oxygen species | 23/1080 | 155/18723 | 2.82e-05 | 6.31e-04 | 23 |
| GO:00007238 | Breast | Precancer | telomere maintenance | 20/1080 | 131/18723 | 6.10e-05 | 1.25e-03 | 20 |
| GO:00093148 | Breast | Precancer | response to radiation | 47/1080 | 456/18723 | 8.39e-05 | 1.62e-03 | 47 |
| GO:20005738 | Breast | Precancer | positive regulation of DNA biosynthetic process | 13/1080 | 66/18723 | 8.54e-05 | 1.63e-03 | 13 |
| GO:00712147 | Breast | Precancer | cellular response to abiotic stimulus | 37/1080 | 331/18723 | 9.12e-05 | 1.73e-03 | 37 |
| GO:01040047 | Breast | Precancer | cellular response to environmental stimulus | 37/1080 | 331/18723 | 9.12e-05 | 1.73e-03 | 37 |
| GO:00311004 | Breast | Precancer | animal organ regeneration | 14/1080 | 76/18723 | 9.92e-05 | 1.83e-03 | 14 |
| GO:00018898 | Breast | Precancer | liver development | 21/1080 | 147/18723 | 1.08e-04 | 1.96e-03 | 21 |
| Page: 1 2 3 4 5 6 7 8 9 10 11 12 13 14 15 16 17 18 19 20 21 22 23 24 25 26 27 28 29 30 31 32 33 |
| Pathway ID | Tissue | Disease Stage | Description | Gene Ratio | Bg Ratio | pvalue | p.adjust | qvalue | Count |
| hsa0453018 | Breast | Precancer | Tight junction | 31/684 | 169/8465 | 1.13e-05 | 1.26e-04 | 9.64e-05 | 31 |
| hsa0453019 | Breast | Precancer | Tight junction | 31/684 | 169/8465 | 1.13e-05 | 1.26e-04 | 9.64e-05 | 31 |
| hsa0453024 | Breast | IDC | Tight junction | 38/867 | 169/8465 | 2.07e-06 | 3.20e-05 | 2.39e-05 | 38 |
| hsa0453034 | Breast | IDC | Tight junction | 38/867 | 169/8465 | 2.07e-06 | 3.20e-05 | 2.39e-05 | 38 |
| hsa0453044 | Breast | DCIS | Tight junction | 37/846 | 169/8465 | 3.07e-06 | 4.20e-05 | 3.09e-05 | 37 |
| hsa0453054 | Breast | DCIS | Tight junction | 37/846 | 169/8465 | 3.07e-06 | 4.20e-05 | 3.09e-05 | 37 |
| hsa0453020 | Cervix | CC | Tight junction | 49/1267 | 169/8465 | 1.87e-06 | 1.78e-05 | 1.05e-05 | 49 |
| hsa041106 | Cervix | CC | Cell cycle | 36/1267 | 157/8465 | 4.94e-03 | 1.67e-02 | 9.86e-03 | 36 |
| hsa04530110 | Cervix | CC | Tight junction | 49/1267 | 169/8465 | 1.87e-06 | 1.78e-05 | 1.05e-05 | 49 |
| hsa0411013 | Cervix | CC | Cell cycle | 36/1267 | 157/8465 | 4.94e-03 | 1.67e-02 | 9.86e-03 | 36 |
| hsa04530 | Colorectum | AD | Tight junction | 76/2092 | 169/8465 | 5.49e-09 | 9.69e-08 | 6.18e-08 | 76 |
| hsa045301 | Colorectum | AD | Tight junction | 76/2092 | 169/8465 | 5.49e-09 | 9.69e-08 | 6.18e-08 | 76 |
| hsa045302 | Colorectum | SER | Tight junction | 59/1580 | 169/8465 | 3.24e-07 | 5.98e-06 | 4.34e-06 | 59 |
| hsa045303 | Colorectum | SER | Tight junction | 59/1580 | 169/8465 | 3.24e-07 | 5.98e-06 | 4.34e-06 | 59 |
| hsa045304 | Colorectum | MSS | Tight junction | 66/1875 | 169/8465 | 4.10e-07 | 6.25e-06 | 3.83e-06 | 66 |
| hsa05161 | Colorectum | MSS | Hepatitis B | 48/1875 | 162/8465 | 1.53e-02 | 4.93e-02 | 3.02e-02 | 48 |
| hsa045305 | Colorectum | MSS | Tight junction | 66/1875 | 169/8465 | 4.10e-07 | 6.25e-06 | 3.83e-06 | 66 |
| hsa051611 | Colorectum | MSS | Hepatitis B | 48/1875 | 162/8465 | 1.53e-02 | 4.93e-02 | 3.02e-02 | 48 |
| hsa045306 | Colorectum | MSI-H | Tight junction | 31/797 | 169/8465 | 2.08e-04 | 2.80e-03 | 2.35e-03 | 31 |
| hsa045307 | Colorectum | MSI-H | Tight junction | 31/797 | 169/8465 | 2.08e-04 | 2.80e-03 | 2.35e-03 | 31 |
| Page: 1 2 3 4 |
Top |
Cell-cell communication analysis |
| Identification of potential cell-cell interactions between two cell types and their ligand-receptor pairs for different disease states |
| Ligand | Receptor | LRpair | Pathway | Tissue | Disease Stage |
| Page: 1 |
Top |
Single-cell gene regulatory network inference analysis |
| Find out the significant the regulons (TFs) and the target genes of each regulon across cell types for different disease states |
| TF | Cell Type | Tissue | Disease Stage | Target Gene | RSS | Regulon Activity |
| ∗The dot plots of a searched regulon are shown for all cell subpopulations in each disease state of each tissue based on the regulon specific score inferred using pySCENIC and by calculating the average expression. |
| Page: 1 |
Top |
Somatic mutation of malignant transformation related genes |
| Annotation of somatic variants for genes involved in malignant transformation |
| Hugo Symbol | Variant Class | Variant Classification | dbSNP RS | HGVSc | HGVSp | HGVSp Short | SWISSPROT | BIOTYPE | SIFT | PolyPhen | Tumor Sample Barcode | Tissue | Histology | Sex | Age | Stage | Therapy Types | Drugs | Outcome |
| PCNA | SNV | Missense_Mutation | novel | c.7N>C | p.Glu3Gln | p.E3Q | P12004 | protein_coding | deleterious(0.01) | probably_damaging(0.993) | TCGA-5L-AAT1-01 | Breast | breast invasive carcinoma | Female | <65 | III/IV | Hormone Therapy | letrozol | SD |
| PCNA | SNV | Missense_Mutation | novel | c.199N>C | p.Ala67Pro | p.A67P | P12004 | protein_coding | tolerated(0.21) | benign(0.432) | TCGA-VS-A953-01 | Cervix | cervical & endocervical cancer | Female | <65 | I/II | Unknown | Unknown | PD |
| PCNA | SNV | Missense_Mutation | c.581N>T | p.Ala194Val | p.A194V | P12004 | protein_coding | tolerated(0.1) | benign(0.344) | TCGA-AA-3688-01 | Colorectum | colon adenocarcinoma | Male | >=65 | III/IV | Unknown | Unknown | SD | |
| PCNA | SNV | Missense_Mutation | c.256G>T | p.Asp86Tyr | p.D86Y | P12004 | protein_coding | deleterious(0) | probably_damaging(1) | TCGA-AA-A010-01 | Colorectum | colon adenocarcinoma | Female | <65 | I/II | Chemotherapy | folinic | CR | |
| PCNA | SNV | Missense_Mutation | c.208G>A | p.Val70Met | p.V70M | P12004 | protein_coding | tolerated(0.84) | benign(0.053) | TCGA-NH-A5IV-01 | Colorectum | colon adenocarcinoma | Female | >=65 | I/II | Unknown | Unknown | SD | |
| PCNA | SNV | Missense_Mutation | c.506N>G | p.Phe169Cys | p.F169C | P12004 | protein_coding | deleterious(0) | probably_damaging(0.998) | TCGA-AG-3999-01 | Colorectum | rectum adenocarcinoma | Female | <65 | III/IV | Unspecific | PD | ||
| PCNA | SNV | Missense_Mutation | c.731T>G | p.Met244Arg | p.M244R | P12004 | protein_coding | tolerated(0.21) | possibly_damaging(0.881) | TCGA-F5-6814-01 | Colorectum | rectum adenocarcinoma | Male | <65 | I/II | Unknown | Unknown | SD | |
| PCNA | SNV | Missense_Mutation | novel | c.385N>T | p.Pro129Ser | p.P129S | P12004 | protein_coding | deleterious(0) | possibly_damaging(0.541) | TCGA-A5-A0G2-01 | Endometrium | uterine corpus endometrioid carcinoma | Female | <65 | III/IV | Unknown | Unknown | SD |
| PCNA | SNV | Missense_Mutation | novel | c.536A>G | p.Asn179Ser | p.N179S | P12004 | protein_coding | tolerated(0.6) | benign(0.015) | TCGA-AJ-A5DW-01 | Endometrium | uterine corpus endometrioid carcinoma | Female | <65 | I/II | Unknown | Unknown | SD |
| PCNA | SNV | Missense_Mutation | c.109C>A | p.Leu37Met | p.L37M | P12004 | protein_coding | deleterious(0.05) | probably_damaging(0.936) | TCGA-AP-A059-01 | Endometrium | uterine corpus endometrioid carcinoma | Female | >=65 | I/II | Unknown | Unknown | SD |
| Page: 1 2 3 |
Top |
Related drugs of malignant transformation related genes |
| Identification of chemicals and drugs interact with genes involved in malignant transfromation |
| (DGIdb 4.0) |
| Entrez ID | Symbol | Category | Interaction Types | Drug Claim Name | Drug Name | PMIDs |
| 5111 | PCNA | NA | ATX-101 | DEOXYCHOLIC ACID | ||
| 5111 | PCNA | NA | VIT-100 | |||
| 5111 | PCNA | NA | CAPSAICIN | CAPSAICIN | 9435579 | |
| 5111 | PCNA | NA | PENTOXIFYLLINE | PENTOXIFYLLINE | 10707869 | |
| 5111 | PCNA | NA | SUNSCREEN | 17021352 |
| Page: 1 |

Copyright 2023-Present -The University of Texas Health Science Center at Houston |