
|
|||||
|
 | |
| |
| |
| |
| |
| |
|
Gene: PCMTD1 |
Gene summary for PCMTD1 |
| Gene information | Species | Human | Gene symbol | PCMTD1 | Gene ID | 115294 |
| Gene name | protein-L-isoaspartate (D-aspartate) O-methyltransferase domain containing 1 | |
| Gene Alias | PCMTD1 | |
| Cytomap | 8q11.23 | |
| Gene Type | protein-coding | GO ID | GO:0006464 | UniProtAcc | F5H1M8 |
Top |
Malignant transformation analysis |
| Identification of the aberrant gene expression in precancerous and cancerous lesions by comparing the gene expression of stem-like cells in diseased tissues with normal stem cells |
| Entrez ID | Symbol | Replicates | Species | Organ | Tissue | Adj P-value | Log2FC | Malignancy |
| 115294 | PCMTD1 | LZE2T | Human | Esophagus | ESCC | 5.14e-04 | 7.67e-01 | 0.082 |
| 115294 | PCMTD1 | LZE4T | Human | Esophagus | ESCC | 7.96e-25 | 7.25e-01 | 0.0811 |
| 115294 | PCMTD1 | LZE5T | Human | Esophagus | ESCC | 3.86e-06 | 5.79e-01 | 0.0514 |
| 115294 | PCMTD1 | LZE7T | Human | Esophagus | ESCC | 2.78e-06 | 1.02e-01 | 0.0667 |
| 115294 | PCMTD1 | LZE8T | Human | Esophagus | ESCC | 1.02e-13 | 2.90e-01 | 0.067 |
| 115294 | PCMTD1 | LZE20T | Human | Esophagus | ESCC | 3.49e-13 | 4.75e-01 | 0.0662 |
| 115294 | PCMTD1 | LZE24T | Human | Esophagus | ESCC | 2.89e-28 | 8.48e-01 | 0.0596 |
| 115294 | PCMTD1 | P1T-E | Human | Esophagus | ESCC | 8.01e-07 | 4.43e-01 | 0.0875 |
| 115294 | PCMTD1 | P2T-E | Human | Esophagus | ESCC | 5.47e-47 | 9.34e-01 | 0.1177 |
| 115294 | PCMTD1 | P4T-E | Human | Esophagus | ESCC | 1.57e-31 | 6.84e-01 | 0.1323 |
| 115294 | PCMTD1 | P5T-E | Human | Esophagus | ESCC | 1.32e-05 | 8.04e-02 | 0.1327 |
| 115294 | PCMTD1 | P8T-E | Human | Esophagus | ESCC | 4.68e-35 | 6.37e-01 | 0.0889 |
| 115294 | PCMTD1 | P9T-E | Human | Esophagus | ESCC | 2.87e-13 | 4.57e-01 | 0.1131 |
| 115294 | PCMTD1 | P10T-E | Human | Esophagus | ESCC | 1.84e-44 | 7.69e-01 | 0.116 |
| 115294 | PCMTD1 | P11T-E | Human | Esophagus | ESCC | 4.64e-16 | 4.53e-01 | 0.1426 |
| 115294 | PCMTD1 | P12T-E | Human | Esophagus | ESCC | 1.95e-33 | 7.32e-01 | 0.1122 |
| 115294 | PCMTD1 | P15T-E | Human | Esophagus | ESCC | 3.31e-33 | 7.39e-01 | 0.1149 |
| 115294 | PCMTD1 | P16T-E | Human | Esophagus | ESCC | 3.86e-74 | 1.59e+00 | 0.1153 |
| 115294 | PCMTD1 | P17T-E | Human | Esophagus | ESCC | 4.90e-08 | 5.16e-01 | 0.1278 |
| 115294 | PCMTD1 | P19T-E | Human | Esophagus | ESCC | 6.00e-05 | 4.99e-01 | 0.1662 |
| Page: 1 2 3 4 5 6 7 |
| Tissue | Expression Dynamics | Abbreviation |
| Esophagus | 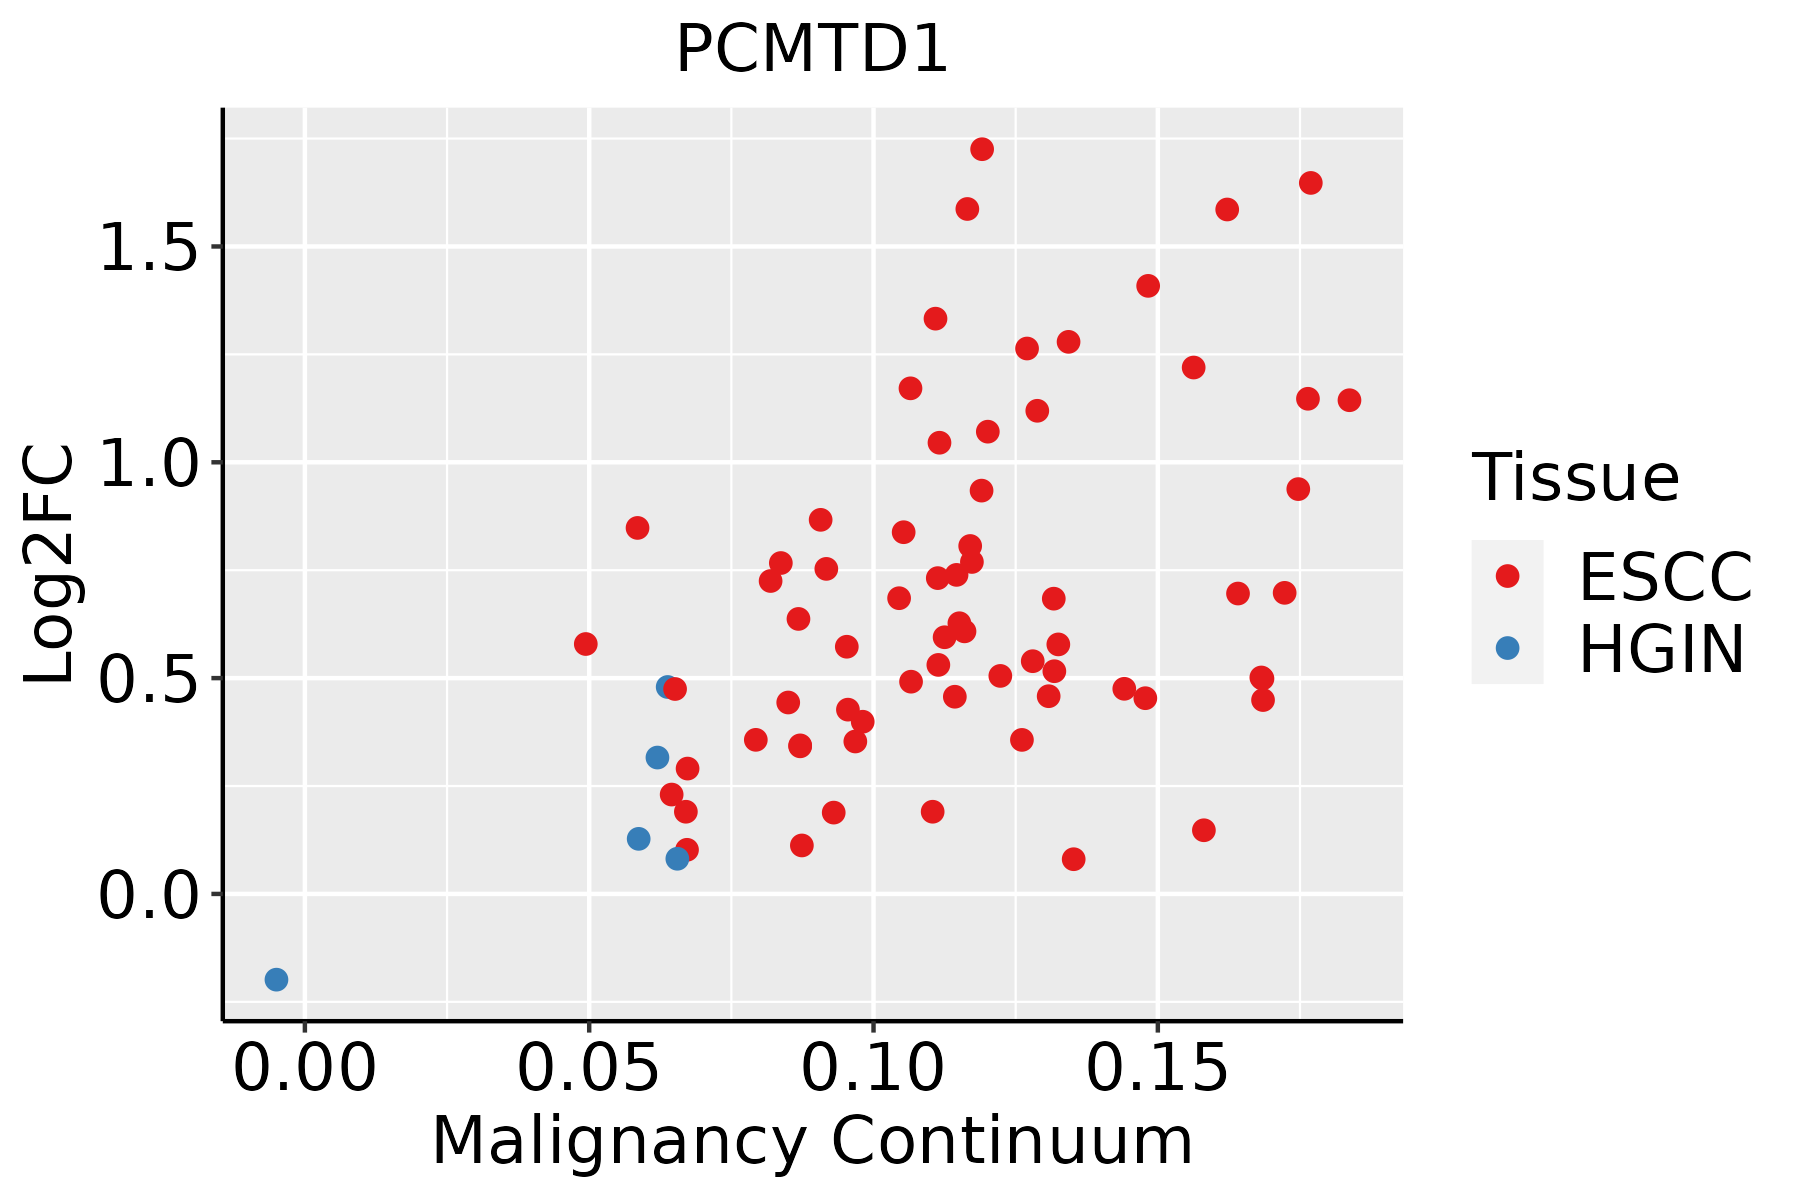 | ESCC: Esophageal squamous cell carcinoma |
| HGIN: High-grade intraepithelial neoplasias | ||
| LGIN: Low-grade intraepithelial neoplasias | ||
| Liver | 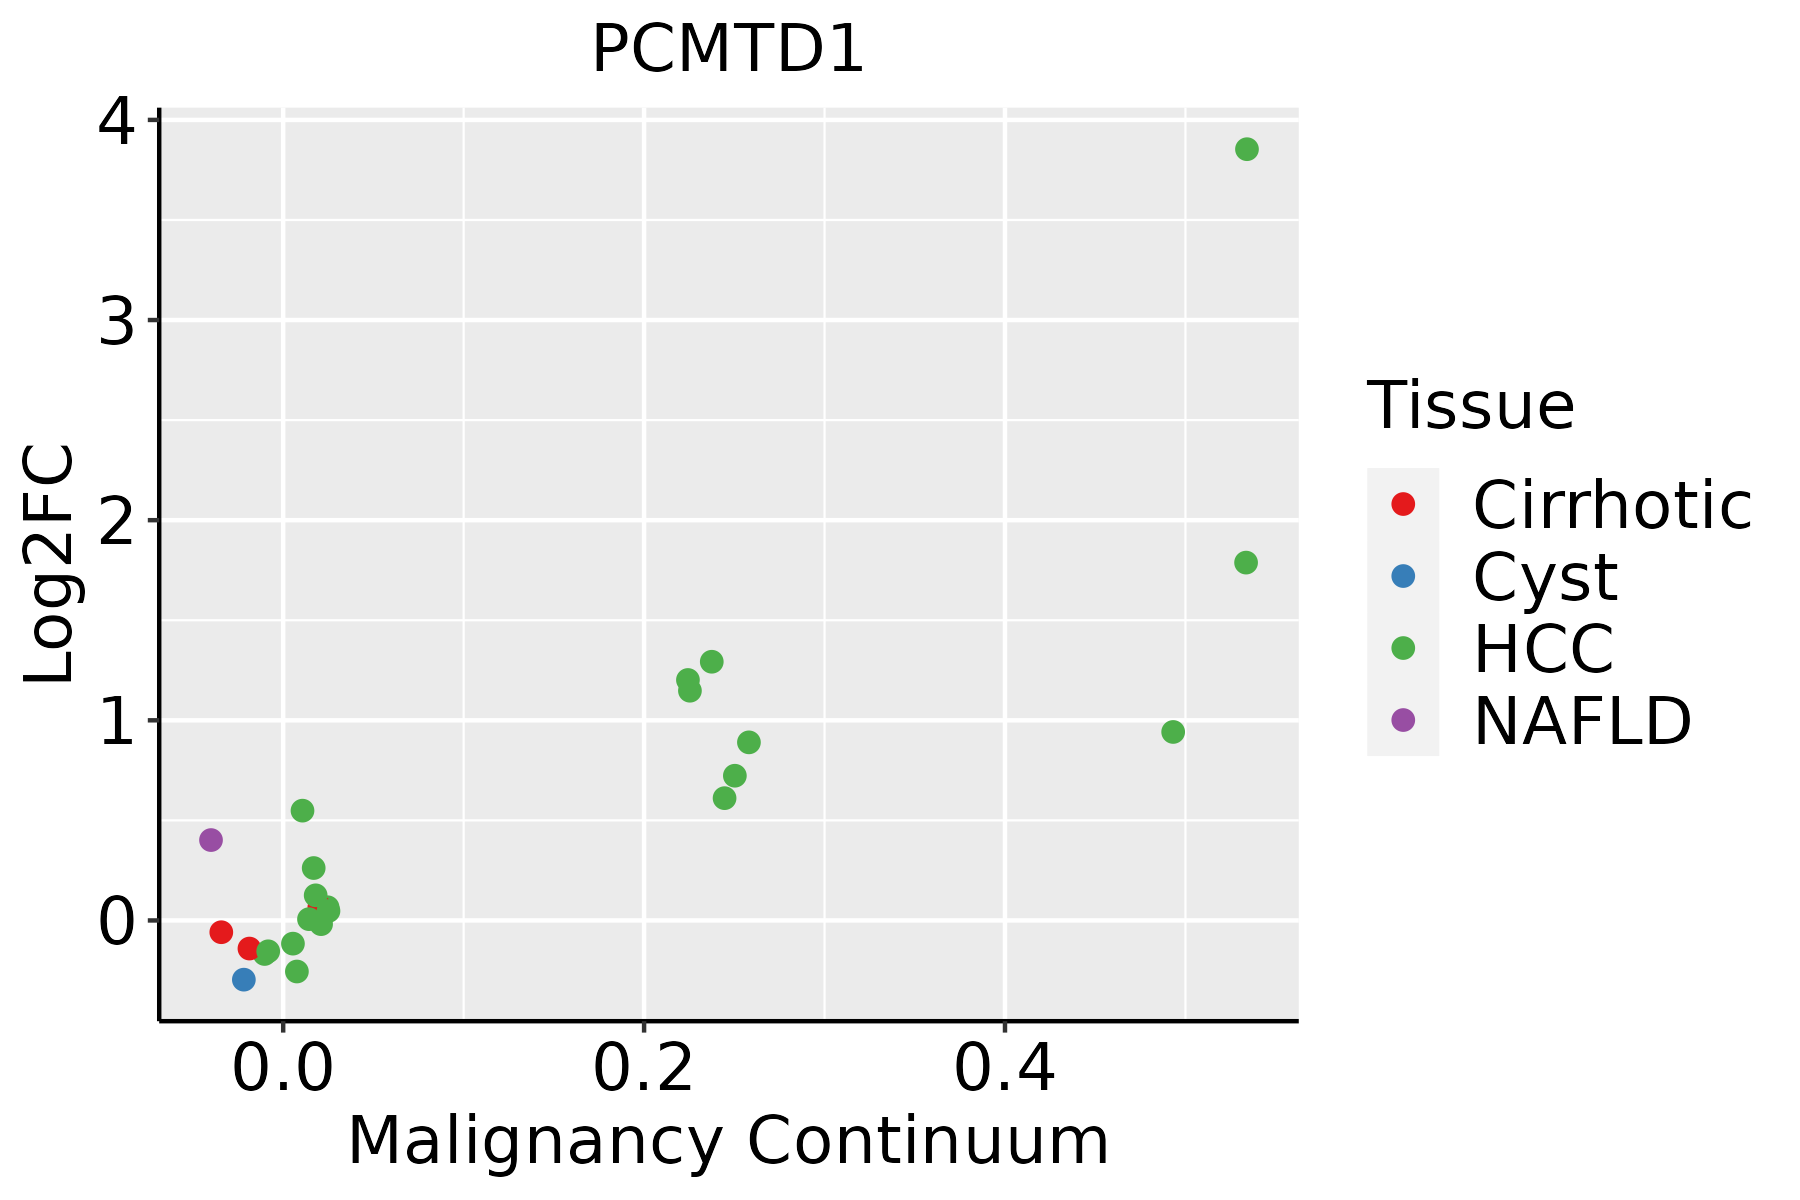 | HCC: Hepatocellular carcinoma |
| NAFLD: Non-alcoholic fatty liver disease | ||
| Lung | 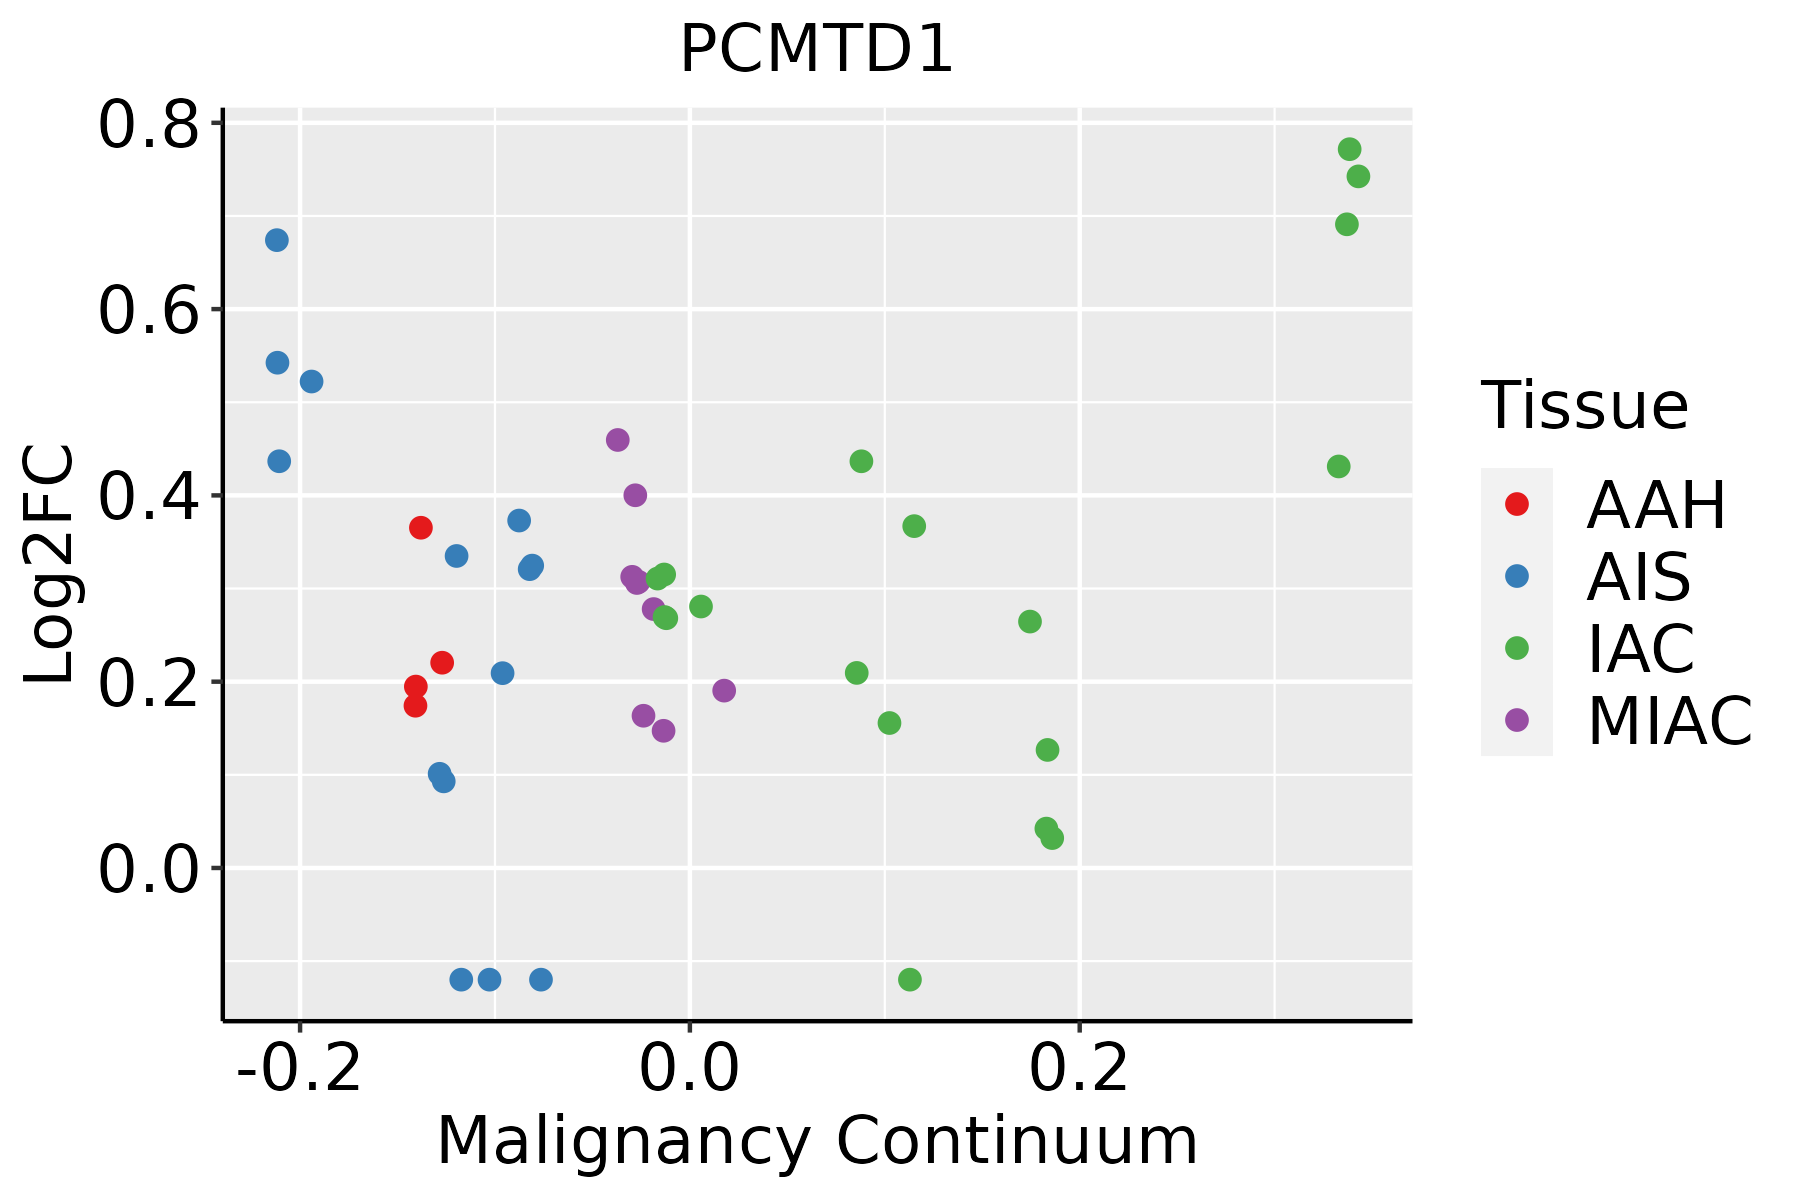 | AAH: Atypical adenomatous hyperplasia |
| AIS: Adenocarcinoma in situ | ||
| IAC: Invasive lung adenocarcinoma | ||
| MIA: Minimally invasive adenocarcinoma | ||
| Oral Cavity |  | EOLP: Erosive Oral lichen planus |
| LP: leukoplakia | ||
| NEOLP: Non-erosive oral lichen planus | ||
| OSCC: Oral squamous cell carcinoma | ||
| Prostate | 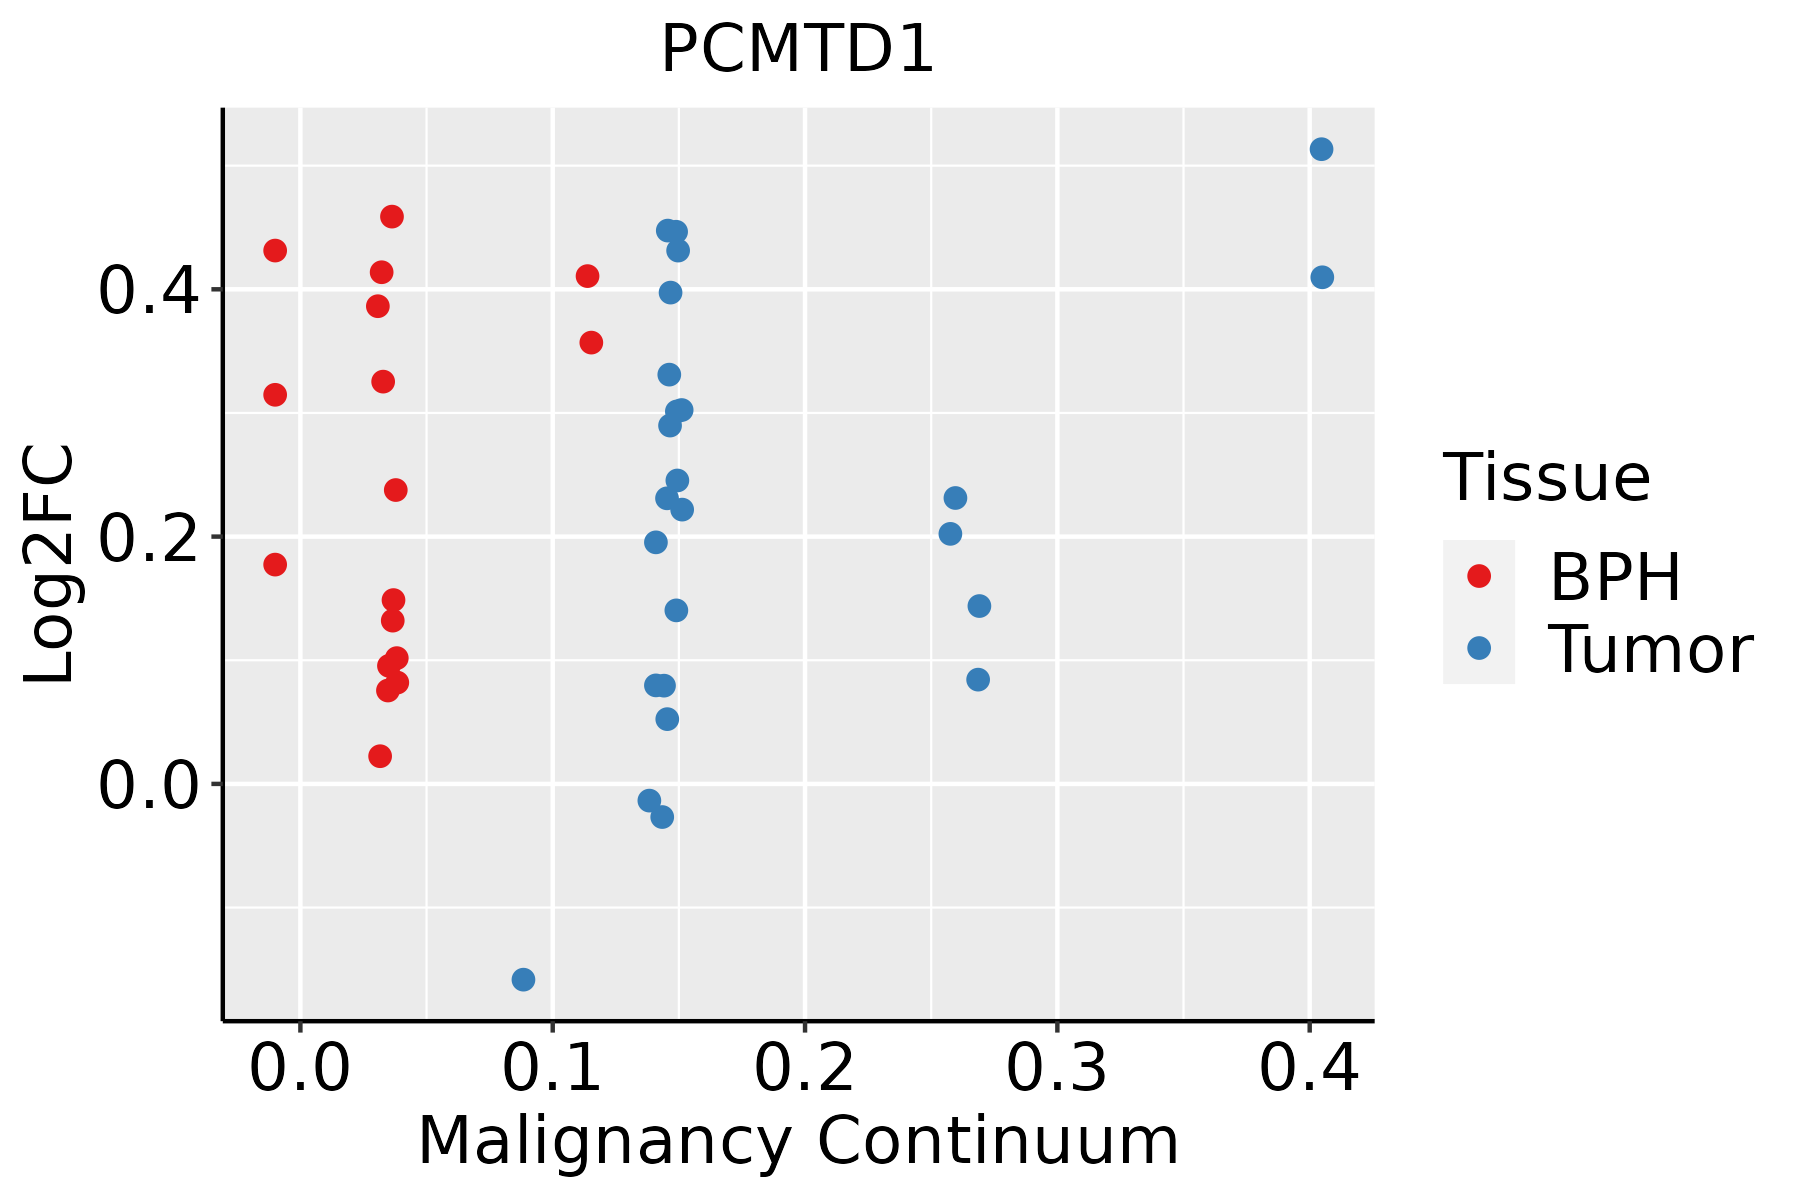 | BPH: Benign Prostatic Hyperplasia |
| Skin | 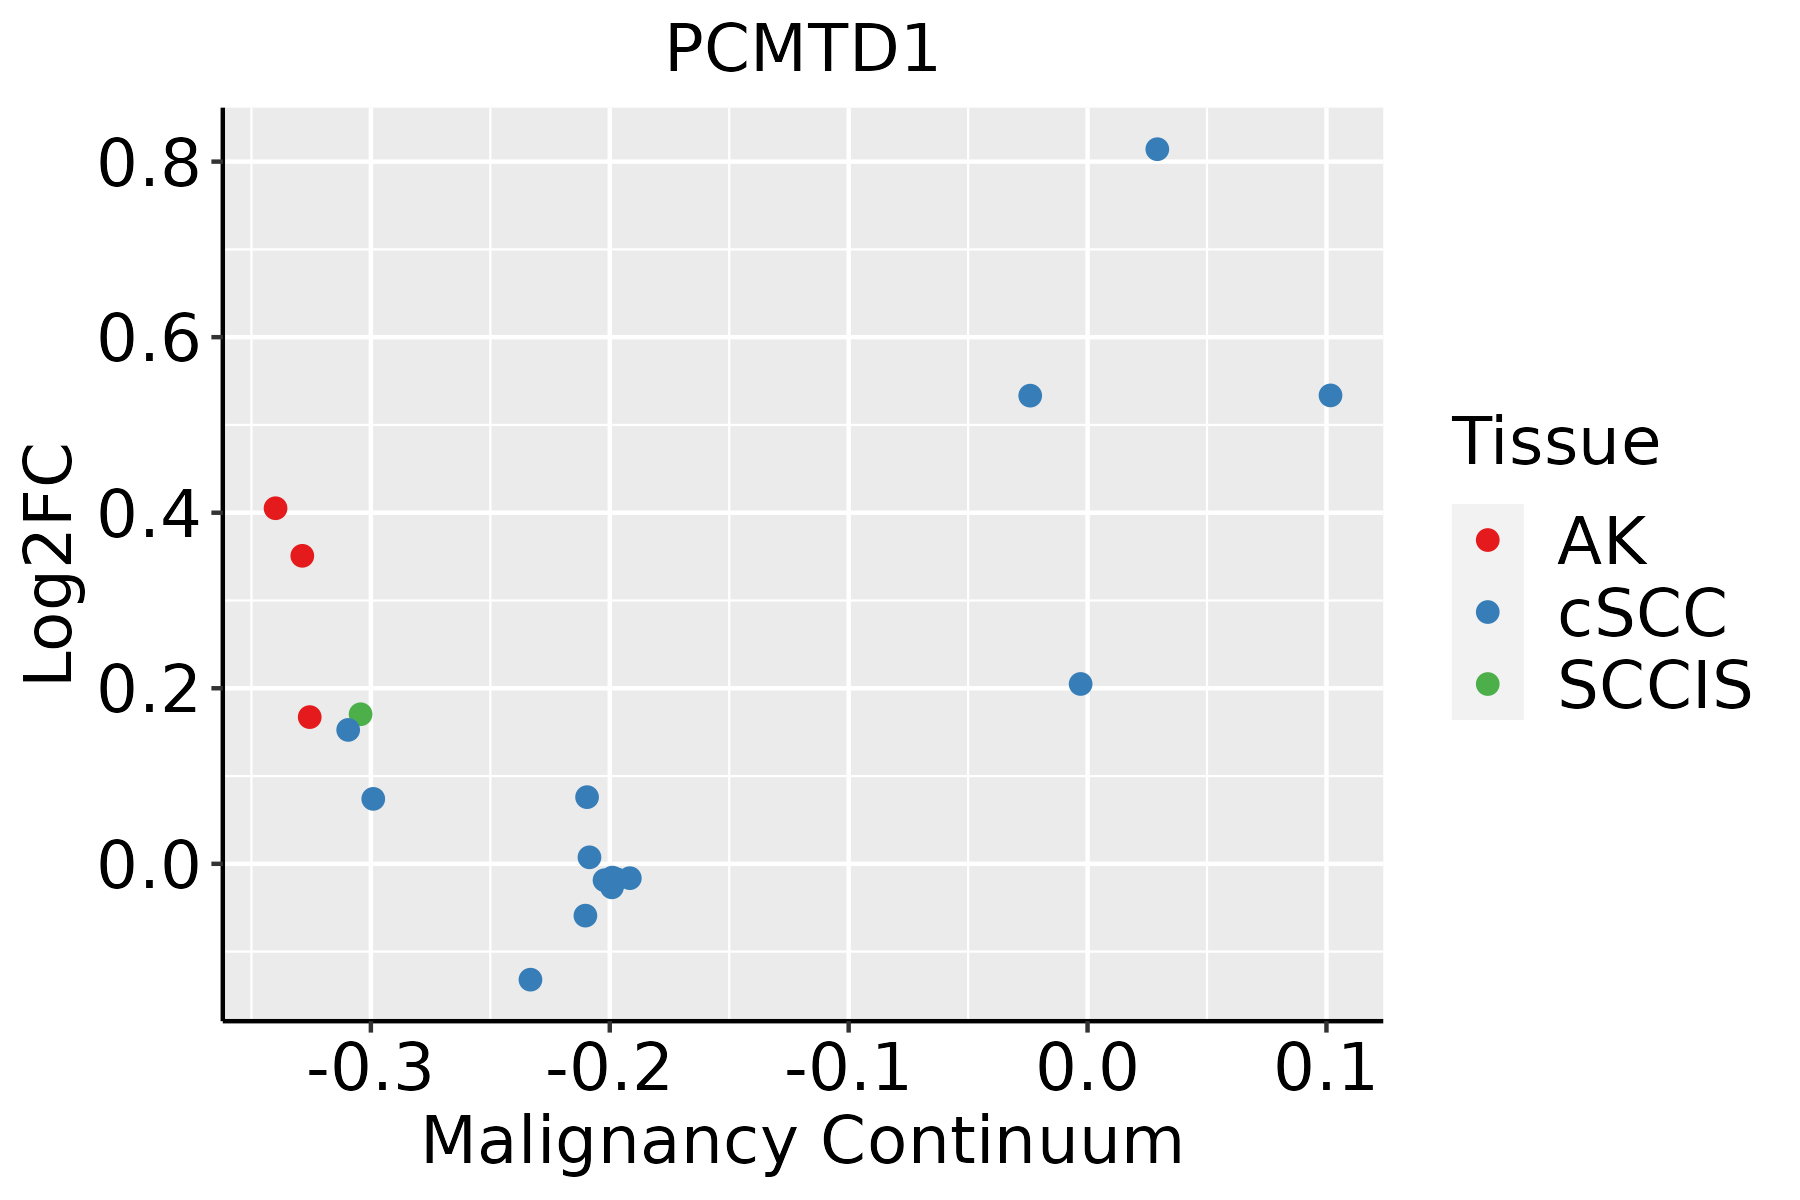 | AK: Actinic keratosis |
| cSCC: Cutaneous squamous cell carcinoma | ||
| SCCIS:squamous cell carcinoma in situ | ||
| Thyroid | 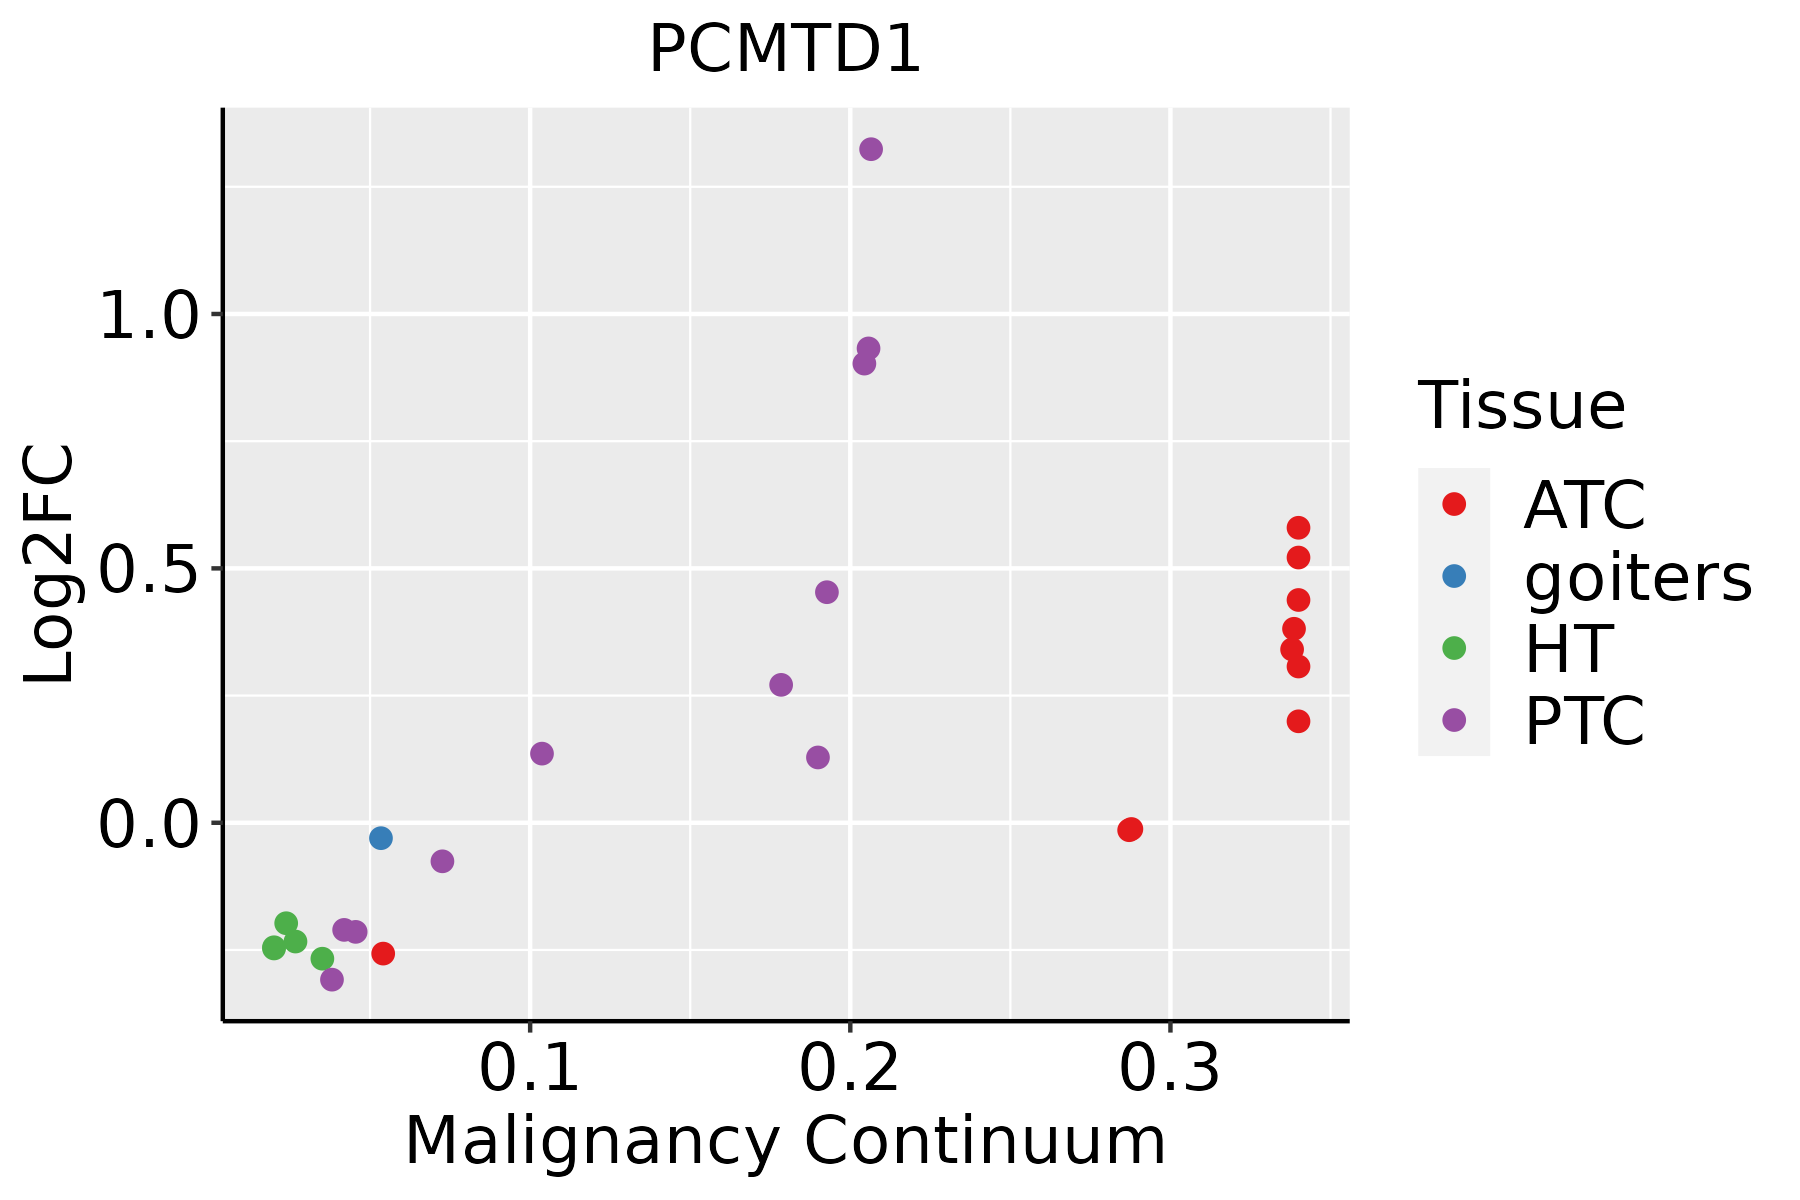 | ATC: Anaplastic thyroid cancer |
| HT: Hashimoto's thyroiditis | ||
| PTC: Papillary thyroid cancer |
| ∗log2FC in expression of this searched gene in stem-like cells from each diseased tissue sample relative to stem-like cells in normal samples in each tissue plotted against the malignancy continuum. Samples are colored based on if they are from different disease stage. |
Top |
Malignant transformation related pathway analysis |
| Find out the enriched GO biological processes and KEGG pathways involved in transition from healthy to precancer to cancer |
| Tissue | Disease Stage | Enriched GO biological Processes |
| Colorectum | AD |  |
| Colorectum | SER |  |
| Colorectum | MSS |  |
| Colorectum | MSI-H |  |
| Colorectum | FAP |  |
| ∗Top 15 enriched GO BP terms are showed in the bar plot of each disease state in each tissue. Each row represents a significant GO biological process which is colored according to the -log10(p.adjust). |
| Page: 1 2 3 4 5 6 7 8 9 |
| GO ID | Tissue | Disease Stage | Description | Gene Ratio | Bg Ratio | pvalue | p.adjust | Count |
| GO:00434143 | Esophagus | ESCC | macromolecule methylation | 199/8552 | 316/18723 | 3.44e-10 | 9.57e-09 | 199 |
| GO:00322592 | Esophagus | ESCC | methylation | 222/8552 | 364/18723 | 2.26e-09 | 5.09e-08 | 222 |
| GO:000647914 | Esophagus | ESCC | protein methylation | 115/8552 | 181/18723 | 9.07e-07 | 1.16e-05 | 115 |
| GO:000821314 | Esophagus | ESCC | protein alkylation | 115/8552 | 181/18723 | 9.07e-07 | 1.16e-05 | 115 |
| GO:00064791 | Liver | Cirrhotic | protein methylation | 61/4634 | 181/18723 | 4.13e-03 | 2.21e-02 | 61 |
| GO:00082131 | Liver | Cirrhotic | protein alkylation | 61/4634 | 181/18723 | 4.13e-03 | 2.21e-02 | 61 |
| GO:00434141 | Liver | HCC | macromolecule methylation | 183/7958 | 316/18723 | 2.00e-08 | 4.72e-07 | 183 |
| GO:0032259 | Liver | HCC | methylation | 206/7958 | 364/18723 | 3.35e-08 | 7.53e-07 | 206 |
| GO:00064792 | Liver | HCC | protein methylation | 111/7958 | 181/18723 | 2.36e-07 | 4.18e-06 | 111 |
| GO:00082132 | Liver | HCC | protein alkylation | 111/7958 | 181/18723 | 2.36e-07 | 4.18e-06 | 111 |
| GO:00064794 | Lung | IAC | protein methylation | 34/2061 | 181/18723 | 1.28e-03 | 1.45e-02 | 34 |
| GO:00082134 | Lung | IAC | protein alkylation | 34/2061 | 181/18723 | 1.28e-03 | 1.45e-02 | 34 |
| GO:000647911 | Lung | AIS | protein methylation | 29/1849 | 181/18723 | 6.16e-03 | 4.98e-02 | 29 |
| GO:000821311 | Lung | AIS | protein alkylation | 29/1849 | 181/18723 | 6.16e-03 | 4.98e-02 | 29 |
| GO:00064797 | Oral cavity | OSCC | protein methylation | 92/7305 | 181/18723 | 7.86e-04 | 4.26e-03 | 92 |
| GO:00082137 | Oral cavity | OSCC | protein alkylation | 92/7305 | 181/18723 | 7.86e-04 | 4.26e-03 | 92 |
| GO:00434142 | Oral cavity | OSCC | macromolecule methylation | 149/7305 | 316/18723 | 1.82e-03 | 8.60e-03 | 149 |
| GO:00322591 | Oral cavity | OSCC | methylation | 168/7305 | 364/18723 | 3.03e-03 | 1.31e-02 | 168 |
| GO:000647913 | Oral cavity | EOLP | protein methylation | 35/2218 | 181/18723 | 2.30e-03 | 1.42e-02 | 35 |
| GO:000821313 | Oral cavity | EOLP | protein alkylation | 35/2218 | 181/18723 | 2.30e-03 | 1.42e-02 | 35 |
| Page: 1 2 3 |
| Pathway ID | Tissue | Disease Stage | Description | Gene Ratio | Bg Ratio | pvalue | p.adjust | qvalue | Count |
| Page: 1 |
Top |
Cell-cell communication analysis |
| Identification of potential cell-cell interactions between two cell types and their ligand-receptor pairs for different disease states |
| Ligand | Receptor | LRpair | Pathway | Tissue | Disease Stage |
| Page: 1 |
Top |
Single-cell gene regulatory network inference analysis |
| Find out the significant the regulons (TFs) and the target genes of each regulon across cell types for different disease states |
| TF | Cell Type | Tissue | Disease Stage | Target Gene | RSS | Regulon Activity |
| ∗The dot plots of a searched regulon are shown for all cell subpopulations in each disease state of each tissue based on the regulon specific score inferred using pySCENIC and by calculating the average expression. |
| Page: 1 |
Top |
Somatic mutation of malignant transformation related genes |
| Annotation of somatic variants for genes involved in malignant transformation |
| Hugo Symbol | Variant Class | Variant Classification | dbSNP RS | HGVSc | HGVSp | HGVSp Short | SWISSPROT | BIOTYPE | SIFT | PolyPhen | Tumor Sample Barcode | Tissue | Histology | Sex | Age | Stage | Therapy Types | Drugs | Outcome |
| PCMTD1 | SNV | Missense_Mutation | c.485N>A | p.Arg162Gln | p.R162Q | Q96MG8 | protein_coding | deleterious(0) | probably_damaging(1) | TCGA-AN-A046-01 | Breast | breast invasive carcinoma | Female | >=65 | I/II | Unknown | Unknown | SD | |
| PCMTD1 | SNV | Missense_Mutation | rs750606733 | c.274N>A | p.Gly92Arg | p.G92R | Q96MG8 | protein_coding | deleterious(0) | probably_damaging(1) | TCGA-AN-A046-01 | Breast | breast invasive carcinoma | Female | >=65 | I/II | Unknown | Unknown | SD |
| PCMTD1 | deletion | Frame_Shift_Del | novel | c.231delN | p.Lys77AsnfsTer18 | p.K77Nfs*18 | Q96MG8 | protein_coding | TCGA-D8-A27V-01 | Breast | breast invasive carcinoma | Female | <65 | I/II | Hormone Therapy | tamoxiphen | SD | ||
| PCMTD1 | SNV | Missense_Mutation | c.599N>A | p.Arg200Gln | p.R200Q | Q96MG8 | protein_coding | deleterious(0) | probably_damaging(0.998) | TCGA-AA-3510-01 | Colorectum | colon adenocarcinoma | Male | >=65 | I/II | Unknown | Unknown | SD | |
| PCMTD1 | SNV | Missense_Mutation | c.695C>T | p.Ser232Phe | p.S232F | Q96MG8 | protein_coding | tolerated(0.34) | benign(0) | TCGA-AA-3712-01 | Colorectum | colon adenocarcinoma | Male | >=65 | III/IV | Unknown | Unknown | SD | |
| PCMTD1 | SNV | Missense_Mutation | c.668N>C | p.Ser223Thr | p.S223T | Q96MG8 | protein_coding | tolerated(0.57) | benign(0.007) | TCGA-AA-3989-01 | Colorectum | colon adenocarcinoma | Male | >=65 | III/IV | Unknown | Unknown | PD | |
| PCMTD1 | SNV | Missense_Mutation | rs764485169 | c.755G>A | p.Arg252Gln | p.R252Q | Q96MG8 | protein_coding | deleterious(0) | probably_damaging(0.996) | TCGA-AA-A00N-01 | Colorectum | colon adenocarcinoma | Male | >=65 | I/II | Unknown | Unknown | PD |
| PCMTD1 | SNV | Missense_Mutation | c.19G>A | p.Ala7Thr | p.A7T | Q96MG8 | protein_coding | tolerated(0.18) | benign(0.258) | TCGA-AD-6889-01 | Colorectum | colon adenocarcinoma | Male | >=65 | I/II | Chemotherapy | xeloda | PD | |
| PCMTD1 | SNV | Missense_Mutation | c.485N>A | p.Arg162Gln | p.R162Q | Q96MG8 | protein_coding | deleterious(0) | probably_damaging(1) | TCGA-AZ-4315-01 | Colorectum | colon adenocarcinoma | Male | <65 | I/II | Unknown | Unknown | SD | |
| PCMTD1 | SNV | Missense_Mutation | c.995N>C | p.Asn332Thr | p.N332T | Q96MG8 | protein_coding | tolerated(0.12) | possibly_damaging(0.493) | TCGA-CA-6717-01 | Colorectum | colon adenocarcinoma | Male | <65 | I/II | Chemotherapy | oxaliplatin | CR |
| Page: 1 2 3 4 5 6 |
Top |
Related drugs of malignant transformation related genes |
| Identification of chemicals and drugs interact with genes involved in malignant transfromation |
| (DGIdb 4.0) |
| Entrez ID | Symbol | Category | Interaction Types | Drug Claim Name | Drug Name | PMIDs |
| Page: 1 |

Copyright 2023-Present -The University of Texas Health Science Center at Houston |