
|
|||||
|
 | |
| |
| |
| |
| |
| |
|
Gene: PCMT1 |
Gene summary for PCMT1 |
| Gene information | Species | Human | Gene symbol | PCMT1 | Gene ID | 5110 |
| Gene name | protein-L-isoaspartate (D-aspartate) O-methyltransferase | |
| Gene Alias | PIMT | |
| Cytomap | 6q25.1 | |
| Gene Type | protein-coding | GO ID | GO:0006464 | UniProtAcc | H7BY58 |
Top |
Malignant transformation analysis |
| Identification of the aberrant gene expression in precancerous and cancerous lesions by comparing the gene expression of stem-like cells in diseased tissues with normal stem cells |
| Entrez ID | Symbol | Replicates | Species | Organ | Tissue | Adj P-value | Log2FC | Malignancy |
| 5110 | PCMT1 | GSM4909285 | Human | Breast | IDC | 3.69e-25 | 5.87e-01 | 0.21 |
| 5110 | PCMT1 | GSM4909287 | Human | Breast | IDC | 2.85e-02 | 2.93e-01 | 0.2057 |
| 5110 | PCMT1 | GSM4909288 | Human | Breast | IDC | 6.40e-04 | 3.00e-01 | 0.0988 |
| 5110 | PCMT1 | GSM4909289 | Human | Breast | IDC | 1.24e-05 | 5.96e-01 | 0.1064 |
| 5110 | PCMT1 | GSM4909293 | Human | Breast | IDC | 1.66e-05 | 1.81e-01 | 0.1581 |
| 5110 | PCMT1 | GSM4909296 | Human | Breast | IDC | 1.18e-03 | -1.73e-01 | 0.1524 |
| 5110 | PCMT1 | GSM4909297 | Human | Breast | IDC | 4.13e-09 | -1.09e-01 | 0.1517 |
| 5110 | PCMT1 | GSM4909301 | Human | Breast | IDC | 2.24e-02 | -1.78e-01 | 0.1577 |
| 5110 | PCMT1 | GSM4909306 | Human | Breast | IDC | 6.84e-07 | 3.11e-01 | 0.1564 |
| 5110 | PCMT1 | GSM4909308 | Human | Breast | IDC | 4.20e-04 | 3.27e-01 | 0.158 |
| 5110 | PCMT1 | GSM4909311 | Human | Breast | IDC | 5.57e-16 | -2.41e-01 | 0.1534 |
| 5110 | PCMT1 | GSM4909312 | Human | Breast | IDC | 1.89e-06 | 5.06e-02 | 0.1552 |
| 5110 | PCMT1 | GSM4909315 | Human | Breast | IDC | 1.79e-28 | 6.61e-01 | 0.21 |
| 5110 | PCMT1 | GSM4909319 | Human | Breast | IDC | 4.24e-18 | -2.35e-01 | 0.1563 |
| 5110 | PCMT1 | GSM4909320 | Human | Breast | IDC | 4.87e-02 | -2.67e-01 | 0.1575 |
| 5110 | PCMT1 | GSM4909321 | Human | Breast | IDC | 2.78e-07 | -1.41e-01 | 0.1559 |
| 5110 | PCMT1 | brca1 | Human | Breast | Precancer | 7.05e-23 | 5.46e-01 | -0.0338 |
| 5110 | PCMT1 | brca2 | Human | Breast | Precancer | 5.17e-12 | 3.54e-01 | -0.024 |
| 5110 | PCMT1 | brca3 | Human | Breast | Precancer | 1.73e-09 | 2.92e-01 | -0.0263 |
| 5110 | PCMT1 | NCCBC11 | Human | Breast | DCIS | 2.64e-03 | -1.78e-02 | 0.1232 |
| Page: 1 2 3 4 5 6 7 8 |
| Tissue | Expression Dynamics | Abbreviation |
| Breast | 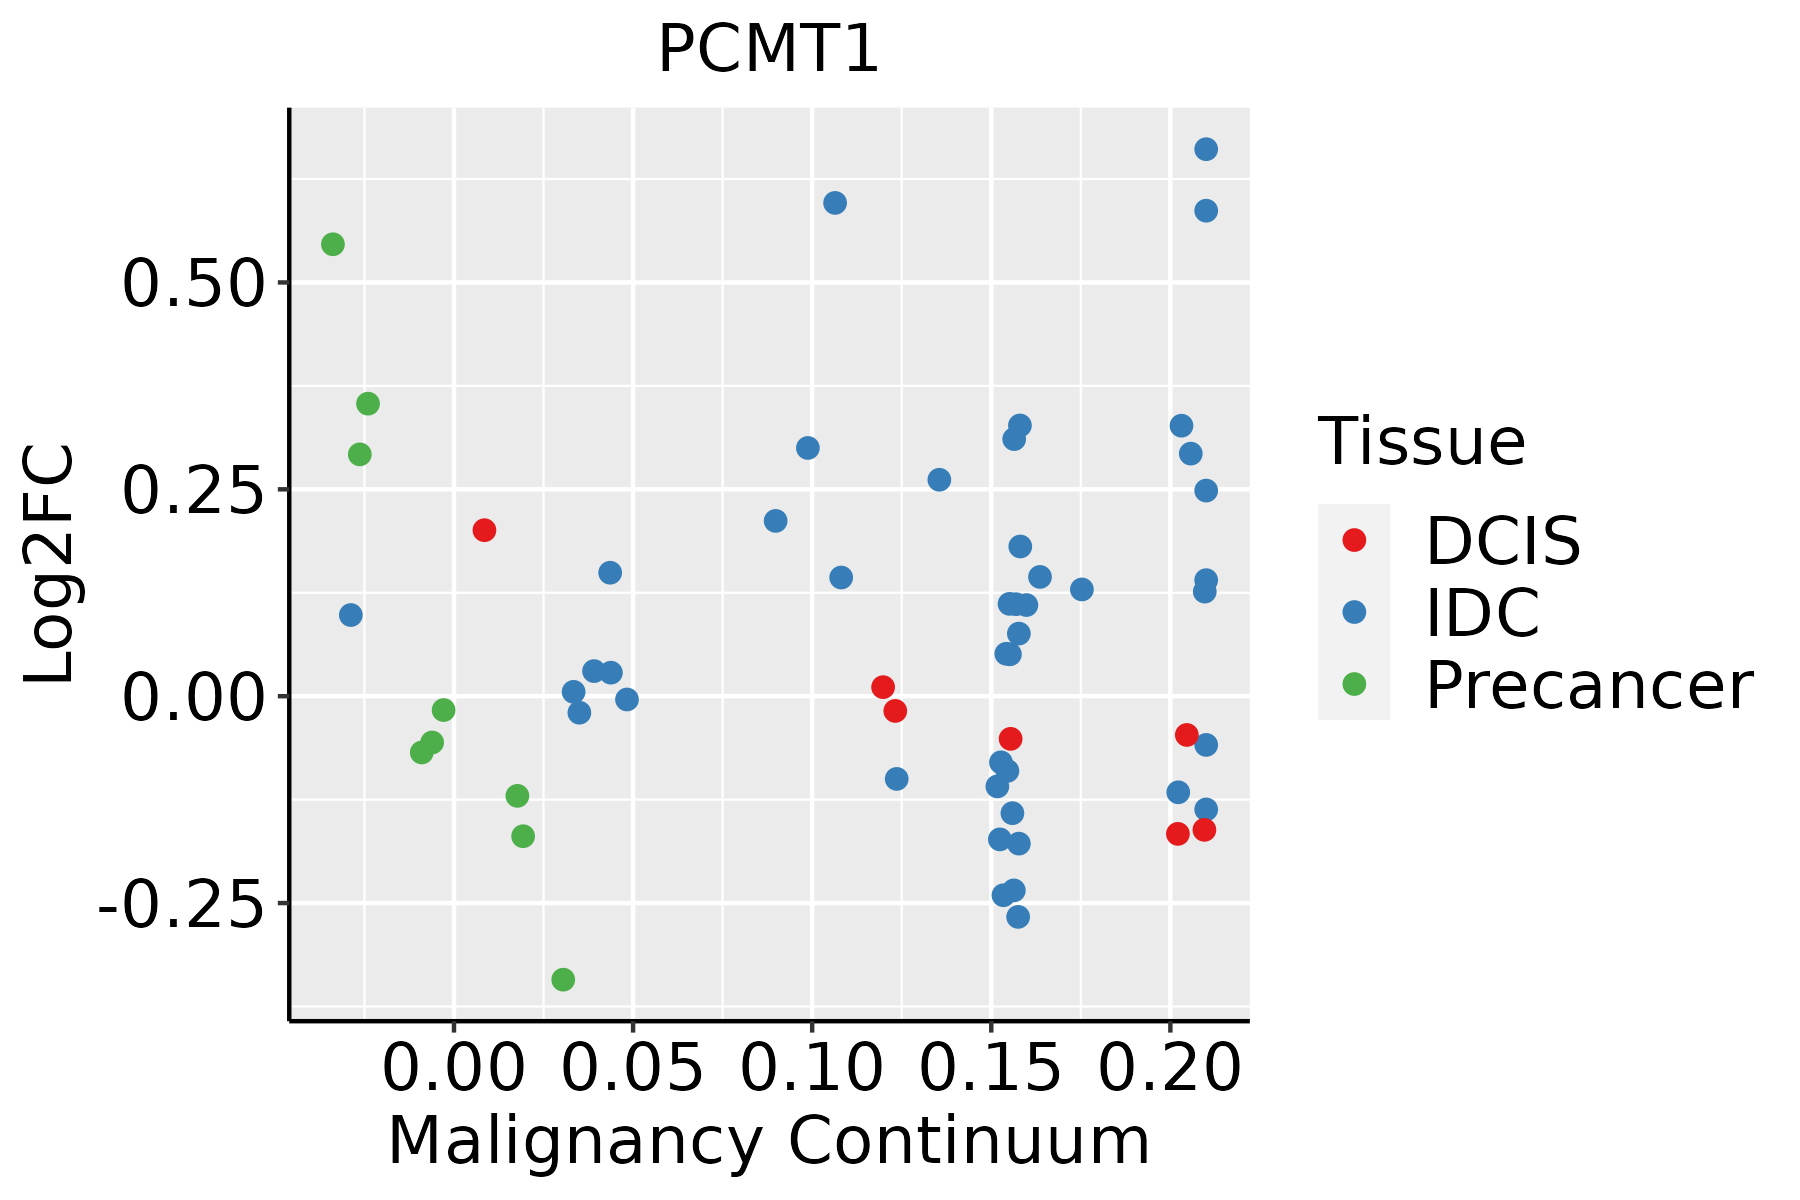 | IDC: Invasive ductal carcinoma |
| DCIS: Ductal carcinoma in situ | ||
| Precancer(BRCA1-mut): Precancerous lesion from BRCA1 mutation carriers | ||
| Esophagus | 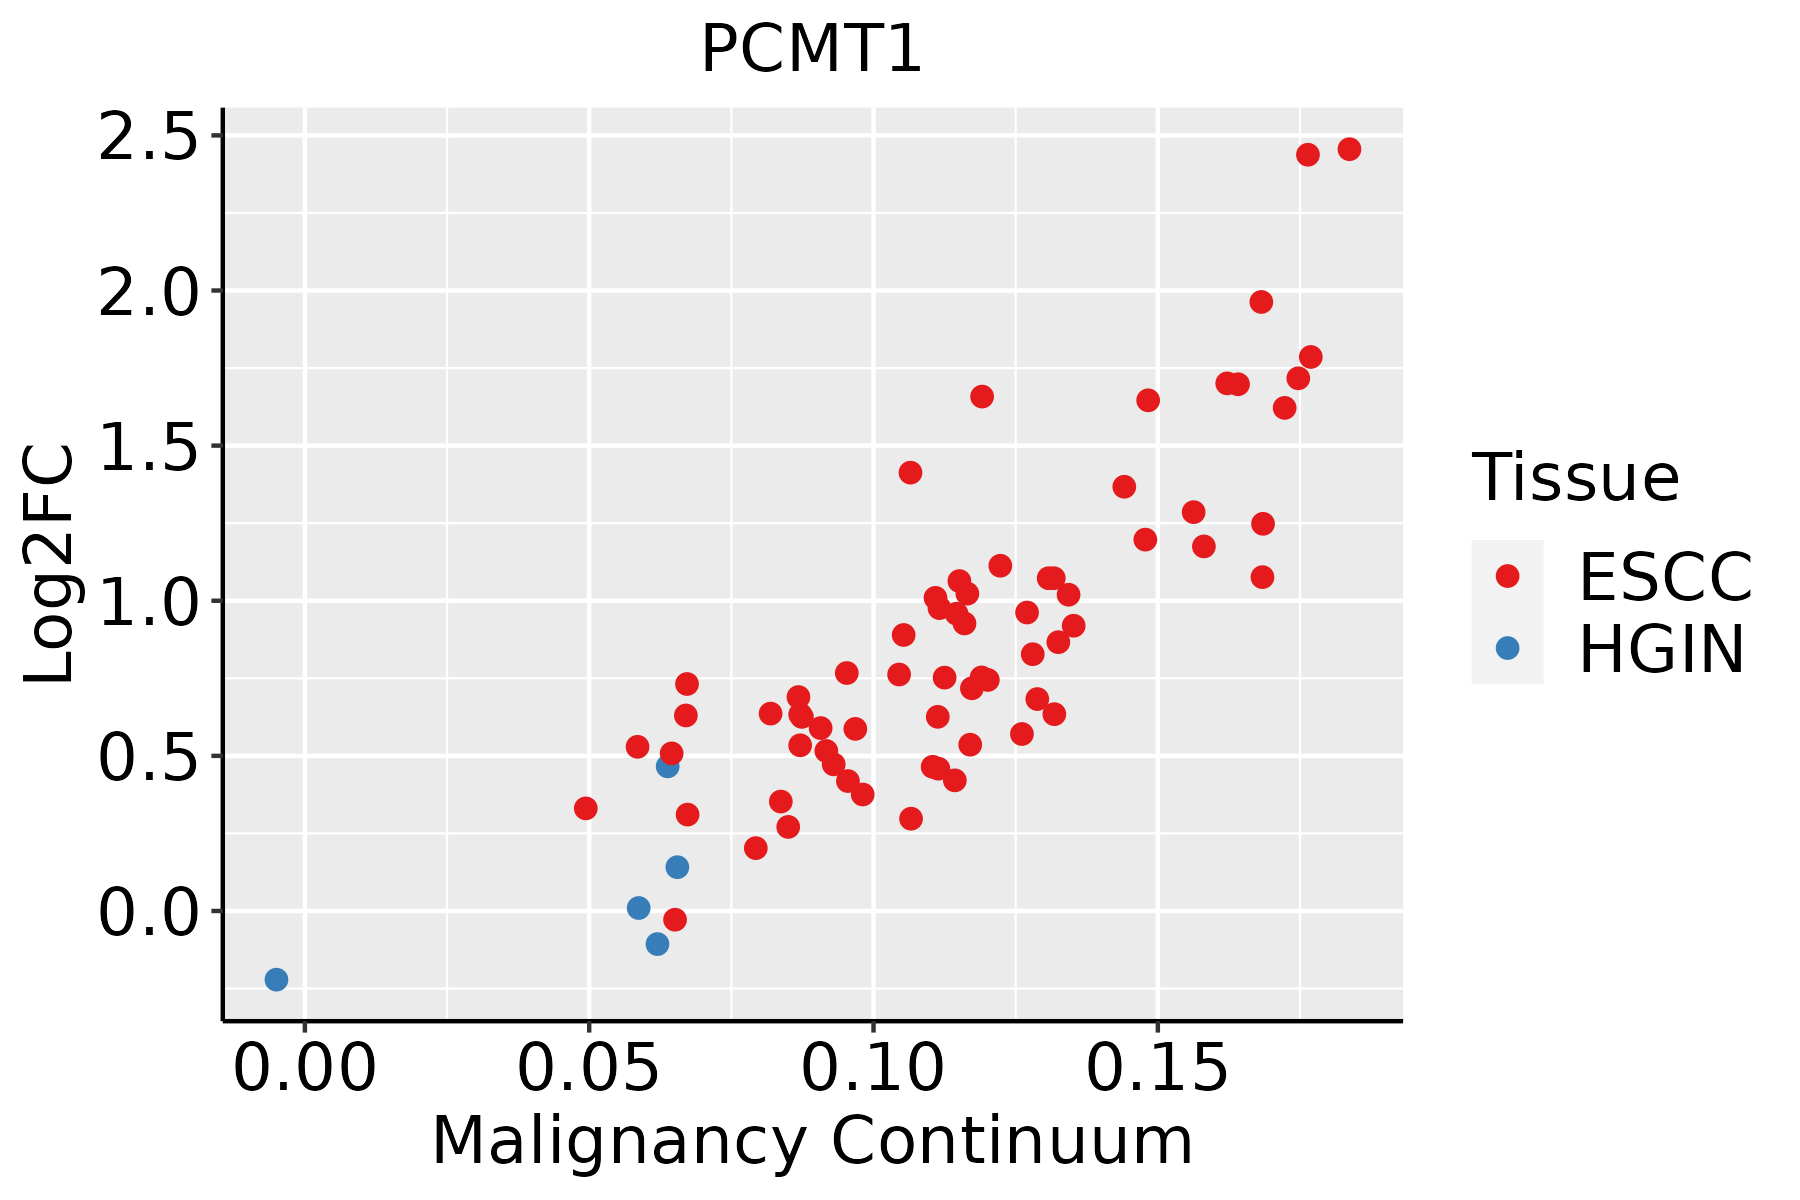 | ESCC: Esophageal squamous cell carcinoma |
| HGIN: High-grade intraepithelial neoplasias | ||
| LGIN: Low-grade intraepithelial neoplasias | ||
| Liver | 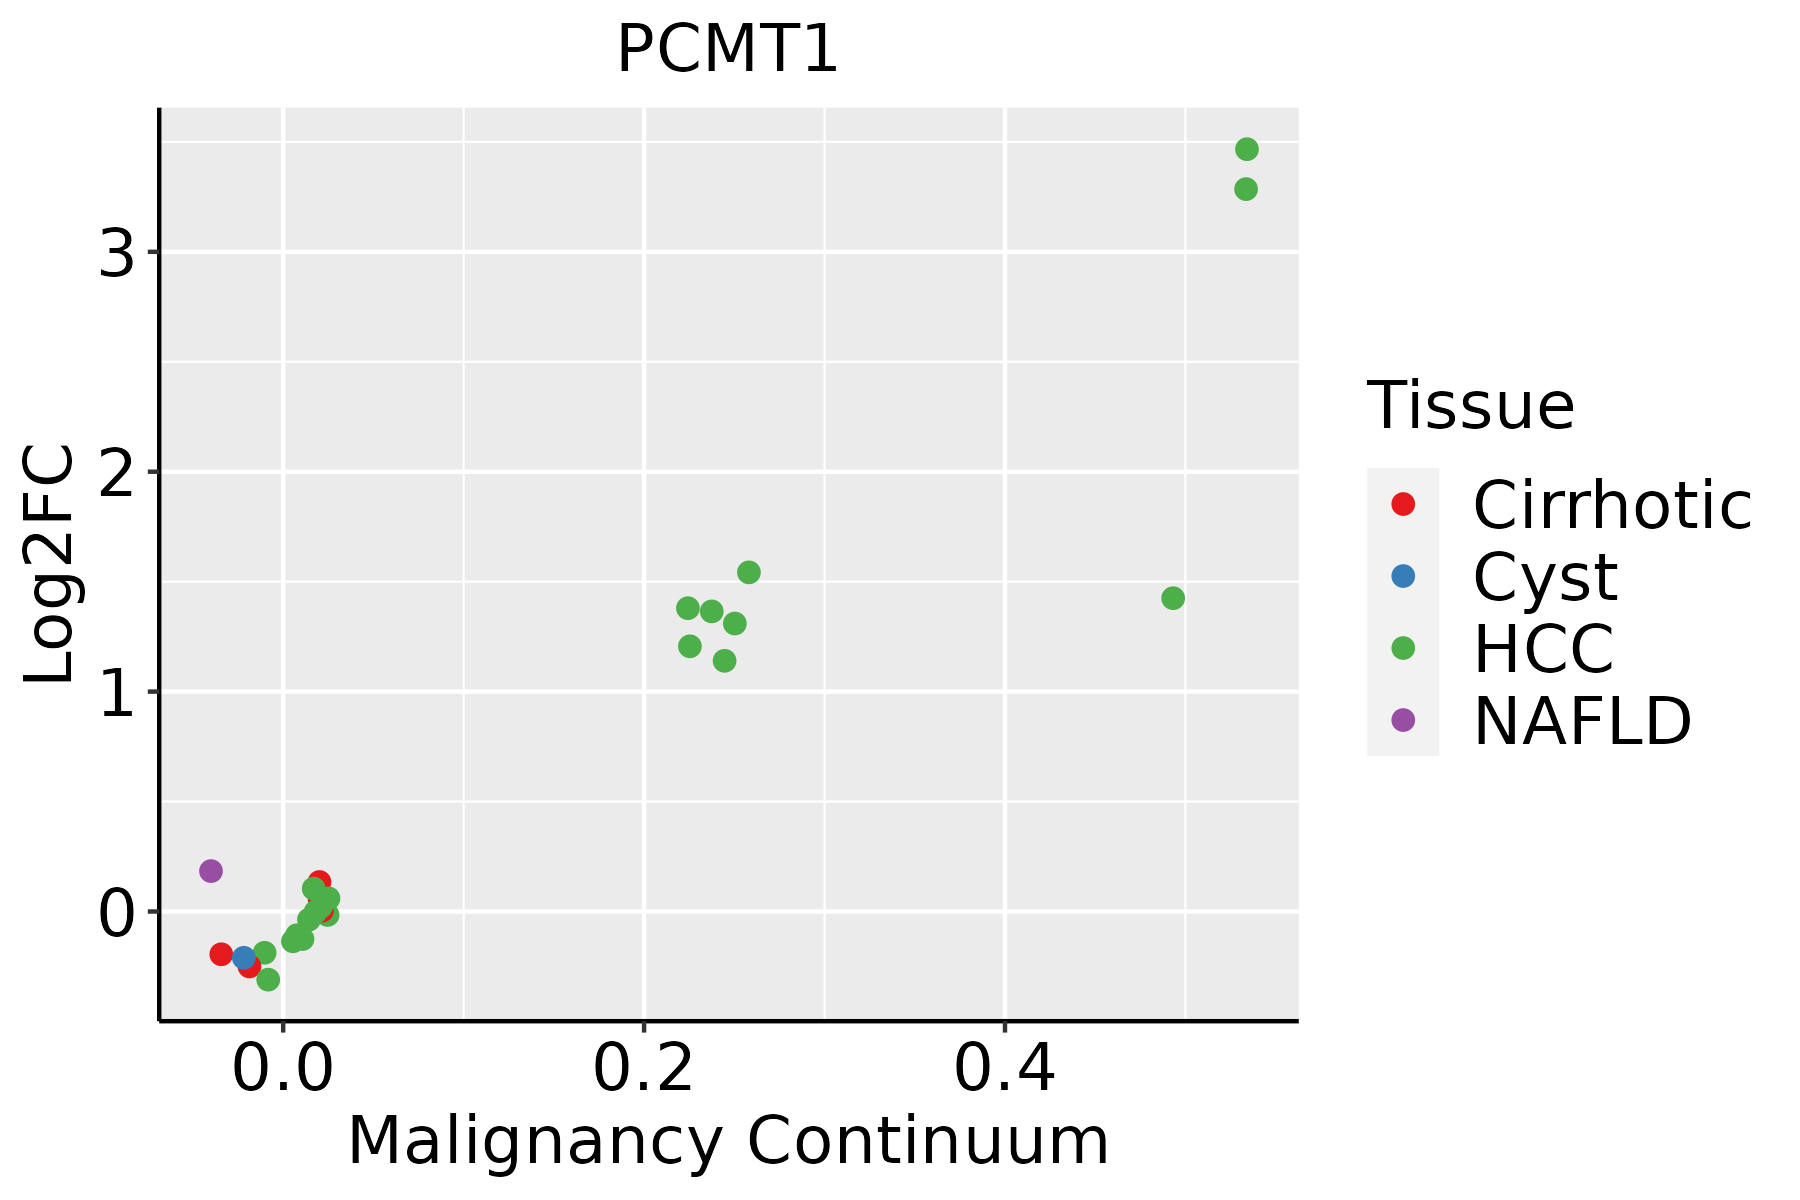 | HCC: Hepatocellular carcinoma |
| NAFLD: Non-alcoholic fatty liver disease | ||
| Oral Cavity |  | EOLP: Erosive Oral lichen planus |
| LP: leukoplakia | ||
| NEOLP: Non-erosive oral lichen planus | ||
| OSCC: Oral squamous cell carcinoma | ||
| Skin | 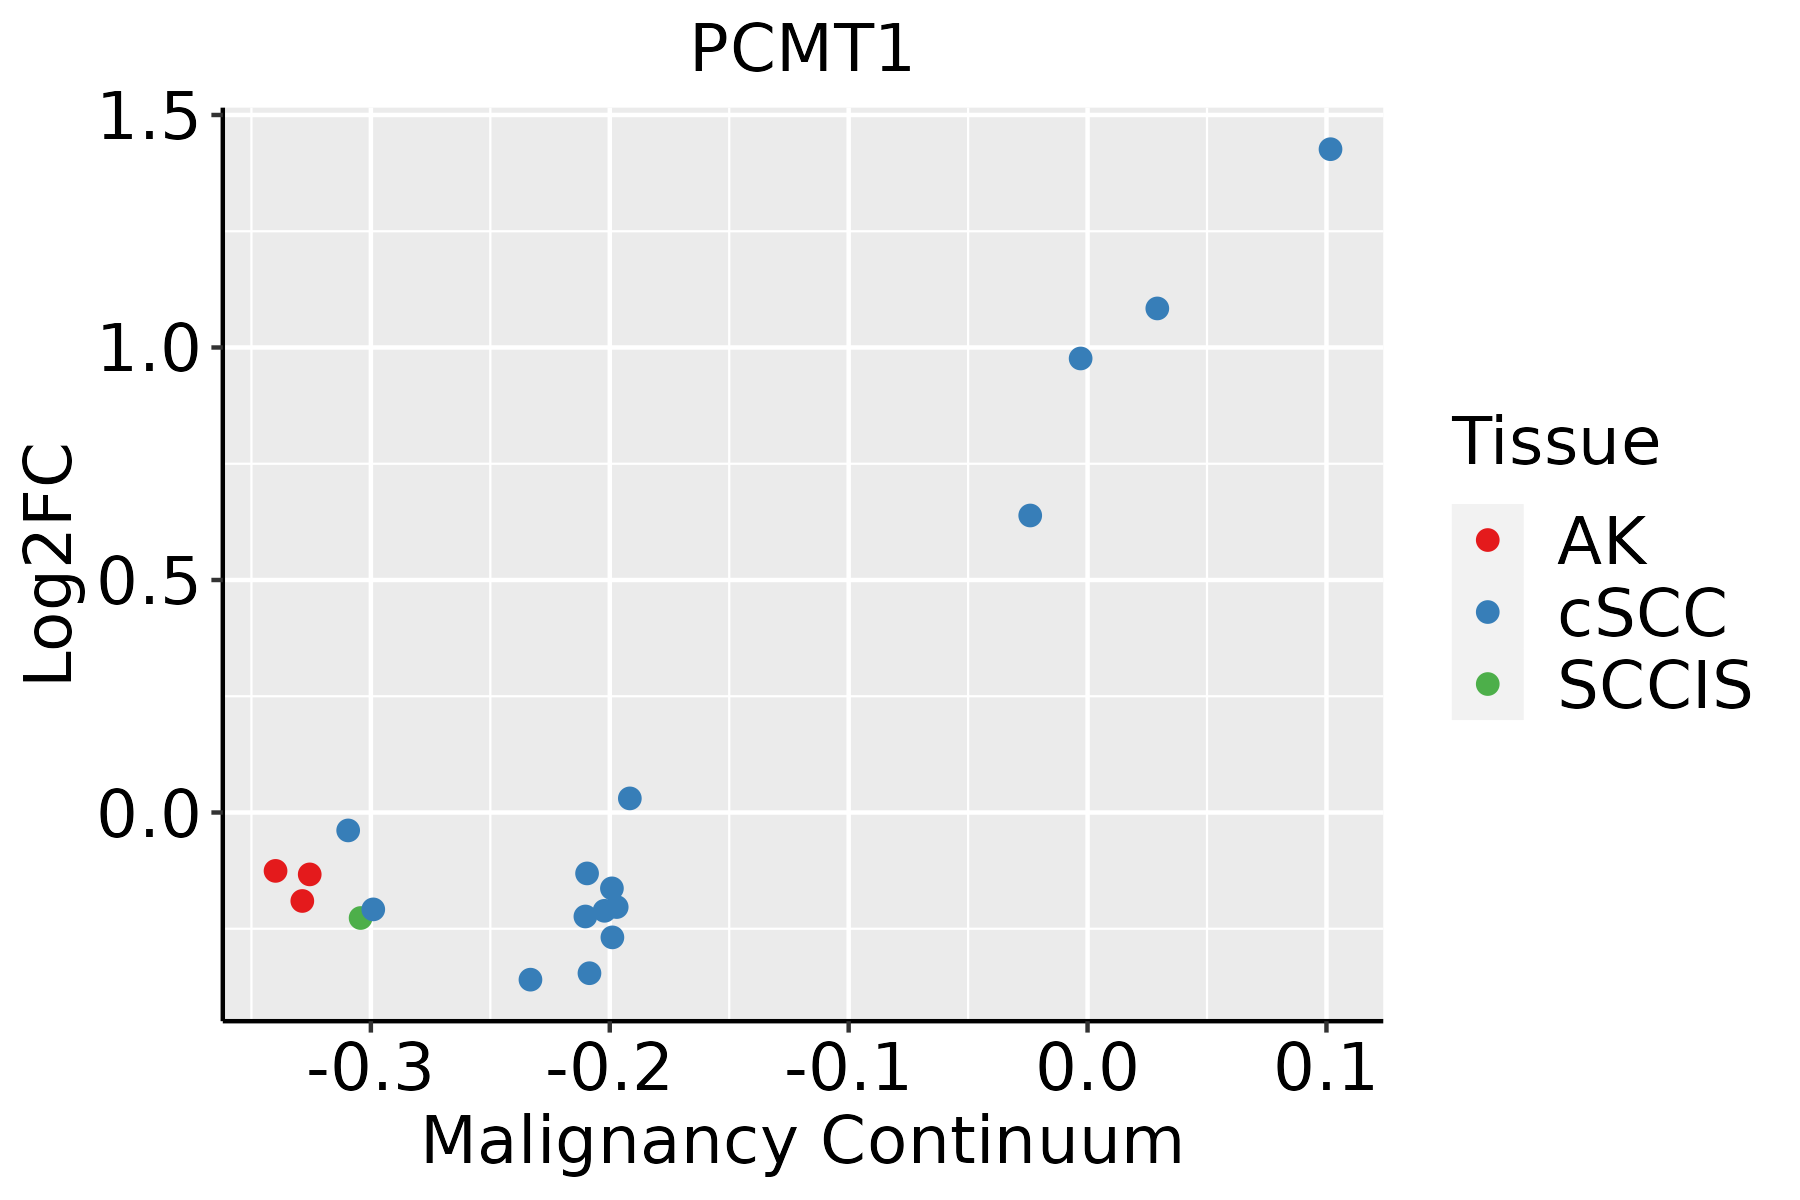 | AK: Actinic keratosis |
| cSCC: Cutaneous squamous cell carcinoma | ||
| SCCIS:squamous cell carcinoma in situ | ||
| Thyroid |  | ATC: Anaplastic thyroid cancer |
| HT: Hashimoto's thyroiditis | ||
| PTC: Papillary thyroid cancer |
| ∗log2FC in expression of this searched gene in stem-like cells from each diseased tissue sample relative to stem-like cells in normal samples in each tissue plotted against the malignancy continuum. Samples are colored based on if they are from different disease stage. |
Top |
Malignant transformation related pathway analysis |
| Find out the enriched GO biological processes and KEGG pathways involved in transition from healthy to precancer to cancer |
| Tissue | Disease Stage | Enriched GO biological Processes |
| Colorectum | AD |  |
| Colorectum | SER |  |
| Colorectum | MSS |  |
| Colorectum | MSI-H |  |
| Colorectum | FAP |  |
| ∗Top 15 enriched GO BP terms are showed in the bar plot of each disease state in each tissue. Each row represents a significant GO biological process which is colored according to the -log10(p.adjust). |
| Page: 1 2 3 4 5 6 7 8 9 |
| GO ID | Tissue | Disease Stage | Description | Gene Ratio | Bg Ratio | pvalue | p.adjust | Count |
| GO:00434143 | Esophagus | ESCC | macromolecule methylation | 199/8552 | 316/18723 | 3.44e-10 | 9.57e-09 | 199 |
| GO:00322592 | Esophagus | ESCC | methylation | 222/8552 | 364/18723 | 2.26e-09 | 5.09e-08 | 222 |
| GO:000647914 | Esophagus | ESCC | protein methylation | 115/8552 | 181/18723 | 9.07e-07 | 1.16e-05 | 115 |
| GO:000821314 | Esophagus | ESCC | protein alkylation | 115/8552 | 181/18723 | 9.07e-07 | 1.16e-05 | 115 |
| GO:00064791 | Liver | Cirrhotic | protein methylation | 61/4634 | 181/18723 | 4.13e-03 | 2.21e-02 | 61 |
| GO:00082131 | Liver | Cirrhotic | protein alkylation | 61/4634 | 181/18723 | 4.13e-03 | 2.21e-02 | 61 |
| GO:00434141 | Liver | HCC | macromolecule methylation | 183/7958 | 316/18723 | 2.00e-08 | 4.72e-07 | 183 |
| GO:0032259 | Liver | HCC | methylation | 206/7958 | 364/18723 | 3.35e-08 | 7.53e-07 | 206 |
| GO:00064792 | Liver | HCC | protein methylation | 111/7958 | 181/18723 | 2.36e-07 | 4.18e-06 | 111 |
| GO:00082132 | Liver | HCC | protein alkylation | 111/7958 | 181/18723 | 2.36e-07 | 4.18e-06 | 111 |
| GO:00064797 | Oral cavity | OSCC | protein methylation | 92/7305 | 181/18723 | 7.86e-04 | 4.26e-03 | 92 |
| GO:00082137 | Oral cavity | OSCC | protein alkylation | 92/7305 | 181/18723 | 7.86e-04 | 4.26e-03 | 92 |
| GO:00434142 | Oral cavity | OSCC | macromolecule methylation | 149/7305 | 316/18723 | 1.82e-03 | 8.60e-03 | 149 |
| GO:00322591 | Oral cavity | OSCC | methylation | 168/7305 | 364/18723 | 3.03e-03 | 1.31e-02 | 168 |
| GO:000647915 | Skin | cSCC | protein methylation | 67/4864 | 181/18723 | 6.65e-04 | 4.75e-03 | 67 |
| GO:000821315 | Skin | cSCC | protein alkylation | 67/4864 | 181/18723 | 6.65e-04 | 4.75e-03 | 67 |
| GO:004341411 | Skin | cSCC | macromolecule methylation | 107/4864 | 316/18723 | 1.03e-03 | 6.94e-03 | 107 |
| GO:00322593 | Skin | cSCC | methylation | 120/4864 | 364/18723 | 1.61e-03 | 9.93e-03 | 120 |
| GO:000647910 | Thyroid | PTC | protein methylation | 82/5968 | 181/18723 | 1.01e-04 | 8.21e-04 | 82 |
| GO:000821310 | Thyroid | PTC | protein alkylation | 82/5968 | 181/18723 | 1.01e-04 | 8.21e-04 | 82 |
| Page: 1 2 |
| Pathway ID | Tissue | Disease Stage | Description | Gene Ratio | Bg Ratio | pvalue | p.adjust | qvalue | Count |
| Page: 1 |
Top |
Cell-cell communication analysis |
| Identification of potential cell-cell interactions between two cell types and their ligand-receptor pairs for different disease states |
| Ligand | Receptor | LRpair | Pathway | Tissue | Disease Stage |
| Page: 1 |
Top |
Single-cell gene regulatory network inference analysis |
| Find out the significant the regulons (TFs) and the target genes of each regulon across cell types for different disease states |
| TF | Cell Type | Tissue | Disease Stage | Target Gene | RSS | Regulon Activity |
| ∗The dot plots of a searched regulon are shown for all cell subpopulations in each disease state of each tissue based on the regulon specific score inferred using pySCENIC and by calculating the average expression. |
| Page: 1 |
Top |
Somatic mutation of malignant transformation related genes |
| Annotation of somatic variants for genes involved in malignant transformation |
| Hugo Symbol | Variant Class | Variant Classification | dbSNP RS | HGVSc | HGVSp | HGVSp Short | SWISSPROT | BIOTYPE | SIFT | PolyPhen | Tumor Sample Barcode | Tissue | Histology | Sex | Age | Stage | Therapy Types | Drugs | Outcome |
| PCMT1 | SNV | Missense_Mutation | c.256G>C | p.Val86Leu | p.V86L | protein_coding | deleterious(0) | possibly_damaging(0.826) | TCGA-A8-A07R-01 | Breast | breast invasive carcinoma | Female | >=65 | III/IV | Ancillary | zoledronic | SD | ||
| PCMT1 | SNV | Missense_Mutation | c.188N>T | p.Ser63Phe | p.S63F | protein_coding | tolerated(0.08) | probably_damaging(0.979) | TCGA-C8-A26Y-01 | Breast | breast invasive carcinoma | Female | >=65 | I/II | Unknown | Unknown | SD | ||
| PCMT1 | deletion | Frame_Shift_Del | novel | c.801delN | p.Val269Ter | p.V269* | protein_coding | TCGA-D8-A27V-01 | Breast | breast invasive carcinoma | Female | <65 | I/II | Hormone Therapy | tamoxiphen | SD | |||
| PCMT1 | SNV | Missense_Mutation | rs754551183 | c.200G>A | p.Ser67Asn | p.S67N | protein_coding | tolerated(0.5) | benign(0.001) | TCGA-5M-AAT6-01 | Colorectum | colon adenocarcinoma | Female | <65 | III/IV | Unknown | Unknown | PD | |
| PCMT1 | SNV | Missense_Mutation | novel | c.291N>A | p.His97Gln | p.H97Q | protein_coding | tolerated(0.07) | possibly_damaging(0.698) | TCGA-A6-3808-01 | Colorectum | colon adenocarcinoma | Male | >=65 | I/II | Unknown | Unknown | SD | |
| PCMT1 | SNV | Missense_Mutation | novel | c.481N>C | p.Thr161Pro | p.T161P | protein_coding | tolerated(0.09) | benign(0.324) | TCGA-AZ-4315-01 | Colorectum | colon adenocarcinoma | Male | <65 | I/II | Unknown | Unknown | SD | |
| PCMT1 | SNV | Missense_Mutation | novel | c.718N>T | p.Pro240Ser | p.P240S | protein_coding | deleterious(0) | probably_damaging(1) | TCGA-F4-6808-01 | Colorectum | colon adenocarcinoma | Female | <65 | I/II | Unknown | Unknown | SD | |
| PCMT1 | SNV | Missense_Mutation | rs769452465 | c.677N>T | p.Ala226Val | p.A226V | protein_coding | deleterious(0.03) | possibly_damaging(0.907) | TCGA-AG-A002-01 | Colorectum | rectum adenocarcinoma | Male | <65 | I/II | Unknown | Unknown | SD | |
| PCMT1 | SNV | Missense_Mutation | novel | c.419N>T | p.Ala140Val | p.A140V | protein_coding | tolerated(0.32) | benign(0.239) | TCGA-EI-6917-01 | Colorectum | rectum adenocarcinoma | Male | <65 | III/IV | Chemotherapy | 5fluorouracil+oxaciplatina+l-folinian | SD | |
| PCMT1 | SNV | Missense_Mutation | novel | c.611N>A | p.Gly204Glu | p.G204E | protein_coding | deleterious(0) | probably_damaging(1) | TCGA-A5-A0G2-01 | Endometrium | uterine corpus endometrioid carcinoma | Female | <65 | III/IV | Unknown | Unknown | SD |
| Page: 1 2 3 |
Top |
Related drugs of malignant transformation related genes |
| Identification of chemicals and drugs interact with genes involved in malignant transfromation |
| (DGIdb 4.0) |
| Entrez ID | Symbol | Category | Interaction Types | Drug Claim Name | Drug Name | PMIDs |
| Page: 1 |

Copyright 2023-Present -The University of Texas Health Science Center at Houston |