Schematic overview of the cellular and molecular mechanisms involved in the cancer progression, including the proposed cellular and molecular mechanisms in cancer cells trajectory. AT1: alveolar type 1 cells; AT2: alveolar type 2 cells; AAH: atypical adenomatous hyperplasia; AIS: adenocarcinoma in situ; MIA: minimally invasive adenocarcinoma; IA: invasive adenocarcinoma; EMT: epithelial-mesenchymal transition

Home

Download

Statistics

Help

Contact

Center for Computational Systems Medicine
leaf

Gene summary

leaf

Malignant transformation analysis

leaf

Malignant transformation related pathway analysis

leaf

Cell-cell communication analysis

leaf

Single-cell gene regulatory network inference analysis

leaf

Somatic mutation of malignant transformation related genes

leaf

Related drugs of malignant transformation related genes

Gene: PCM1

Gene summary for PCM1

check button Gene summary.

Gene informationSpeciesHuman
Gene symbol

PCM1

Gene ID

5108

Gene namepericentriolar material 1
Gene AliasPTC4
Cytomap8p22
Gene Typeprotein-coding
GO ID

GO:0000226

UniProtAcc

B9EIS5


Top

Malignant transformation analysis

check button Identification of the aberrant gene expression in precancerous and cancerous lesions by comparing the gene expression of stem-like cells in diseased tissues with normal stem cells
check button Malignant transformation involving gene list.
Entrez IDSymbolReplicatesSpeciesOrganTissueAdj P-valueLog2FCMalignancy
5108PCM1HTA11_3410_2000001011HumanColorectumAD8.29e-21-5.64e-010.0155
5108PCM1HTA11_2487_2000001011HumanColorectumSER1.31e-06-4.64e-01-0.1808
5108PCM1HTA11_2112_2000001011HumanColorectumSER1.10e-02-6.85e-01-0.2196
5108PCM1HTA11_3361_2000001011HumanColorectumAD6.61e-09-4.79e-01-0.1207
5108PCM1HTA11_83_2000001011HumanColorectumSER2.46e-03-3.87e-01-0.1526
5108PCM1HTA11_696_2000001011HumanColorectumAD2.36e-03-3.16e-01-0.1464
5108PCM1HTA11_866_2000001011HumanColorectumAD3.89e-02-2.80e-01-0.1001
5108PCM1HTA11_1391_2000001011HumanColorectumAD1.01e-03-3.63e-01-0.059
5108PCM1HTA11_5212_2000001011HumanColorectumAD3.15e-04-6.17e-01-0.2061
5108PCM1HTA11_5216_2000001011HumanColorectumSER1.23e-03-7.35e-01-0.1462
5108PCM1HTA11_7862_2000001011HumanColorectumAD3.27e-03-4.93e-01-0.0179
5108PCM1HTA11_866_3004761011HumanColorectumAD4.84e-06-3.92e-010.096
5108PCM1HTA11_10711_2000001011HumanColorectumAD2.55e-02-3.90e-010.0338
5108PCM1HTA11_7696_3000711011HumanColorectumAD8.90e-08-3.42e-010.0674
5108PCM1HTA11_99999971662_82457HumanColorectumMSS4.92e-19-5.83e-010.3859
5108PCM1HTA11_99999974143_84620HumanColorectumMSS3.66e-12-4.21e-010.3005
5108PCM1A015-C-203HumanColorectumFAP1.90e-23-6.10e-02-0.1294
5108PCM1A014-C-040HumanColorectumFAP3.97e-03-7.61e-02-0.1184
5108PCM1A002-C-201HumanColorectumFAP4.03e-11-1.13e-010.0324
5108PCM1A001-C-119HumanColorectumFAP5.81e-059.19e-02-0.1557
Page: 1 2 3 4 5 6 7 8 9 10 11 

check button Transcriptomic changes along malignancy continuum.
TissueExpression DynamicsAbbreviation
Colorectum (GSE201348)The image shows the transcriptomic changes along malignancy continuum.log2FC in expression of this searched gene in stem-like cells from each diseased tissue sample relative to stem-like cells in normal samples in each tissue plotted against the malignancy continuum. Samples are colored based on if they are from different disease stage.
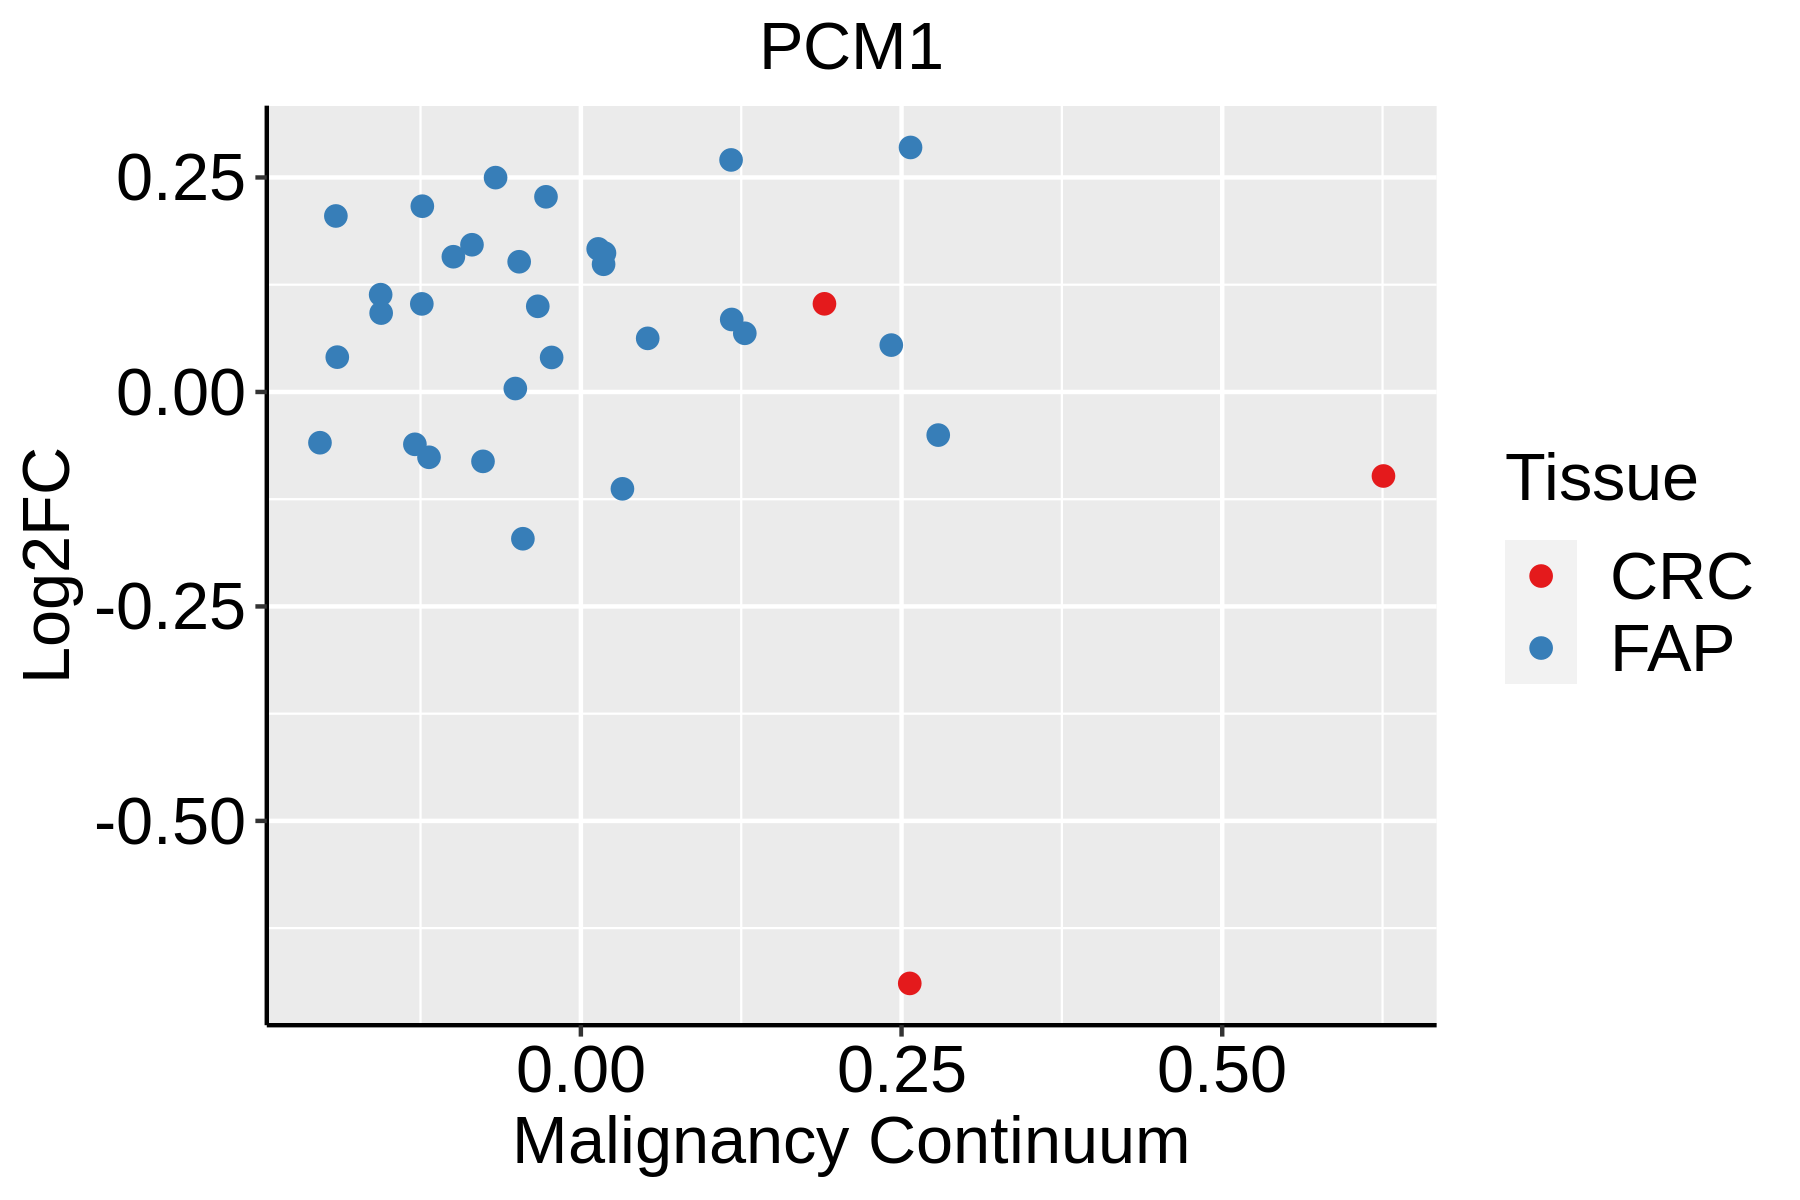
FAP: Familial adenomatous polyposis
CRC: Colorectal cancer
Colorectum (HTA11)The image shows the transcriptomic changes along malignancy continuum.log2FC in expression of this searched gene in stem-like cells from each diseased tissue sample relative to stem-like cells in normal samples in each tissue plotted against the malignancy continuum. Samples are colored based on if they are from different disease stage.AD: Adenomas
SER: Sessile serrated lesions
MSI-H: Microsatellite-high colorectal cancer
MSS: Microsatellite stable colorectal cancer
EsophagusThe image shows the transcriptomic changes along malignancy continuum.log2FC in expression of this searched gene in stem-like cells from each diseased tissue sample relative to stem-like cells in normal samples in each tissue plotted against the malignancy continuum. Samples are colored based on if they are from different disease stage.
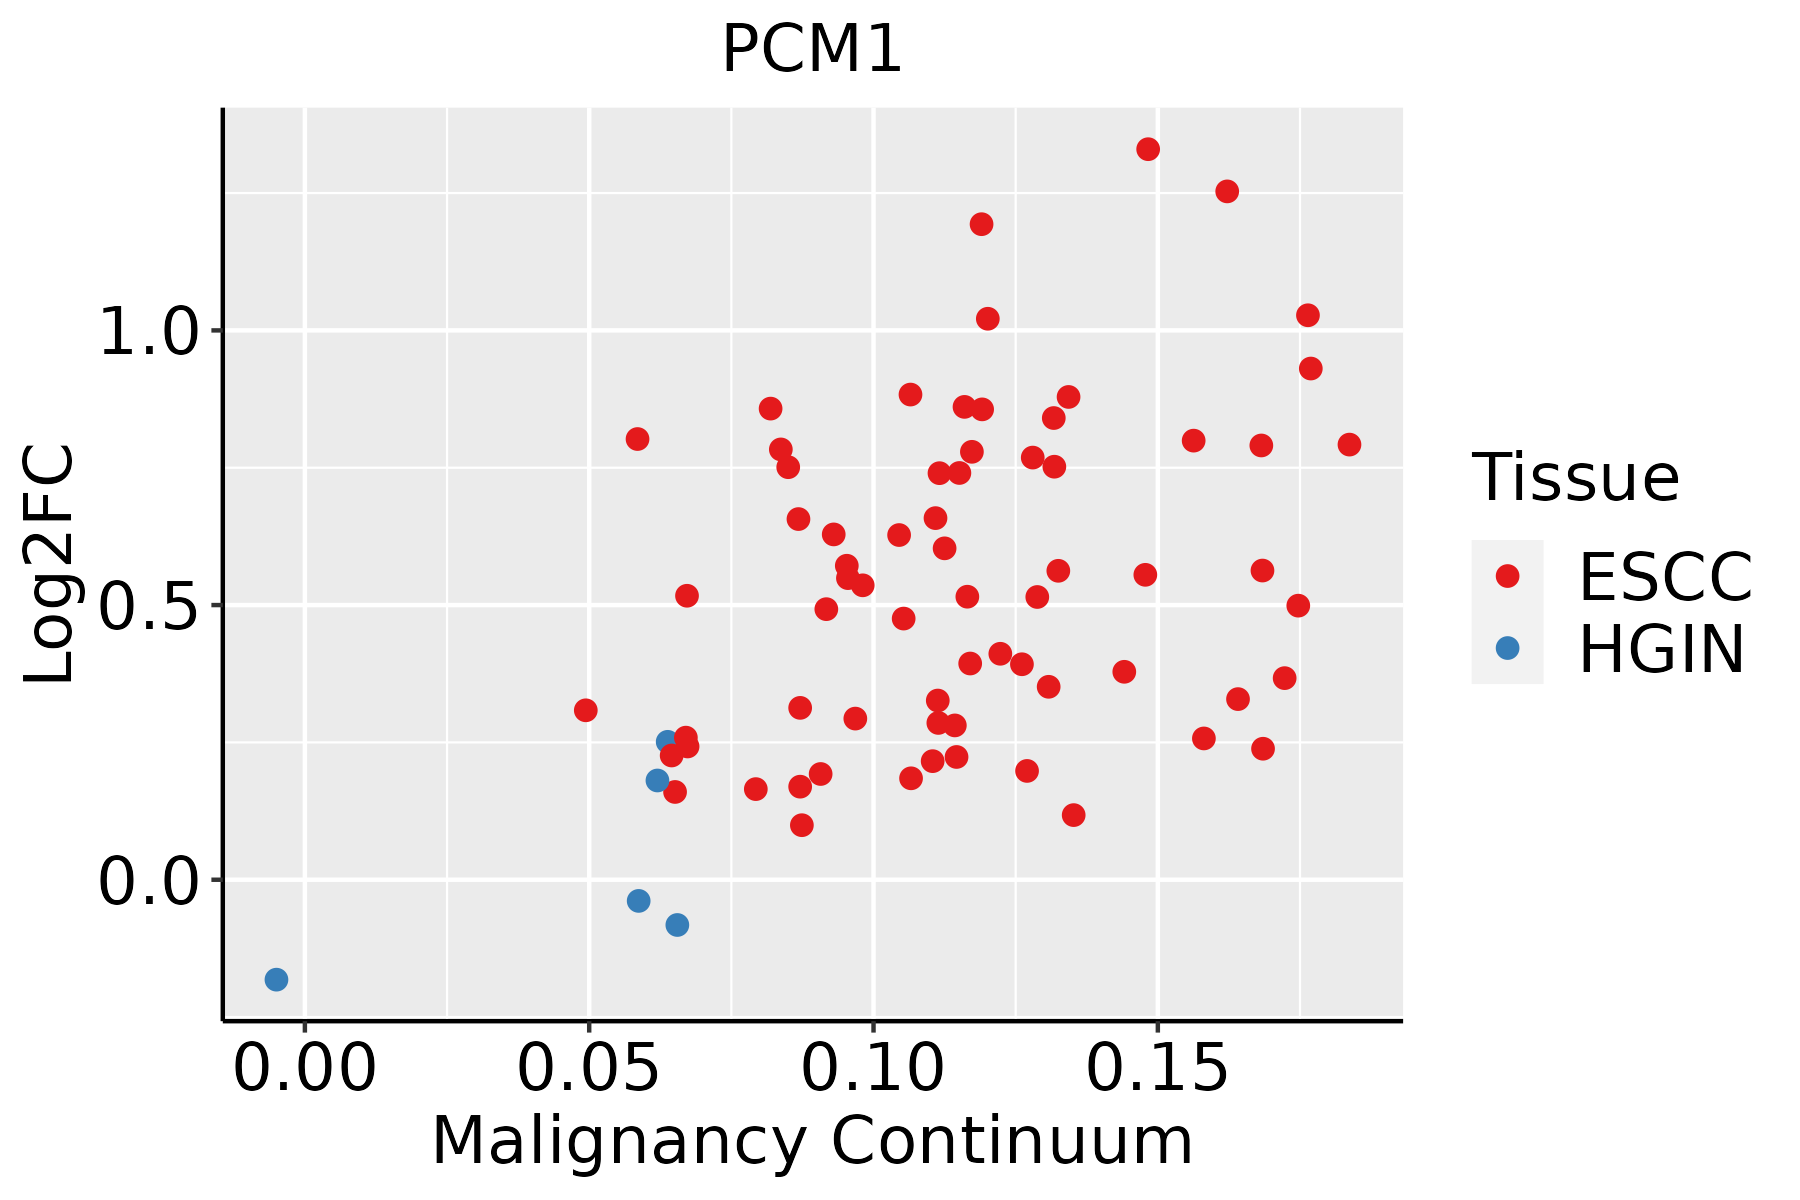
ESCC: Esophageal squamous cell carcinoma
HGIN: High-grade intraepithelial neoplasias
LGIN: Low-grade intraepithelial neoplasias
LiverThe image shows the transcriptomic changes along malignancy continuum.log2FC in expression of this searched gene in stem-like cells from each diseased tissue sample relative to stem-like cells in normal samples in each tissue plotted against the malignancy continuum. Samples are colored based on if they are from different disease stage.
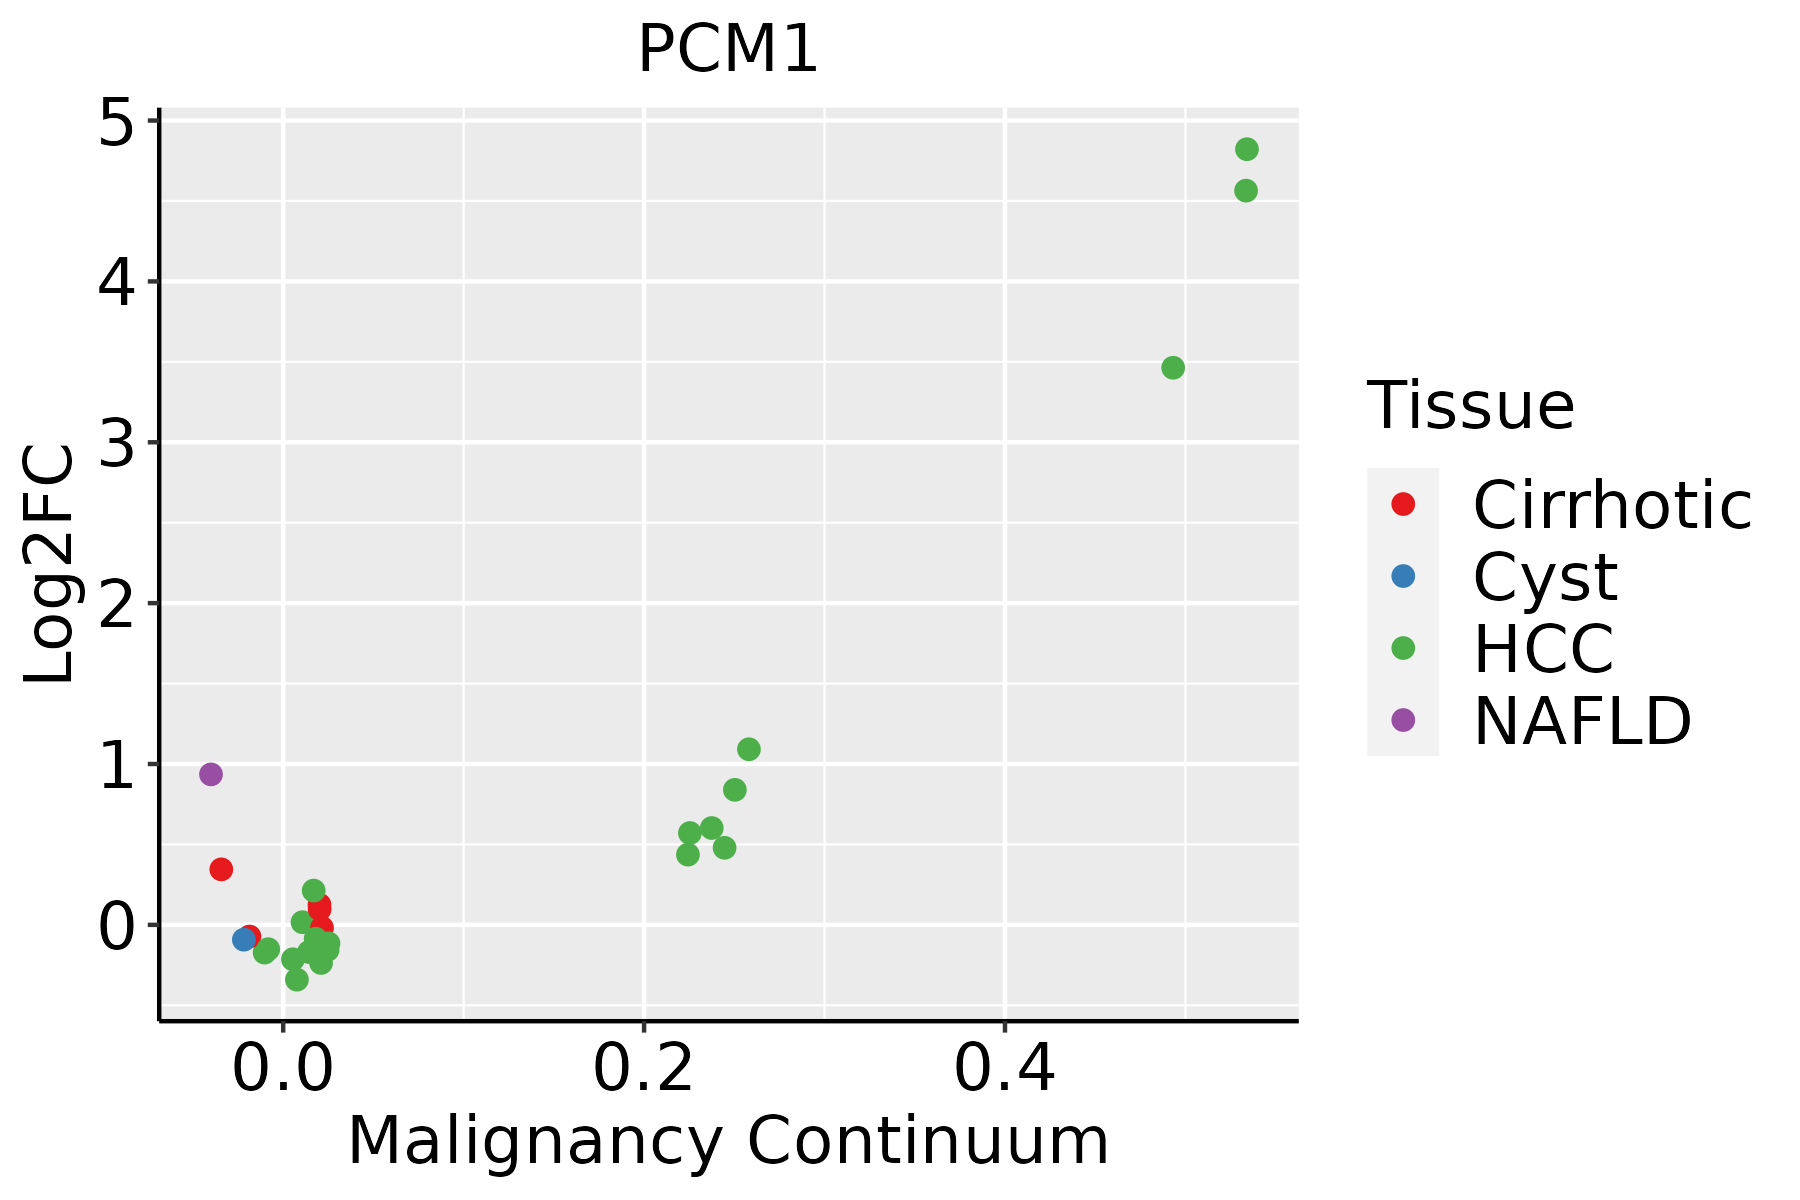
HCC: Hepatocellular carcinoma
NAFLD: Non-alcoholic fatty liver disease
LungThe image shows the transcriptomic changes along malignancy continuum.log2FC in expression of this searched gene in stem-like cells from each diseased tissue sample relative to stem-like cells in normal samples in each tissue plotted against the malignancy continuum. Samples are colored based on if they are from different disease stage.
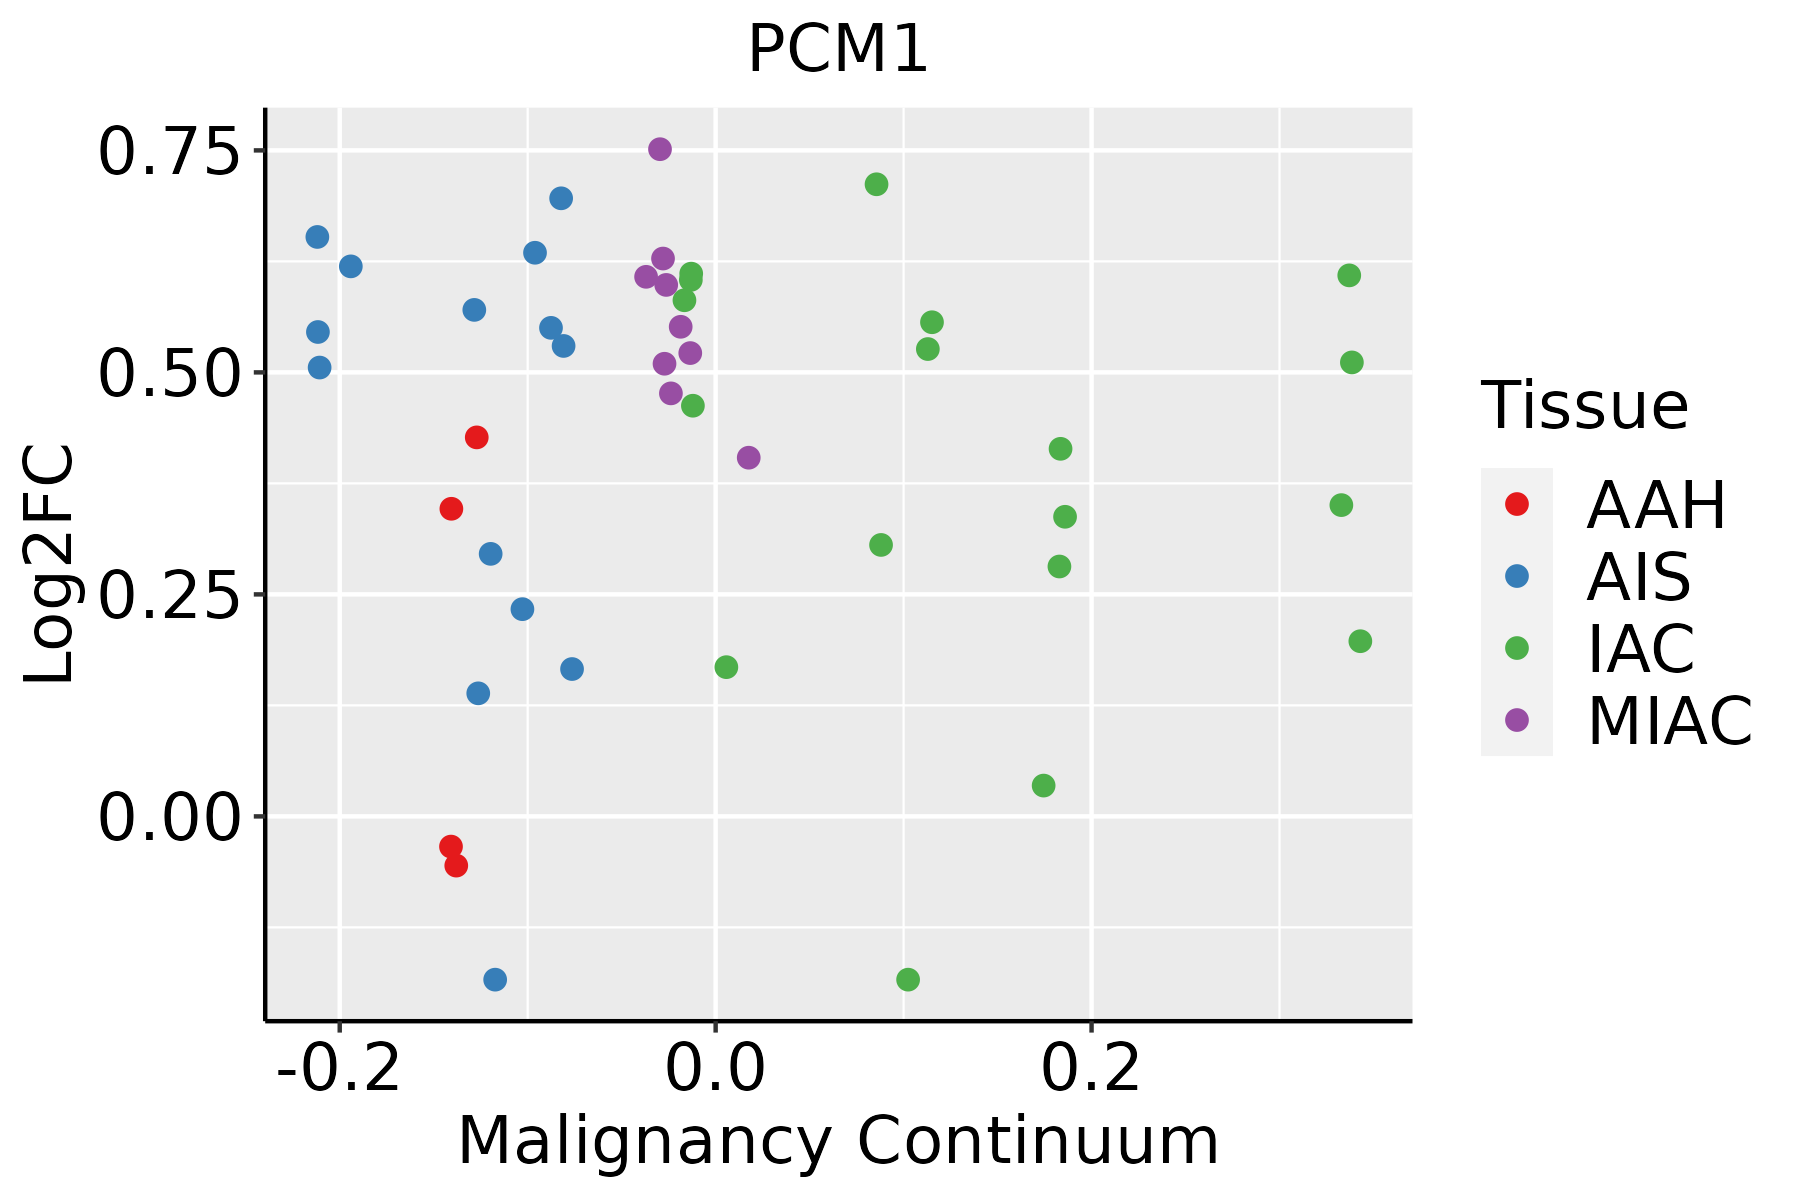
AAH: Atypical adenomatous hyperplasia
AIS: Adenocarcinoma in situ
IAC: Invasive lung adenocarcinoma
MIA: Minimally invasive adenocarcinoma
Oral CavityThe image shows the transcriptomic changes along malignancy continuum.log2FC in expression of this searched gene in stem-like cells from each diseased tissue sample relative to stem-like cells in normal samples in each tissue plotted against the malignancy continuum. Samples are colored based on if they are from different disease stage.
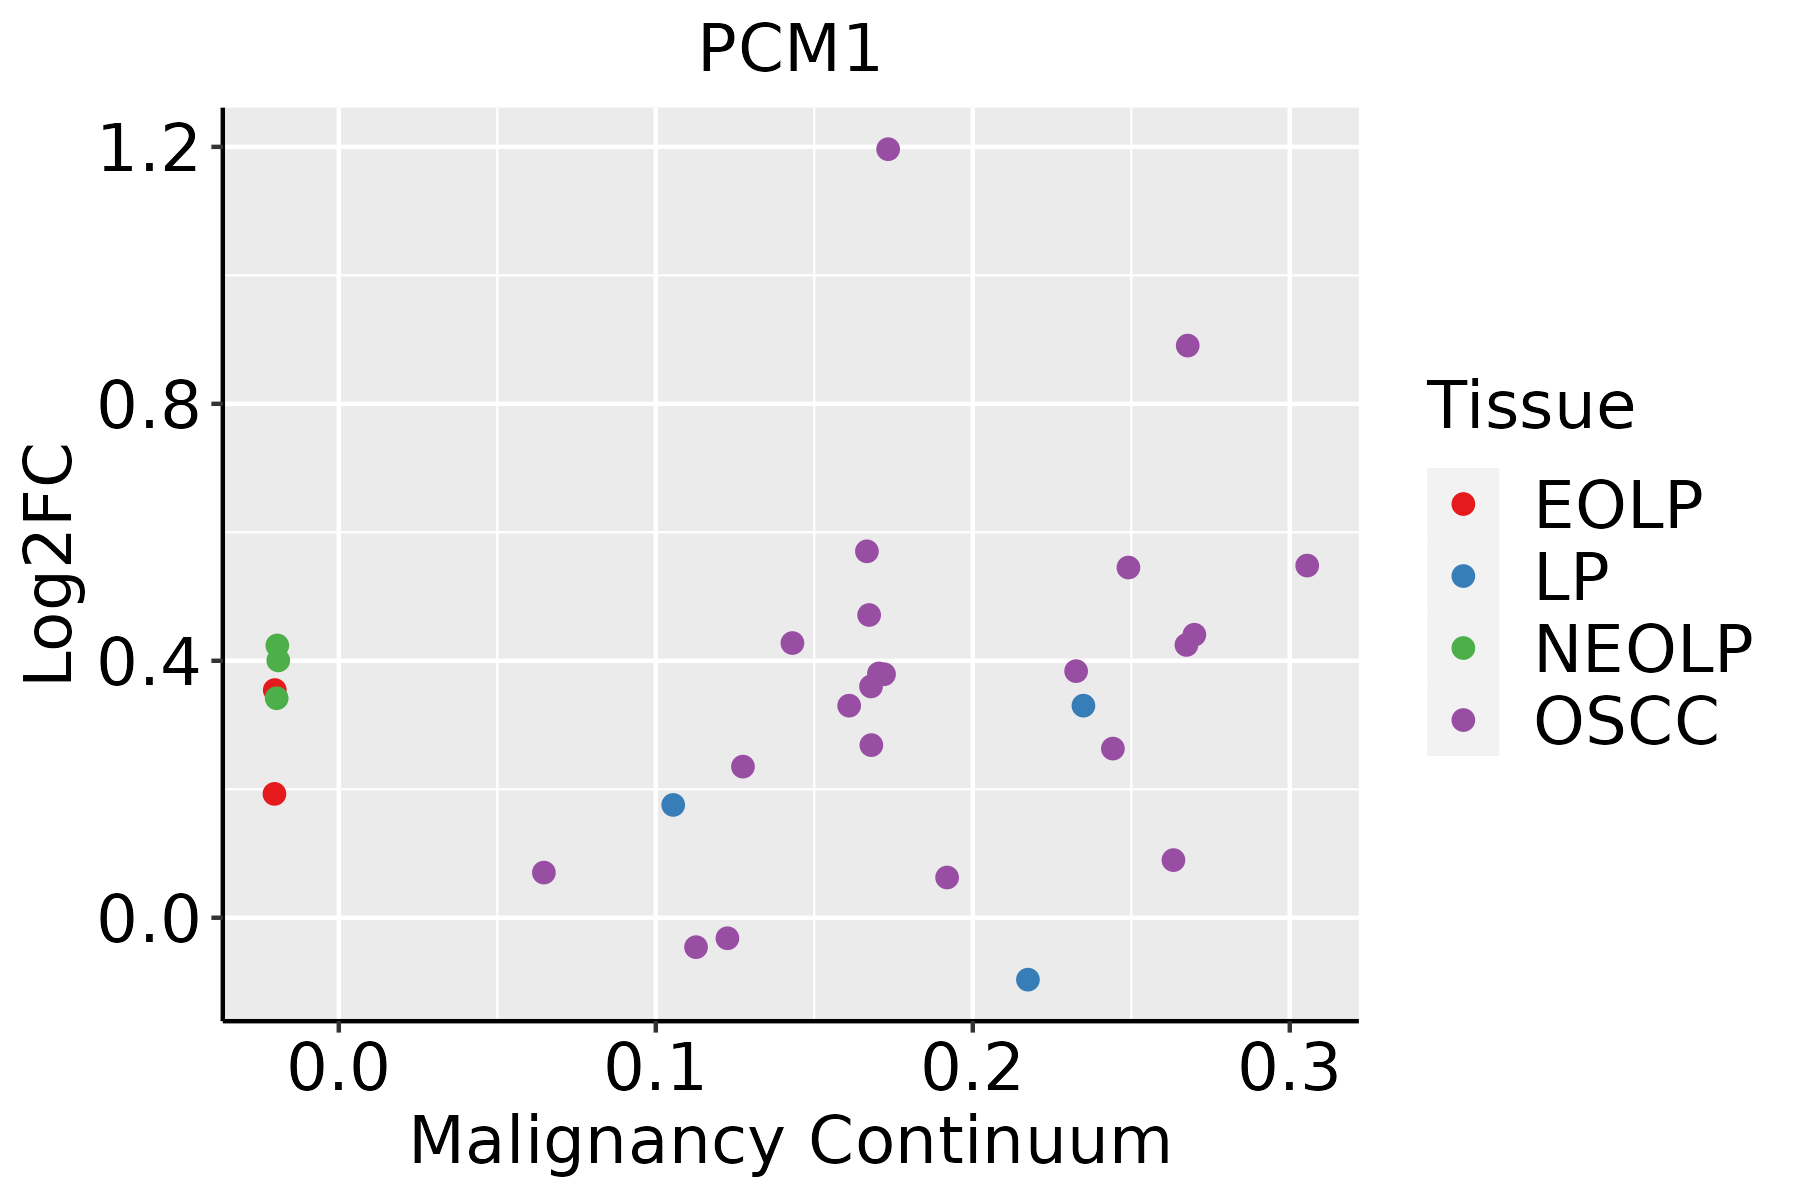
EOLP: Erosive Oral lichen planus
LP: leukoplakia
NEOLP: Non-erosive oral lichen planus
OSCC: Oral squamous cell carcinoma
ProstateThe image shows the transcriptomic changes along malignancy continuum.log2FC in expression of this searched gene in stem-like cells from each diseased tissue sample relative to stem-like cells in normal samples in each tissue plotted against the malignancy continuum. Samples are colored based on if they are from different disease stage.
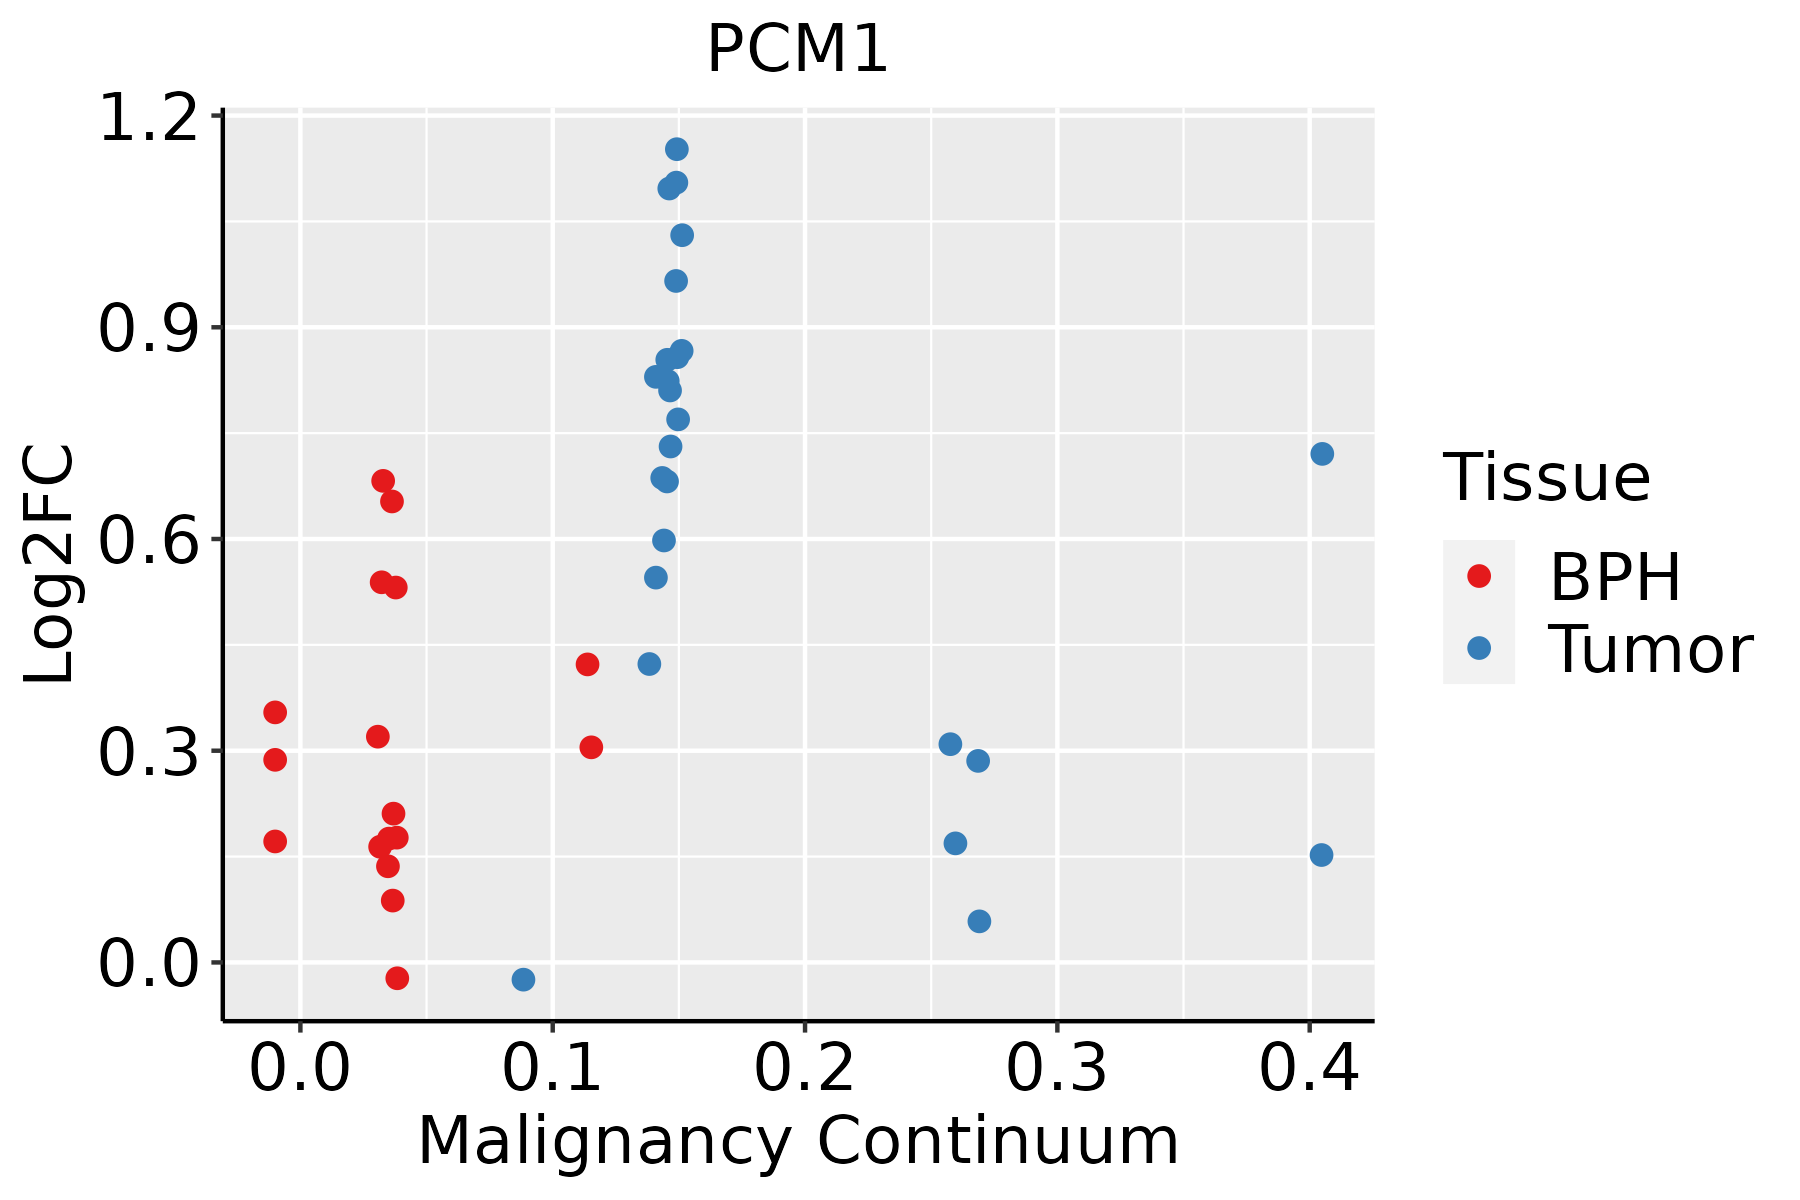
BPH: Benign Prostatic Hyperplasia
SkinThe image shows the transcriptomic changes along malignancy continuum.log2FC in expression of this searched gene in stem-like cells from each diseased tissue sample relative to stem-like cells in normal samples in each tissue plotted against the malignancy continuum. Samples are colored based on if they are from different disease stage.
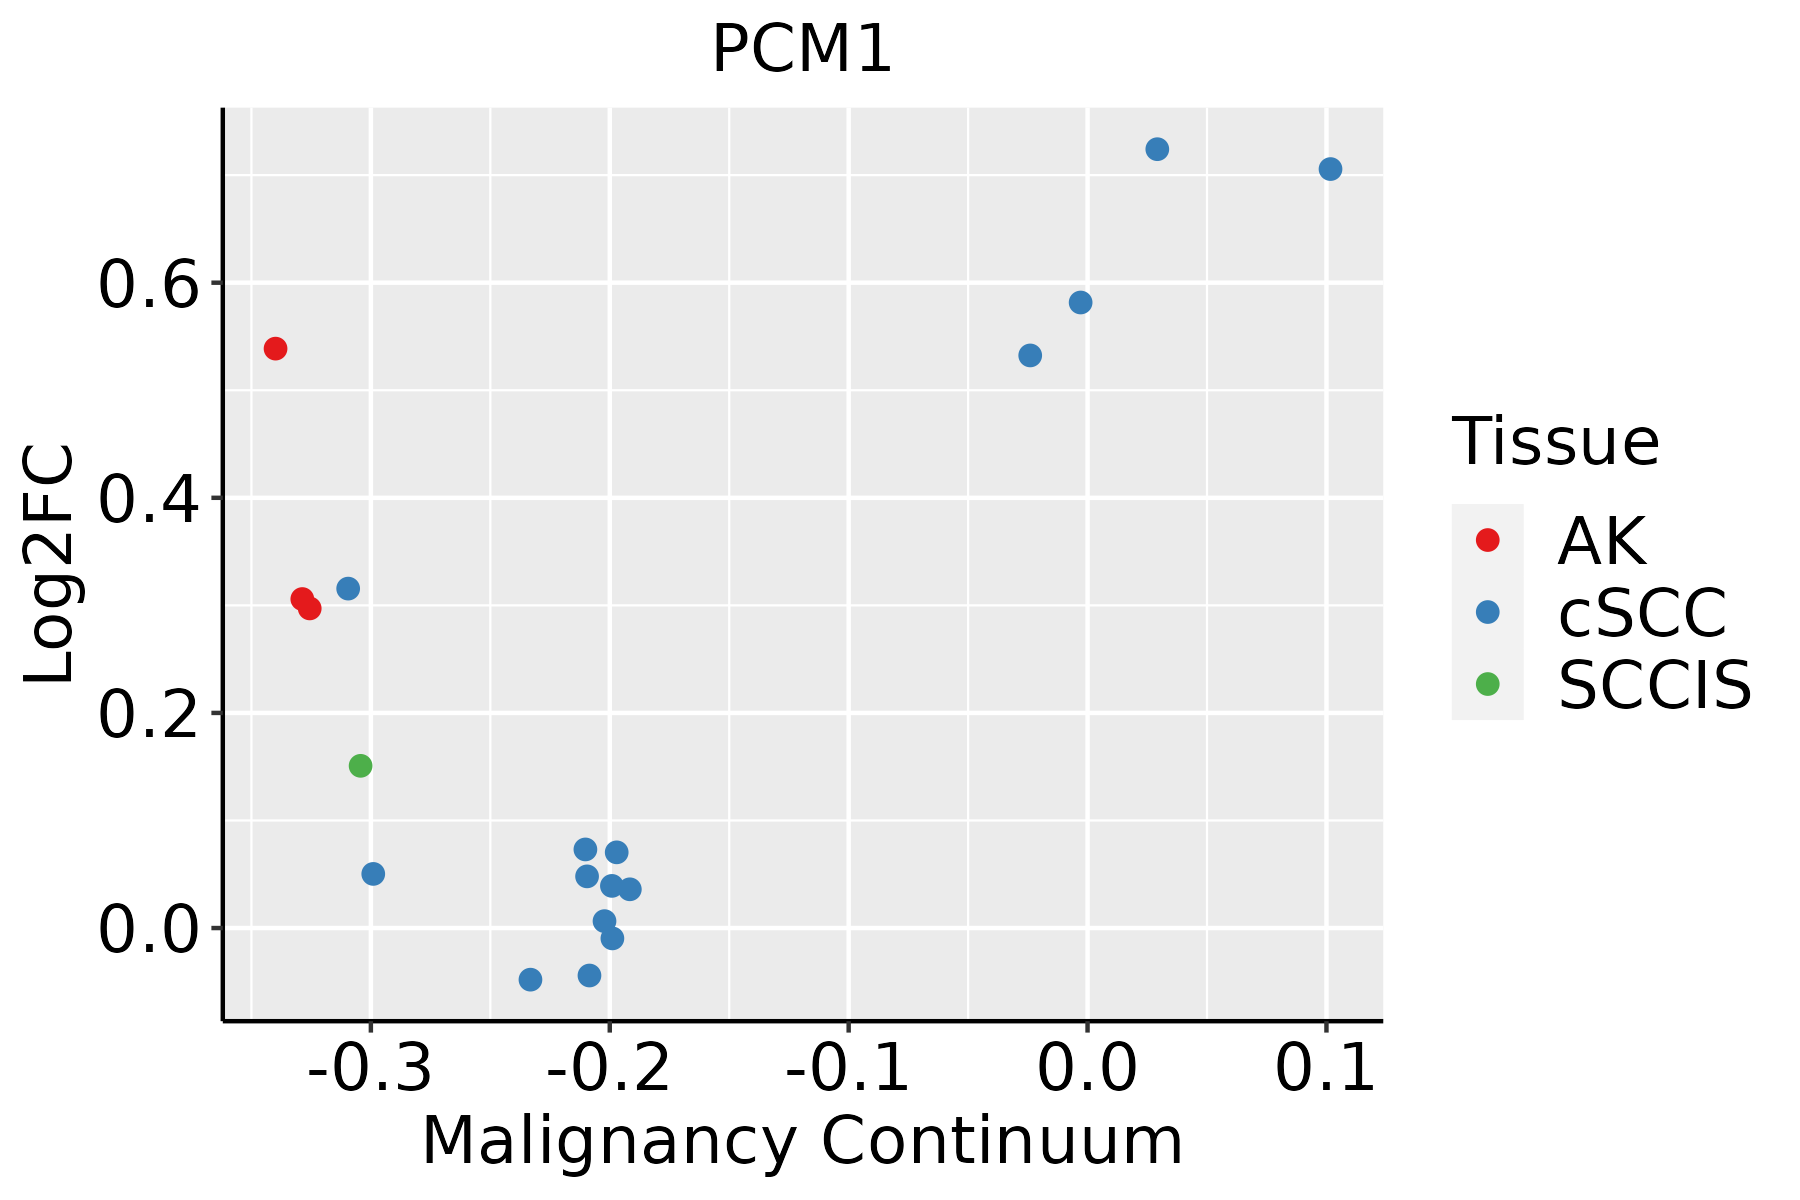
AK: Actinic keratosis
cSCC: Cutaneous squamous cell carcinoma
SCCIS:squamous cell carcinoma in situ
ThyroidThe image shows the transcriptomic changes along malignancy continuum.log2FC in expression of this searched gene in stem-like cells from each diseased tissue sample relative to stem-like cells in normal samples in each tissue plotted against the malignancy continuum. Samples are colored based on if they are from different disease stage.
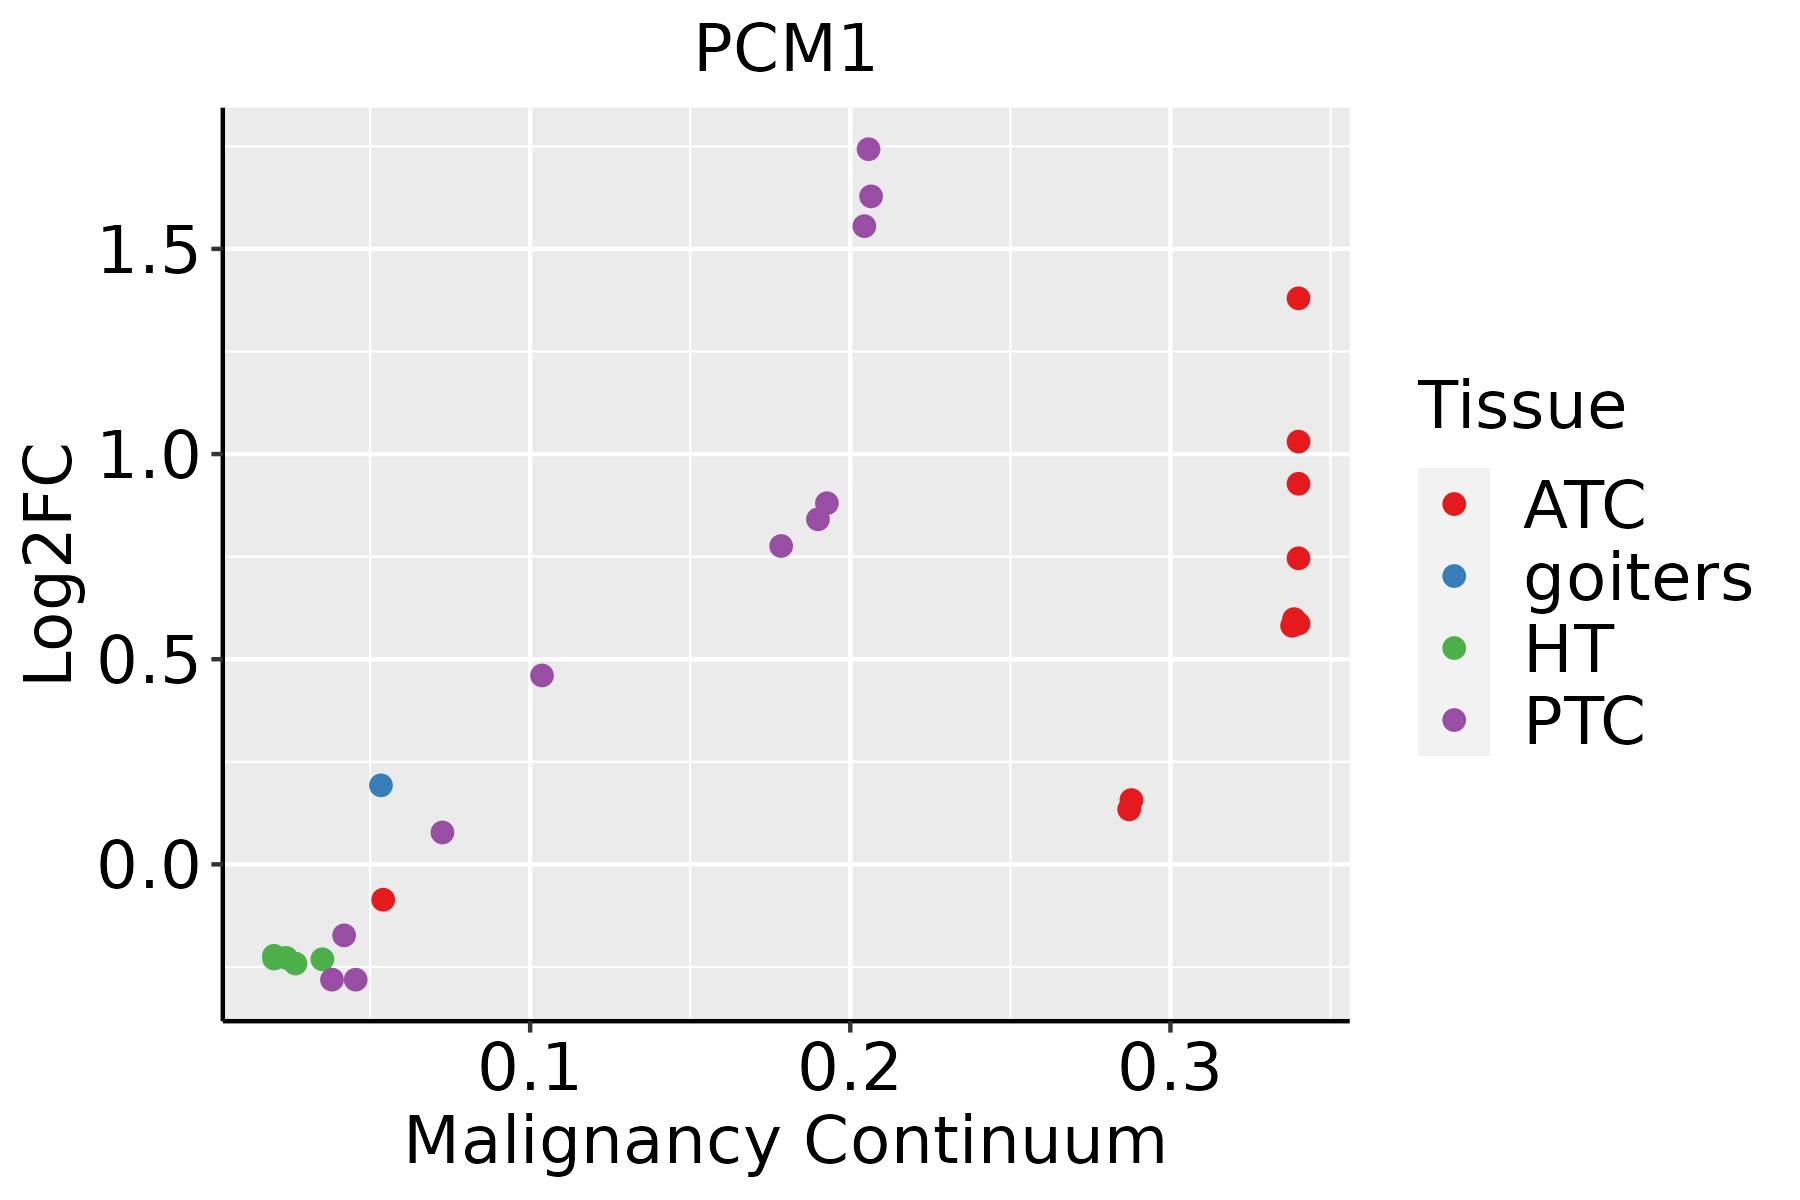
ATC: Anaplastic thyroid cancer
HT: Hashimoto's thyroiditis
PTC: Papillary thyroid cancer
∗log2FC in expression of this searched gene in stem-like cells from each diseased tissue sample relative to stem-like cells in normal samples in each tissue plotted against the malignancy continuum. Samples are colored based on if they are from different disease stage.

Top

Malignant transformation related pathway analysis

check buttonFind out the enriched GO biological processes and KEGG pathways involved in transition from healthy to precancer to cancer
check button Figure of enriched GO biological processes.
TissueDisease StageEnriched GO biological Processes
ColorectumADGO analysis - Figure of enriched GO biological processes: Top 15 enriched GO BP terms are showed in the bar plot of each disease state in each tissue. Each row represents a significant GO biological process which is colored according to the -log10(p.adjust).
ColorectumSERGO analysis - Figure of enriched GO biological processes: Top 15 enriched GO BP terms are showed in the bar plot of each disease state in each tissue. Each row represents a significant GO biological process which is colored according to the -log10(p.adjust).
ColorectumMSSGO analysis - Figure of enriched GO biological processes: Top 15 enriched GO BP terms are showed in the bar plot of each disease state in each tissue. Each row represents a significant GO biological process which is colored according to the -log10(p.adjust).
ColorectumMSI-HGO analysis - Figure of enriched GO biological processes: Top 15 enriched GO BP terms are showed in the bar plot of each disease state in each tissue. Each row represents a significant GO biological process which is colored according to the -log10(p.adjust).
ColorectumFAPGO analysis - Figure of enriched GO biological processes: Top 15 enriched GO BP terms are showed in the bar plot of each disease state in each tissue. Each row represents a significant GO biological process which is colored according to the -log10(p.adjust).
∗Top 15 enriched GO BP terms are showed in the bar plot of each disease state in each tissue. Each row represents a significant GO biological process which is colored according to the -log10(p.adjust).
Page: 1 2 3 4 5 6 7 8 9 

check button Enriched GO biological processes.
GO IDTissueDisease StageDescriptionGene RatioBg Ratiopvaluep.adjustCount
GO:1904951ColorectumADpositive regulation of establishment of protein localization112/3918319/187232.55e-091.80e-07112
GO:0051656ColorectumADestablishment of organelle localization131/3918390/187233.00e-092.06e-07131
GO:0051222ColorectumADpositive regulation of protein transport106/3918303/187238.45e-095.08e-07106
GO:0090316ColorectumADpositive regulation of intracellular protein transport62/3918160/187231.82e-077.79e-0662
GO:0032388ColorectumADpositive regulation of intracellular transport74/3918202/187231.83e-077.80e-0674
GO:0032386ColorectumADregulation of intracellular transport109/3918337/187235.33e-071.95e-05109
GO:0033157ColorectumADregulation of intracellular protein transport80/3918229/187235.81e-072.09e-0580
GO:0071539ColorectumADprotein localization to centrosome16/391833/187233.86e-044.41e-0316
GO:0030705ColorectumADcytoskeleton-dependent intracellular transport60/3918195/187237.56e-047.59e-0360
GO:1905508ColorectumADprotein localization to microtubule organizing center16/391835/187238.76e-048.51e-0316
GO:0050767ColorectumADregulation of neurogenesis99/3918364/187232.35e-031.82e-0299
GO:0007097ColorectumADnuclear migration10/391820/187233.67e-032.60e-0210
GO:0051647ColorectumADnucleus localization11/391824/187235.43e-033.55e-0211
GO:19049511ColorectumSERpositive regulation of establishment of protein localization91/2897319/187231.69e-091.68e-0791
GO:00512221ColorectumSERpositive regulation of protein transport85/2897303/187231.36e-081.05e-0685
GO:00331571ColorectumSERregulation of intracellular protein transport68/2897229/187233.41e-082.30e-0668
GO:00903161ColorectumSERpositive regulation of intracellular protein transport52/2897160/187235.64e-083.72e-0652
GO:00516561ColorectumSERestablishment of organelle localization100/2897390/187231.11e-076.79e-06100
GO:00323861ColorectumSERregulation of intracellular transport89/2897337/187231.34e-077.96e-0689
GO:00323881ColorectumSERpositive regulation of intracellular transport59/2897202/187234.98e-072.48e-0559
Page: 1 2 3 4 5 6 7 8 9 10 11 12 13 14 15 16 17 18 19 

check button Enriched KEGG pathways.
Pathway IDTissueDisease StageDescriptionGene RatioBg Ratiopvaluep.adjustqvalueCount
Page: 1 

Top

Cell-cell communication analysis

check buttonIdentification of potential cell-cell interactions between two cell types and their ligand-receptor pairs for different disease states
LigandReceptorLRpairPathwayTissueDisease Stage
Page: 1 

Top

Single-cell gene regulatory network inference analysis

check buttonFind out the significant the regulons (TFs) and the target genes of each regulon across cell types for different disease states
TFCell TypeTissueDisease StageTarget GeneRSSRegulon Activity
∗The dot plots of a searched regulon are shown for all cell subpopulations in each disease state of each tissue based on the regulon specific score inferred using pySCENIC and by calculating the average expression.
Page: 1 

Top

Somatic mutation of malignant transformation related genes

check buttonAnnotation of somatic variants for genes involved in malignant transformation
Hugo SymbolVariant ClassVariant ClassificationdbSNP RSHGVScHGVSpHGVSp ShortSWISSPROTBIOTYPESIFTPolyPhenTumor Sample BarcodeTissueHistologySexAgeStageTherapy TypesDrugsOutcome
PCM1SNVMissense_Mutationrs374857257c.5357N>Gp.Ser1786Cysp.S1786CQ15154protein_codingdeleterious(0)probably_damaging(0.999)TCGA-A7-A0DA-01Breastbreast invasive carcinomaFemale<65I/IIChemotherapyadriamycinSD
PCM1SNVMissense_Mutationnovelc.1067N>Ap.Ser356Tyrp.S356YQ15154protein_codingdeleterious(0)probably_damaging(0.999)TCGA-AN-A046-01Breastbreast invasive carcinomaFemale>=65I/IIUnknownUnknownSD
PCM1SNVMissense_Mutationc.3985N>Cp.Lys1329Glnp.K1329QQ15154protein_codingtolerated(0.46)benign(0.077)TCGA-E2-A1BD-01Breastbreast invasive carcinomaFemale<65I/IIHormone TherapyarimidexSD
PCM1insertionFrame_Shift_Insnovelc.142_143insGp.Asn48ArgfsTer2p.N48Rfs*2Q15154protein_codingTCGA-A7-A26I-01Breastbreast invasive carcinomaFemale>=65I/IIChemotherapycytoxanSD
PCM1insertionNonsense_Mutationnovelc.1270_1271insTCTAGGCTACTTATAp.His424delinsLeuTerAlaThrTyrAsnp.H424delinsL*ATYNQ15154protein_codingTCGA-A8-A07L-01Breastbreast invasive carcinomaFemale<65III/IVChemotherapyCR
PCM1insertionFrame_Shift_Insnovelc.2643_2644insGGGCAGATCATGAGGTCAGGTATTCAp.Arg882GlyfsTer26p.R882Gfs*26Q15154protein_codingTCGA-BH-A0AY-01Breastbreast invasive carcinomaFemale<65I/IIChemotherapySD
PCM1SNVMissense_Mutationrs768119487c.6034N>Gp.Thr2012Alap.T2012AQ15154protein_codingtolerated(0.59)benign(0.014)TCGA-2W-A8YY-01Cervixcervical & endocervical cancerFemale<65I/IIChemotherapycisplatinCR
PCM1SNVMissense_Mutationc.1435N>Ap.Glu479Lysp.E479KQ15154protein_codingdeleterious(0.01)probably_damaging(0.998)TCGA-EK-A3GK-01Cervixcervical & endocervical cancerFemale<65I/IIUnknownUnknownSD
PCM1SNVMissense_Mutationc.4408G>Cp.Asp1470Hisp.D1470HQ15154protein_codingdeleterious(0.01)probably_damaging(1)TCGA-Q1-A73O-01Cervixcervical & endocervical cancerFemale<65I/IIChemotherapycisplatinCR
PCM1SNVMissense_Mutationnovelc.3398C>Tp.Ser1133Leup.S1133LQ15154protein_codingdeleterious(0)benign(0.225)TCGA-VS-A954-01Cervixcervical & endocervical cancerFemale>=65III/IVChemotherapycisplatinCR
Page: 1 2 3 4 5 6 7 8 9 10 11 12 13 14 15 16 

Top

Related drugs of malignant transformation related genes

check buttonIdentification of chemicals and drugs interact with genes involved in malignant transfromation
(DGIdb 4.0)
Entrez IDSymbolCategoryInteraction TypesDrug Claim NameDrug NamePMIDs
Page: 1