
|
|||||
|
 | |
| |
| |
| |
| |
| |
|
Gene: PCLO |
Gene summary for PCLO |
| Gene information | Species | Human | Gene symbol | PCLO | Gene ID | 27445 |
| Gene name | piccolo presynaptic cytomatrix protein | |
| Gene Alias | ACZ | |
| Cytomap | 7q21.11 | |
| Gene Type | protein-coding | GO ID | GO:0001505 | UniProtAcc | Q9Y6V0 |
Top |
Malignant transformation analysis |
| Identification of the aberrant gene expression in precancerous and cancerous lesions by comparing the gene expression of stem-like cells in diseased tissues with normal stem cells |
| Entrez ID | Symbol | Replicates | Species | Organ | Tissue | Adj P-value | Log2FC | Malignancy |
| 27445 | PCLO | HTA11_3410_2000001011 | Human | Colorectum | AD | 1.61e-04 | -3.06e-01 | 0.0155 |
| 27445 | PCLO | HTA11_347_2000001011 | Human | Colorectum | AD | 6.10e-07 | 4.87e-01 | -0.1954 |
| 27445 | PCLO | HTA11_866_3004761011 | Human | Colorectum | AD | 2.93e-04 | -3.55e-01 | 0.096 |
| 27445 | PCLO | HTA11_10711_2000001011 | Human | Colorectum | AD | 2.37e-02 | -3.55e-01 | 0.0338 |
| 27445 | PCLO | HTA11_7696_3000711011 | Human | Colorectum | AD | 2.12e-06 | -3.06e-01 | 0.0674 |
| 27445 | PCLO | HTA11_99999970781_79442 | Human | Colorectum | MSS | 7.85e-16 | -4.36e-01 | 0.294 |
| 27445 | PCLO | HTA11_99999965104_69814 | Human | Colorectum | MSS | 2.66e-02 | 5.33e-01 | 0.281 |
| 27445 | PCLO | A015-C-203 | Human | Colorectum | FAP | 1.60e-09 | -1.04e-01 | -0.1294 |
| 27445 | PCLO | A002-C-201 | Human | Colorectum | FAP | 7.33e-03 | -9.02e-02 | 0.0324 |
| 27445 | PCLO | A001-C-108 | Human | Colorectum | FAP | 4.46e-03 | 3.11e-02 | -0.0272 |
| 27445 | PCLO | A002-C-205 | Human | Colorectum | FAP | 6.02e-07 | 7.51e-02 | -0.1236 |
| 27445 | PCLO | A015-C-006 | Human | Colorectum | FAP | 1.63e-03 | -2.59e-02 | -0.0994 |
| 27445 | PCLO | A015-C-106 | Human | Colorectum | FAP | 5.64e-03 | -6.35e-02 | -0.0511 |
| 27445 | PCLO | A002-C-114 | Human | Colorectum | FAP | 3.97e-04 | -1.29e-01 | -0.1561 |
| 27445 | PCLO | A015-C-104 | Human | Colorectum | FAP | 4.38e-08 | -6.65e-02 | -0.1899 |
| 27445 | PCLO | A002-C-016 | Human | Colorectum | FAP | 8.50e-08 | -6.14e-03 | 0.0521 |
| 27445 | PCLO | A002-C-116 | Human | Colorectum | FAP | 3.76e-09 | -2.58e-01 | -0.0452 |
| 27445 | PCLO | A014-C-008 | Human | Colorectum | FAP | 1.54e-04 | 1.04e-01 | -0.191 |
| 27445 | PCLO | A018-E-020 | Human | Colorectum | FAP | 1.00e-04 | -1.28e-01 | -0.2034 |
| 27445 | PCLO | F034 | Human | Colorectum | FAP | 5.30e-06 | 3.76e-02 | -0.0665 |
| Page: 1 2 3 4 5 |
| Tissue | Expression Dynamics | Abbreviation |
| Colorectum (GSE201348) |  | FAP: Familial adenomatous polyposis |
| CRC: Colorectal cancer | ||
| Colorectum (HTA11) |  | AD: Adenomas |
| SER: Sessile serrated lesions | ||
| MSI-H: Microsatellite-high colorectal cancer | ||
| MSS: Microsatellite stable colorectal cancer | ||
| Esophagus | 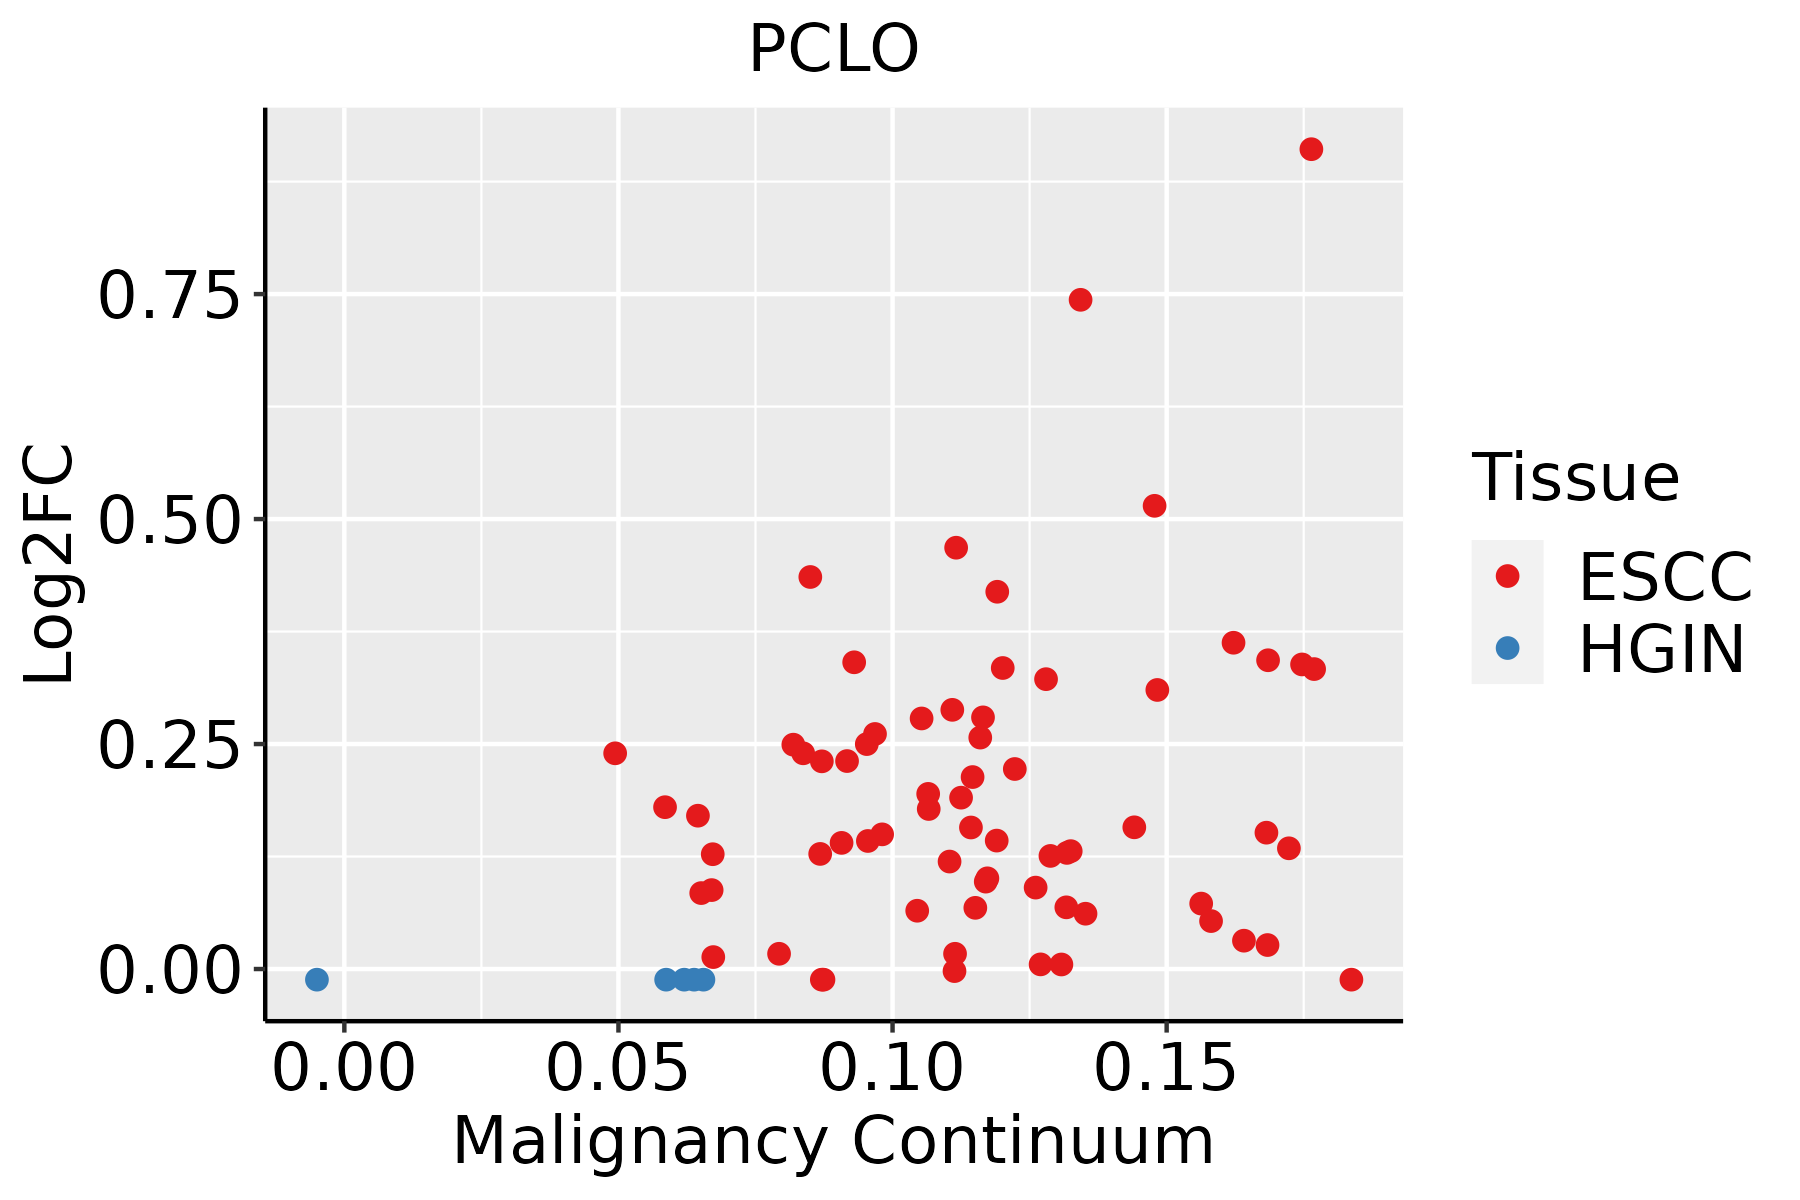 | ESCC: Esophageal squamous cell carcinoma |
| HGIN: High-grade intraepithelial neoplasias | ||
| LGIN: Low-grade intraepithelial neoplasias | ||
| Lung | 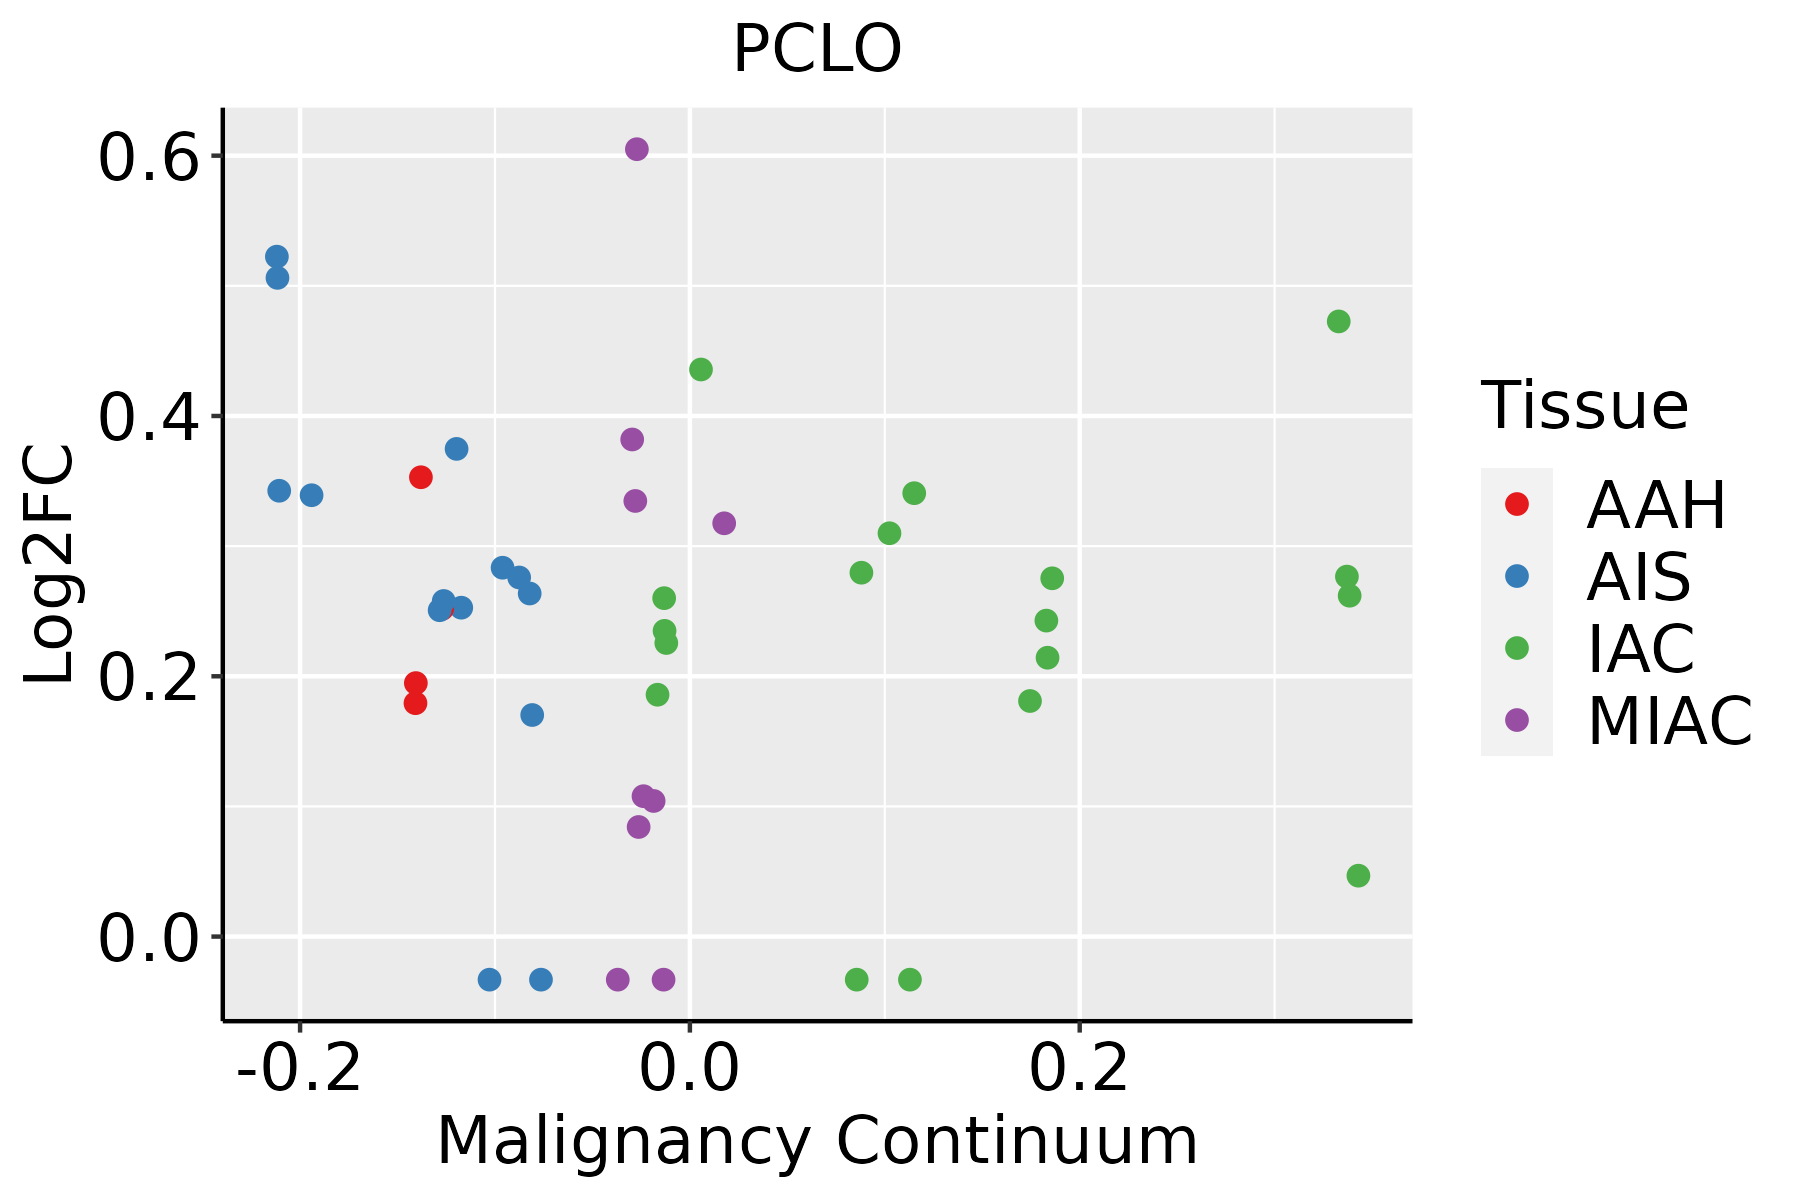 | AAH: Atypical adenomatous hyperplasia |
| AIS: Adenocarcinoma in situ | ||
| IAC: Invasive lung adenocarcinoma | ||
| MIA: Minimally invasive adenocarcinoma | ||
| Thyroid | 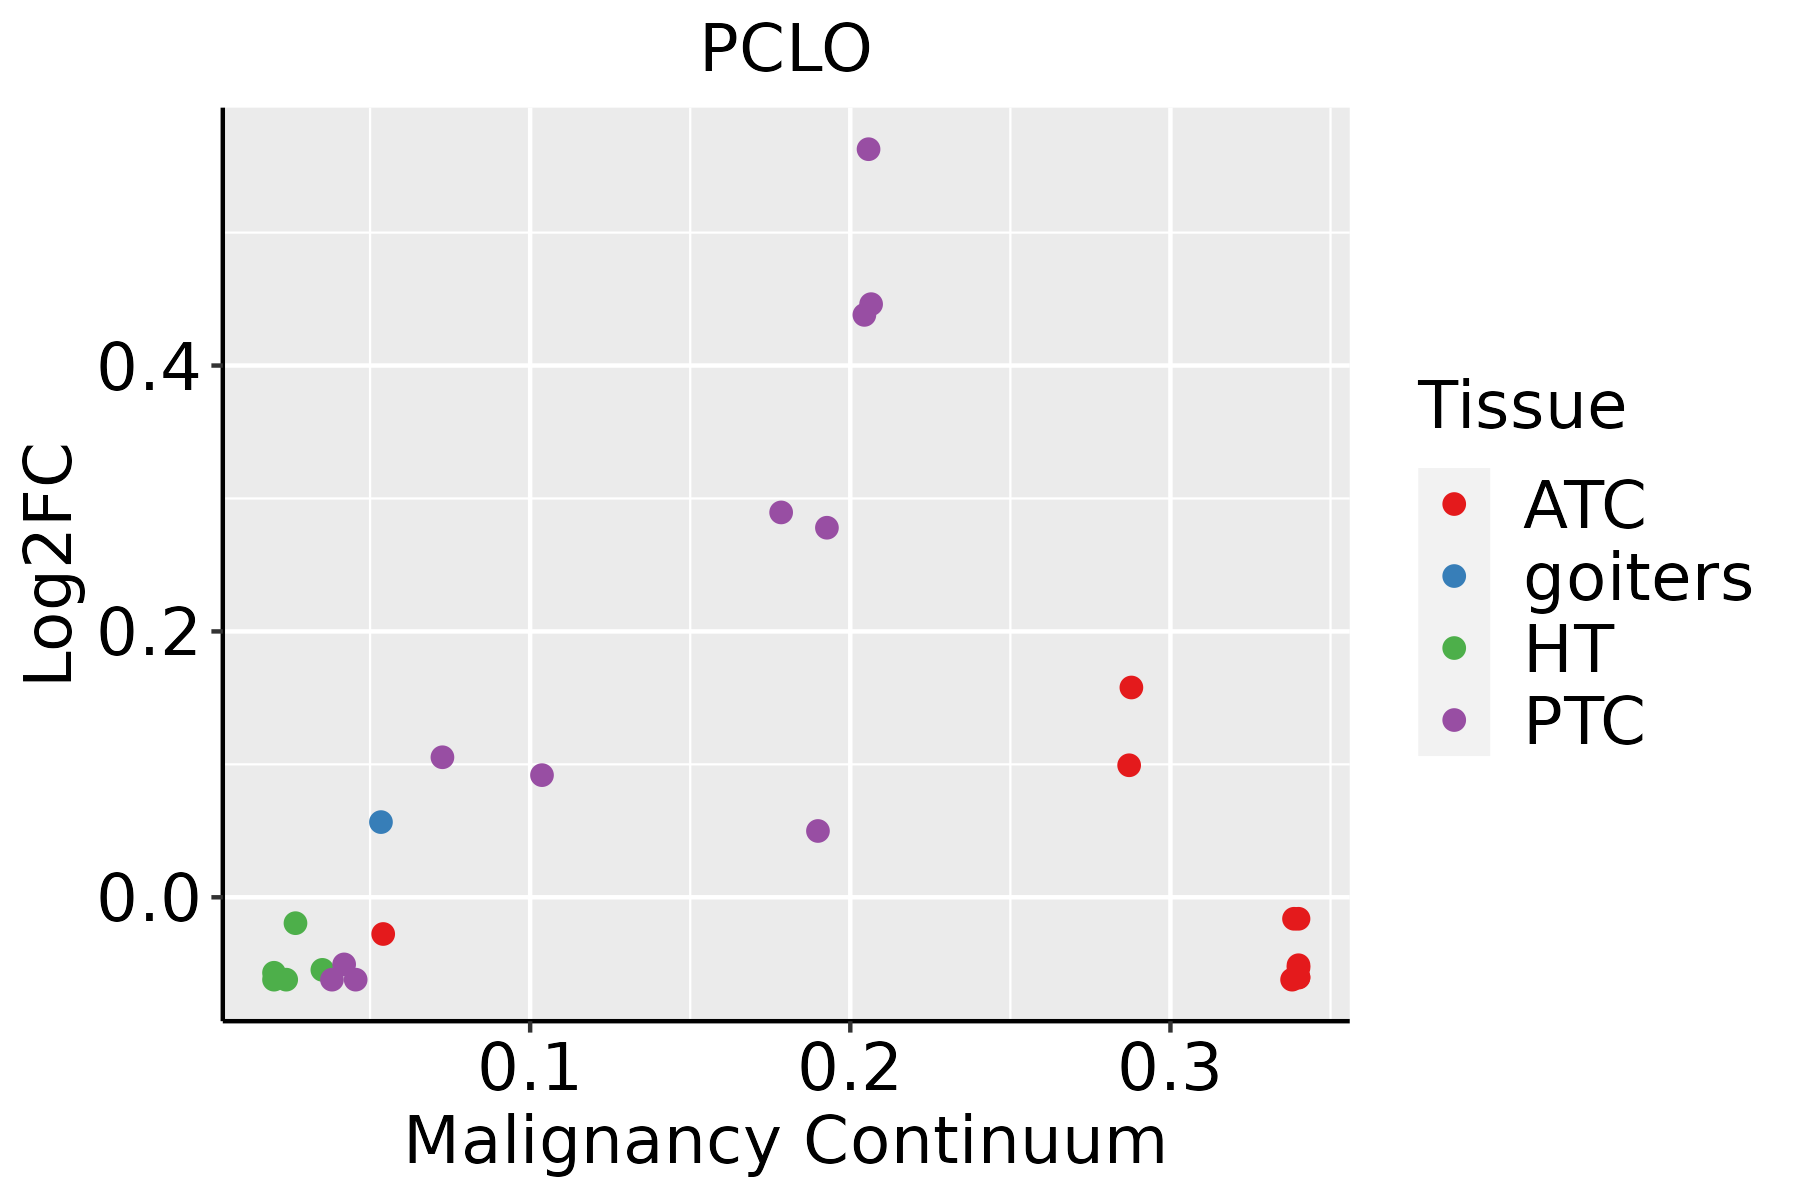 | ATC: Anaplastic thyroid cancer |
| HT: Hashimoto's thyroiditis | ||
| PTC: Papillary thyroid cancer |
| ∗log2FC in expression of this searched gene in stem-like cells from each diseased tissue sample relative to stem-like cells in normal samples in each tissue plotted against the malignancy continuum. Samples are colored based on if they are from different disease stage. |
Top |
Malignant transformation related pathway analysis |
| Find out the enriched GO biological processes and KEGG pathways involved in transition from healthy to precancer to cancer |
| Tissue | Disease Stage | Enriched GO biological Processes |
| Colorectum | AD |  |
| Colorectum | SER |  |
| Colorectum | MSS |  |
| Colorectum | MSI-H |  |
| Colorectum | FAP |  |
| ∗Top 15 enriched GO BP terms are showed in the bar plot of each disease state in each tissue. Each row represents a significant GO biological process which is colored according to the -log10(p.adjust). |
| Page: 1 2 3 4 5 6 7 8 9 |
| GO ID | Tissue | Disease Stage | Description | Gene Ratio | Bg Ratio | pvalue | p.adjust | Count |
| GO:0034329 | Colorectum | AD | cell junction assembly | 136/3918 | 420/18723 | 2.02e-08 | 1.15e-06 | 136 |
| GO:0051648 | Colorectum | AD | vesicle localization | 59/3918 | 177/18723 | 7.83e-05 | 1.25e-03 | 59 |
| GO:0043954 | Colorectum | AD | cellular component maintenance | 26/3918 | 61/18723 | 1.04e-04 | 1.56e-03 | 26 |
| GO:0009306 | Colorectum | AD | protein secretion | 105/3918 | 359/18723 | 1.05e-04 | 1.57e-03 | 105 |
| GO:0035592 | Colorectum | AD | establishment of protein localization to extracellular region | 105/3918 | 360/18723 | 1.18e-04 | 1.73e-03 | 105 |
| GO:0071692 | Colorectum | AD | protein localization to extracellular region | 106/3918 | 368/18723 | 1.86e-04 | 2.49e-03 | 106 |
| GO:0030073 | Colorectum | AD | insulin secretion | 61/3918 | 195/18723 | 4.28e-04 | 4.81e-03 | 61 |
| GO:0015833 | Colorectum | AD | peptide transport | 77/3918 | 264/18723 | 8.90e-04 | 8.60e-03 | 77 |
| GO:0030072 | Colorectum | AD | peptide hormone secretion | 68/3918 | 236/18723 | 2.39e-03 | 1.85e-02 | 68 |
| GO:0006887 | Colorectum | AD | exocytosis | 96/3918 | 352/18723 | 2.48e-03 | 1.90e-02 | 96 |
| GO:0034331 | Colorectum | AD | cell junction maintenance | 15/3918 | 35/18723 | 2.78e-03 | 2.09e-02 | 15 |
| GO:0002790 | Colorectum | AD | peptide secretion | 69/3918 | 242/18723 | 2.97e-03 | 2.22e-02 | 69 |
| GO:0017157 | Colorectum | AD | regulation of exocytosis | 59/3918 | 202/18723 | 3.20e-03 | 2.36e-02 | 59 |
| GO:0042886 | Colorectum | AD | amide transport | 83/3918 | 301/18723 | 3.37e-03 | 2.46e-02 | 83 |
| GO:0050808 | Colorectum | AD | synapse organization | 112/3918 | 426/18723 | 4.25e-03 | 2.92e-02 | 112 |
| GO:1902414 | Colorectum | AD | protein localization to cell junction | 31/3918 | 94/18723 | 4.30e-03 | 2.95e-02 | 31 |
| GO:0099003 | Colorectum | AD | vesicle-mediated transport in synapse | 57/3918 | 200/18723 | 6.53e-03 | 4.06e-02 | 57 |
| GO:00343292 | Colorectum | MSS | cell junction assembly | 120/3467 | 420/18723 | 2.51e-07 | 1.07e-05 | 120 |
| GO:00093062 | Colorectum | MSS | protein secretion | 98/3467 | 359/18723 | 2.43e-05 | 5.09e-04 | 98 |
| GO:00355922 | Colorectum | MSS | establishment of protein localization to extracellular region | 98/3467 | 360/18723 | 2.75e-05 | 5.58e-04 | 98 |
| Page: 1 2 3 4 5 |
| Pathway ID | Tissue | Disease Stage | Description | Gene Ratio | Bg Ratio | pvalue | p.adjust | qvalue | Count |
| hsa04911 | Colorectum | FAP | Insulin secretion | 23/1404 | 86/8465 | 1.12e-02 | 3.92e-02 | 2.38e-02 | 23 |
| hsa049111 | Colorectum | FAP | Insulin secretion | 23/1404 | 86/8465 | 1.12e-02 | 3.92e-02 | 2.38e-02 | 23 |
| hsa049112 | Colorectum | CRC | Insulin secretion | 20/1091 | 86/8465 | 5.61e-03 | 2.88e-02 | 1.95e-02 | 20 |
| hsa049113 | Colorectum | CRC | Insulin secretion | 20/1091 | 86/8465 | 5.61e-03 | 2.88e-02 | 1.95e-02 | 20 |
| Page: 1 |
Top |
Cell-cell communication analysis |
| Identification of potential cell-cell interactions between two cell types and their ligand-receptor pairs for different disease states |
| Ligand | Receptor | LRpair | Pathway | Tissue | Disease Stage |
| Page: 1 |
Top |
Single-cell gene regulatory network inference analysis |
| Find out the significant the regulons (TFs) and the target genes of each regulon across cell types for different disease states |
| TF | Cell Type | Tissue | Disease Stage | Target Gene | RSS | Regulon Activity |
| ∗The dot plots of a searched regulon are shown for all cell subpopulations in each disease state of each tissue based on the regulon specific score inferred using pySCENIC and by calculating the average expression. |
| Page: 1 |
Top |
Somatic mutation of malignant transformation related genes |
| Annotation of somatic variants for genes involved in malignant transformation |
| Hugo Symbol | Variant Class | Variant Classification | dbSNP RS | HGVSc | HGVSp | HGVSp Short | SWISSPROT | BIOTYPE | SIFT | PolyPhen | Tumor Sample Barcode | Tissue | Histology | Sex | Age | Stage | Therapy Types | Drugs | Outcome |
| PCLO | SNV | Missense_Mutation | c.15101N>A | p.Arg5034Lys | p.R5034K | Q9Y6V0 | protein_coding | deleterious(0) | probably_damaging(0.996) | TCGA-A8-A06Q-01 | Breast | breast invasive carcinoma | Female | <65 | III/IV | Unknown | Unknown | SD | |
| PCLO | SNV | Missense_Mutation | rs750875114 | c.12861N>G | p.Ser4287Arg | p.S4287R | Q9Y6V0 | protein_coding | deleterious(0.01) | possibly_damaging(0.788) | TCGA-A8-A06R-01 | Breast | breast invasive carcinoma | Female | >=65 | I/II | Chemotherapy | 5-fluorouracil | CR |
| PCLO | SNV | Missense_Mutation | c.12059G>T | p.Ser4020Ile | p.S4020I | Q9Y6V0 | protein_coding | deleterious(0) | probably_damaging(0.962) | TCGA-A8-A06X-01 | Breast | breast invasive carcinoma | Female | >=65 | I/II | Unknown | Unknown | SD | |
| PCLO | SNV | Missense_Mutation | rs201095081 | c.12058A>G | p.Ser4020Gly | p.S4020G | Q9Y6V0 | protein_coding | tolerated(0.07) | benign(0.083) | TCGA-A8-A06X-01 | Breast | breast invasive carcinoma | Female | >=65 | I/II | Unknown | Unknown | SD |
| PCLO | SNV | Missense_Mutation | rs368056917 | c.2860N>A | p.Pro954Thr | p.P954T | Q9Y6V0 | protein_coding | tolerated(0.13) | benign(0.003) | TCGA-A8-A06Z-01 | Breast | breast invasive carcinoma | Female | >=65 | I/II | Unknown | Unknown | SD |
| PCLO | SNV | Missense_Mutation | c.7667C>T | p.Ser2556Phe | p.S2556F | Q9Y6V0 | protein_coding | deleterious(0) | probably_damaging(0.999) | TCGA-A8-A075-01 | Breast | breast invasive carcinoma | Female | <65 | I/II | Chemotherapy | epirubicin | CR | |
| PCLO | SNV | Missense_Mutation | c.15227G>A | p.Arg5076Gln | p.R5076Q | Q9Y6V0 | protein_coding | deleterious(0) | probably_damaging(0.999) | TCGA-A8-A095-01 | Breast | breast invasive carcinoma | Female | <65 | I/II | Chemotherapy | 5-fluorouracil | CR | |
| PCLO | SNV | Missense_Mutation | c.12700G>C | p.Ala4234Pro | p.A4234P | Q9Y6V0 | protein_coding | deleterious(0) | probably_damaging(0.987) | TCGA-A8-A09Q-01 | Breast | breast invasive carcinoma | Female | >=65 | III/IV | Hormone Therapy | anastrozole | SD | |
| PCLO | SNV | Missense_Mutation | novel | c.2623T>C | p.Ser875Pro | p.S875P | Q9Y6V0 | protein_coding | tolerated(0.12) | benign(0.003) | TCGA-A8-A09Z-01 | Breast | breast invasive carcinoma | Female | >=65 | I/II | Unknown | Unknown | SD |
| PCLO | SNV | Missense_Mutation | rs371995456 | c.13316N>A | p.Arg4439His | p.R4439H | Q9Y6V0 | protein_coding | tolerated(0.07) | possibly_damaging(0.643) | TCGA-A8-A0A9-01 | Breast | breast invasive carcinoma | Female | >=65 | I/II | Hormone Therapy | anastrozole | SD |
| Page: 1 2 3 4 5 6 7 8 9 10 11 12 13 14 15 16 17 18 19 20 21 22 23 24 25 26 27 28 29 30 31 32 33 34 35 36 37 38 39 40 41 42 43 44 45 46 47 48 49 50 51 52 53 54 55 56 57 58 59 60 61 62 63 64 65 66 67 68 69 70 71 72 73 74 75 76 77 78 79 80 81 82 83 84 85 86 87 88 89 90 91 92 93 |
Top |
Related drugs of malignant transformation related genes |
| Identification of chemicals and drugs interact with genes involved in malignant transfromation |
| (DGIdb 4.0) |
| Entrez ID | Symbol | Category | Interaction Types | Drug Claim Name | Drug Name | PMIDs |
| Page: 1 |

Copyright 2023-Present -The University of Texas Health Science Center at Houston |