
|
|||||
|
 | |
| |
| |
| |
| |
| |
|
Gene: PCLAF |
Gene summary for PCLAF |
| Gene information | Species | Human | Gene symbol | PCLAF | Gene ID | 9768 |
| Gene name | PCNA clamp associated factor | |
| Gene Alias | KIAA0101 | |
| Cytomap | 15q22.31 | |
| Gene Type | protein-coding | GO ID | GO:0000226 | UniProtAcc | Q15004 |
Top |
Malignant transformation analysis |
| Identification of the aberrant gene expression in precancerous and cancerous lesions by comparing the gene expression of stem-like cells in diseased tissues with normal stem cells |
| Entrez ID | Symbol | Replicates | Species | Organ | Tissue | Adj P-value | Log2FC | Malignancy |
| 9768 | PCLAF | GSM4909281 | Human | Breast | IDC | 7.06e-10 | 3.84e-01 | 0.21 |
| 9768 | PCLAF | GSM4909282 | Human | Breast | IDC | 2.21e-79 | 1.42e+00 | -0.0288 |
| 9768 | PCLAF | GSM4909285 | Human | Breast | IDC | 1.84e-16 | 4.23e-01 | 0.21 |
| 9768 | PCLAF | GSM4909287 | Human | Breast | IDC | 4.94e-02 | 2.36e-01 | 0.2057 |
| 9768 | PCLAF | GSM4909290 | Human | Breast | IDC | 4.51e-05 | 3.61e-01 | 0.2096 |
| 9768 | PCLAF | GSM4909291 | Human | Breast | IDC | 2.91e-10 | 5.74e-01 | 0.1753 |
| 9768 | PCLAF | GSM4909296 | Human | Breast | IDC | 3.72e-08 | 3.89e-01 | 0.1524 |
| 9768 | PCLAF | GSM4909304 | Human | Breast | IDC | 1.97e-04 | 2.29e-01 | 0.1636 |
| 9768 | PCLAF | GSM4909307 | Human | Breast | IDC | 9.61e-05 | 3.47e-01 | 0.1569 |
| 9768 | PCLAF | GSM4909308 | Human | Breast | IDC | 1.90e-16 | 5.91e-01 | 0.158 |
| 9768 | PCLAF | M1 | Human | Breast | IDC | 3.23e-02 | 1.59e-01 | 0.1577 |
| 9768 | PCLAF | M2 | Human | Breast | IDC | 1.40e-02 | 5.09e-01 | 0.21 |
| 9768 | PCLAF | NCCBC5 | Human | Breast | DCIS | 1.22e-02 | 3.49e-01 | 0.2046 |
| 9768 | PCLAF | AEH-subject3 | Human | Endometrium | AEH | 3.29e-02 | 1.24e-01 | -0.2576 |
| 9768 | PCLAF | AEH-subject5 | Human | Endometrium | AEH | 1.75e-04 | 1.43e-01 | -0.2953 |
| 9768 | PCLAF | EEC-subject1 | Human | Endometrium | EEC | 1.82e-05 | 1.67e-01 | -0.2682 |
| 9768 | PCLAF | EEC-subject5 | Human | Endometrium | EEC | 4.06e-07 | 2.67e-01 | -0.249 |
| 9768 | PCLAF | GSM5276935 | Human | Endometrium | EEC | 8.15e-11 | 2.28e-01 | -0.123 |
| 9768 | PCLAF | GSM6177620_NYU_UCEC1_lib1_lib1 | Human | Endometrium | EEC | 7.55e-08 | 3.96e-01 | -0.1869 |
| 9768 | PCLAF | GSM6177620_NYU_UCEC1_lib2_lib2 | Human | Endometrium | EEC | 1.85e-05 | 3.46e-01 | -0.1875 |
| Page: 1 2 3 4 |
| Tissue | Expression Dynamics | Abbreviation |
| Breast |  | IDC: Invasive ductal carcinoma |
| DCIS: Ductal carcinoma in situ | ||
| Precancer(BRCA1-mut): Precancerous lesion from BRCA1 mutation carriers | ||
| Endometrium | 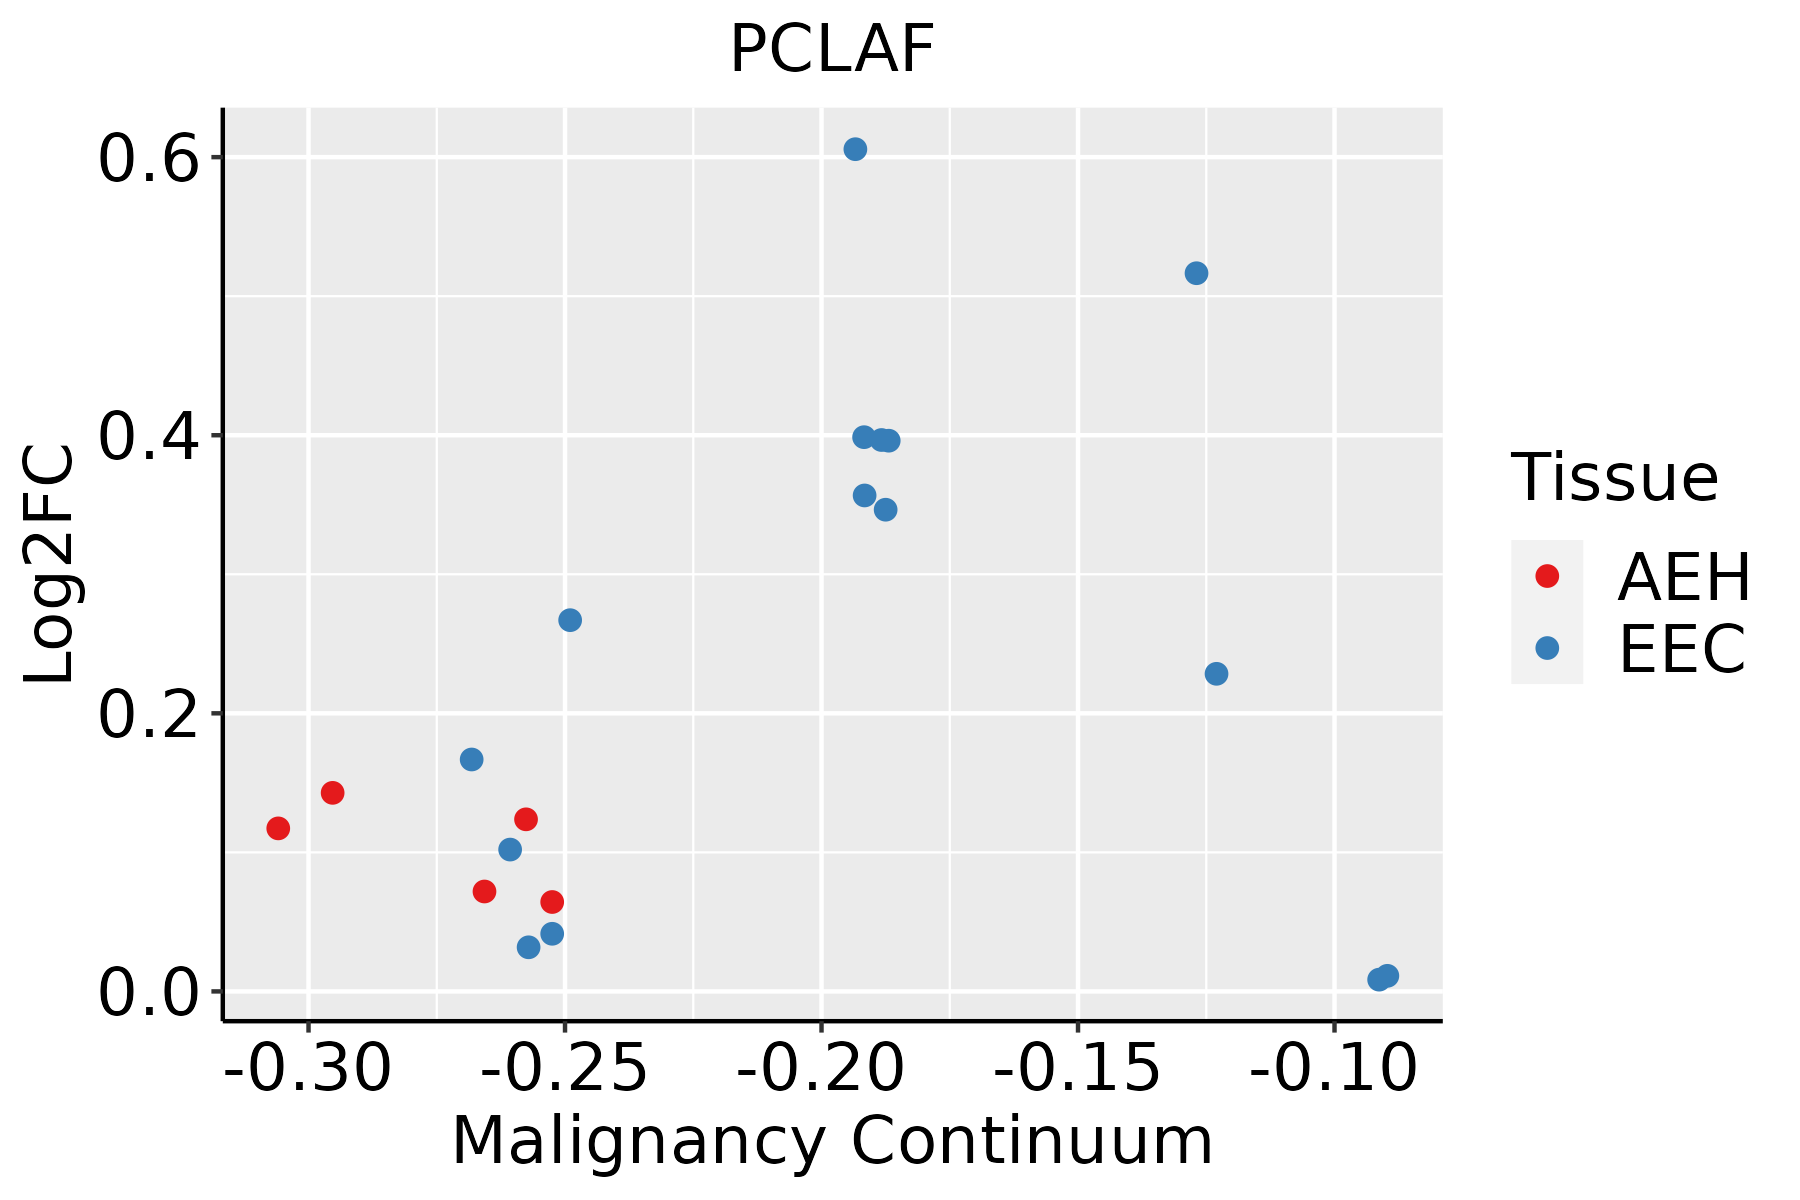 | AEH: Atypical endometrial hyperplasia |
| EEC: Endometrioid Cancer | ||
| Esophagus | 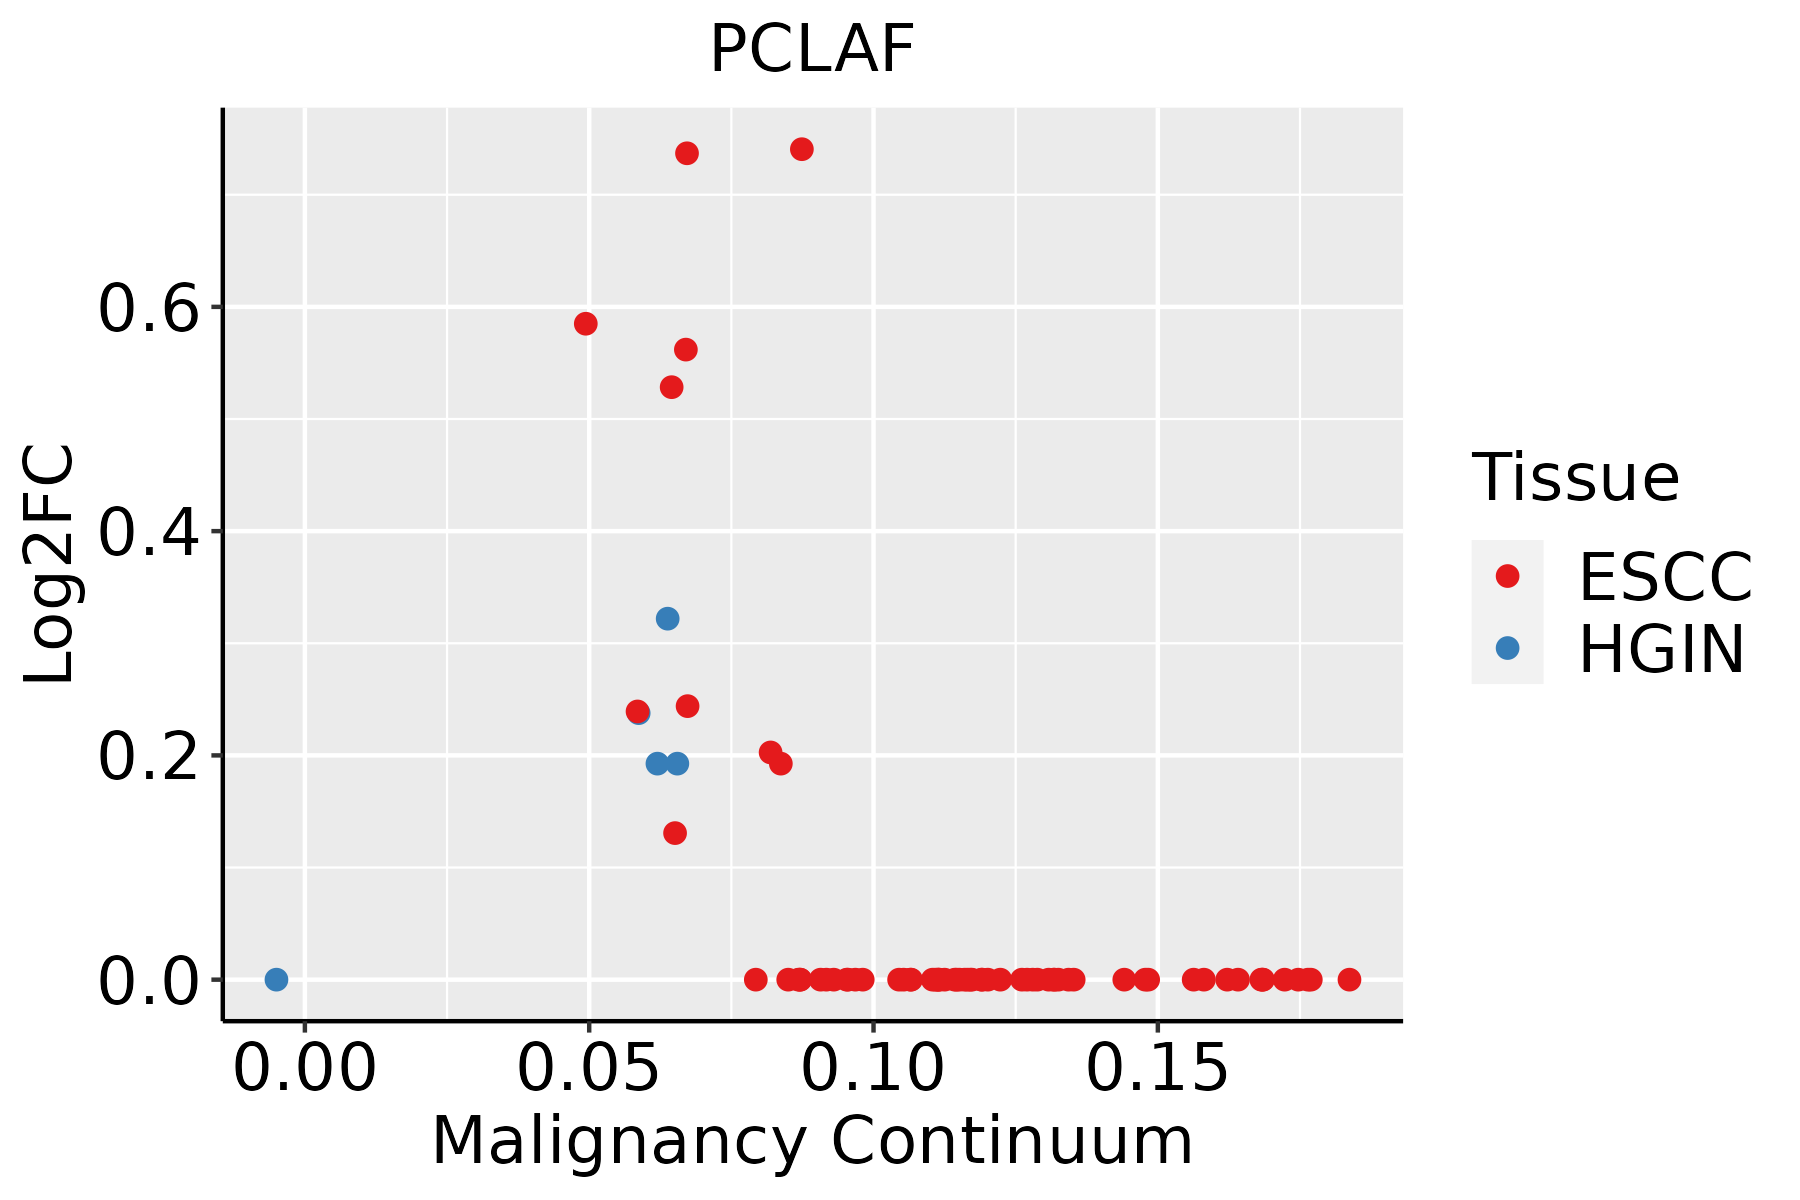 | ESCC: Esophageal squamous cell carcinoma |
| HGIN: High-grade intraepithelial neoplasias | ||
| LGIN: Low-grade intraepithelial neoplasias | ||
| GC | 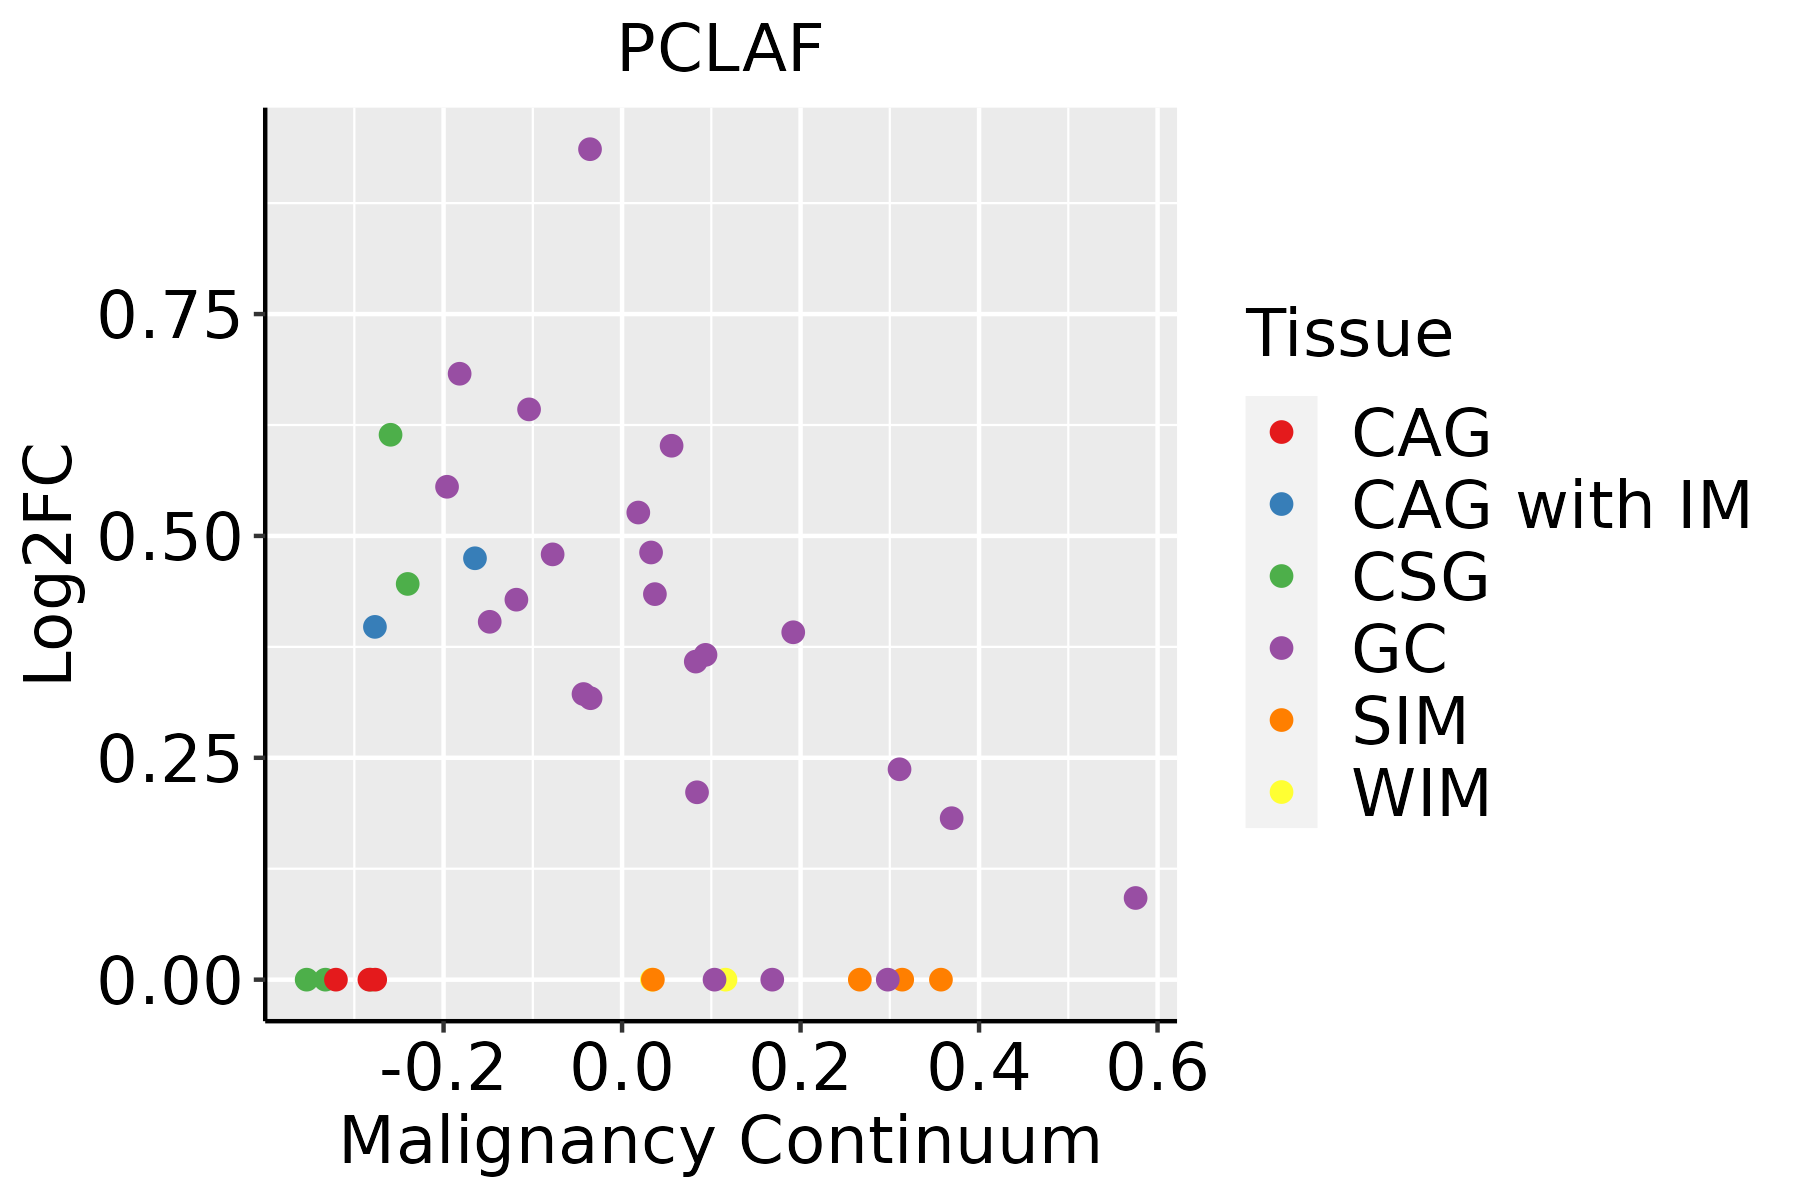 | CAG: Chronic atrophic gastritis |
| CAG with IM: Chronic atrophic gastritis with intestinal metaplasia | ||
| CSG: Chronic superficial gastritis | ||
| GC: Gastric cancer | ||
| SIM: Severe intestinal metaplasia | ||
| WIM: Wild intestinal metaplasia | ||
| Liver |  | HCC: Hepatocellular carcinoma |
| NAFLD: Non-alcoholic fatty liver disease | ||
| Thyroid | 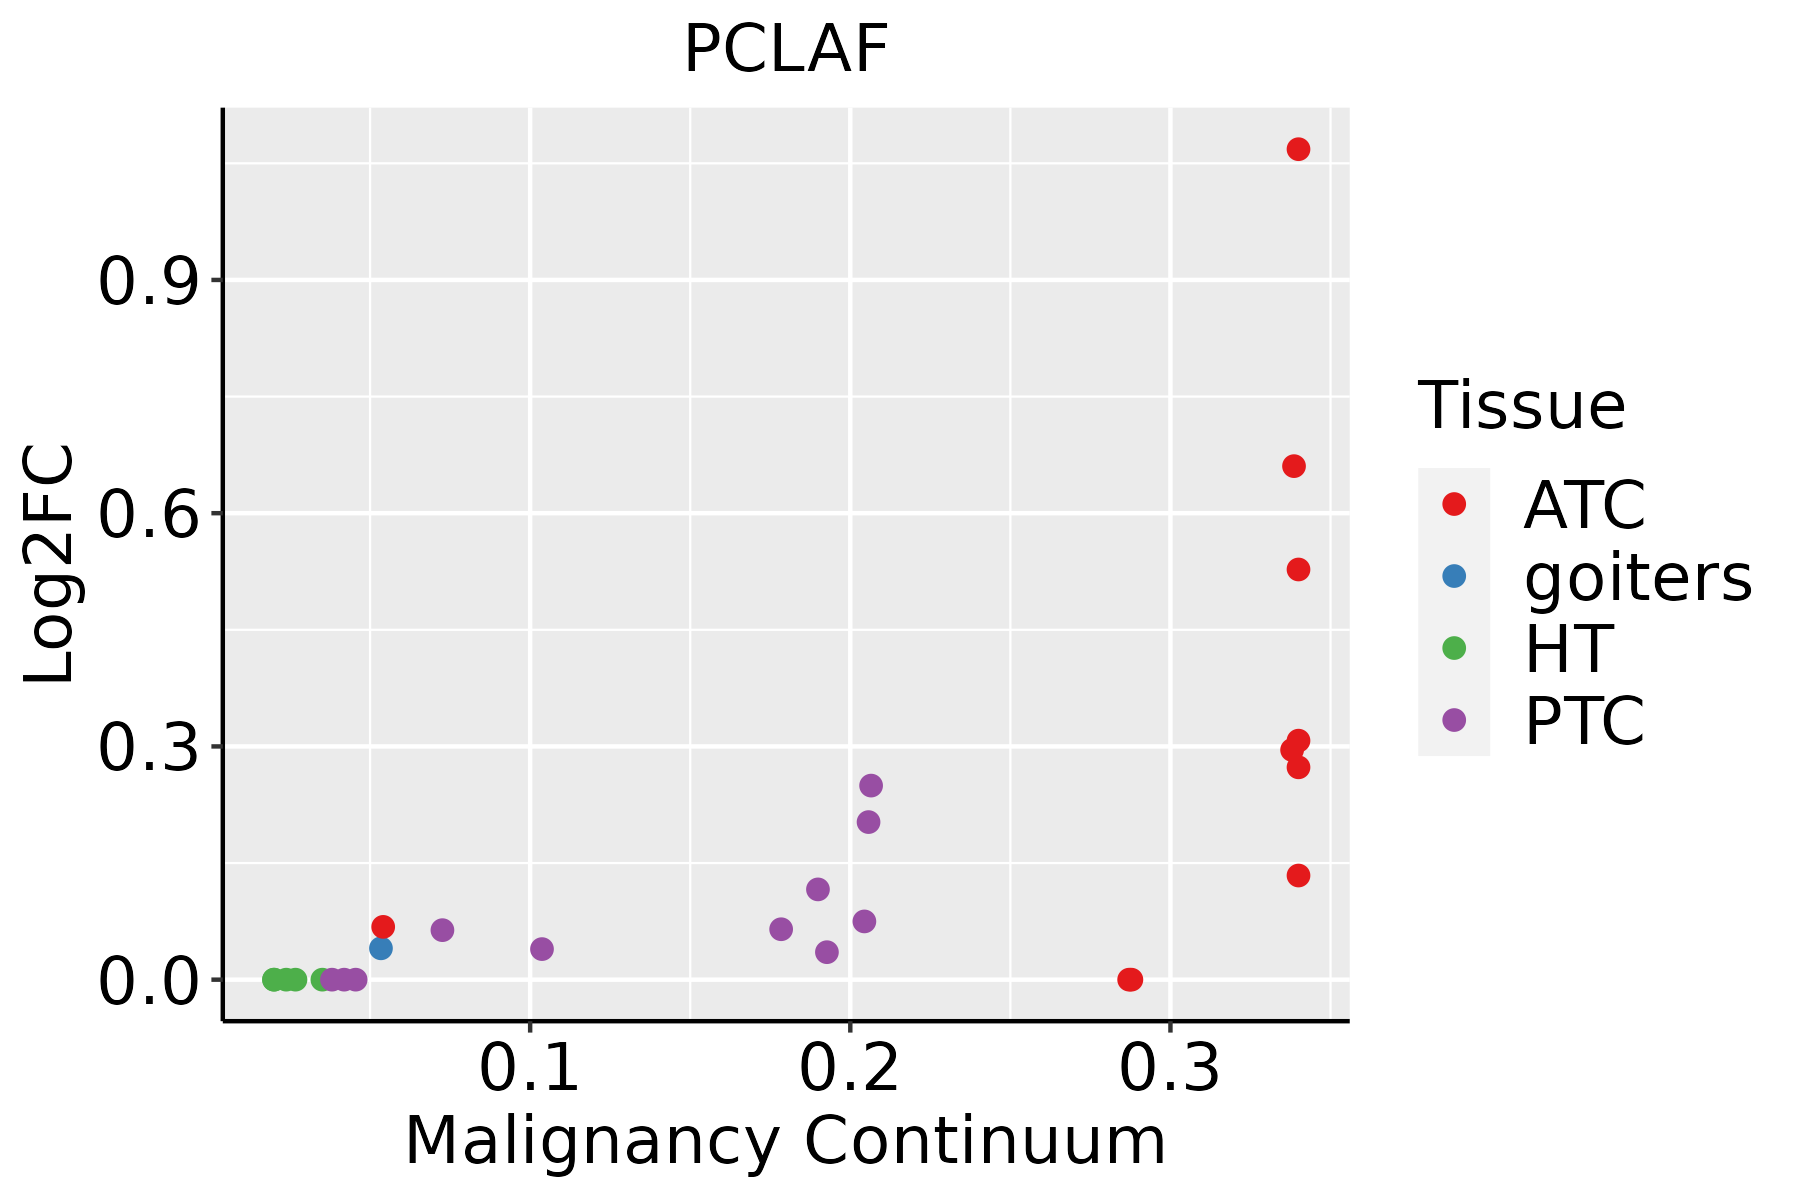 | ATC: Anaplastic thyroid cancer |
| HT: Hashimoto's thyroiditis | ||
| PTC: Papillary thyroid cancer |
| ∗log2FC in expression of this searched gene in stem-like cells from each diseased tissue sample relative to stem-like cells in normal samples in each tissue plotted against the malignancy continuum. Samples are colored based on if they are from different disease stage. |
Top |
Malignant transformation related pathway analysis |
| Find out the enriched GO biological processes and KEGG pathways involved in transition from healthy to precancer to cancer |
| Tissue | Disease Stage | Enriched GO biological Processes |
| Colorectum | AD |  |
| Colorectum | SER |  |
| Colorectum | MSS |  |
| Colorectum | MSI-H |  |
| Colorectum | FAP |  |
| ∗Top 15 enriched GO BP terms are showed in the bar plot of each disease state in each tissue. Each row represents a significant GO biological process which is colored according to the -log10(p.adjust). |
| Page: 1 2 3 4 5 6 7 8 9 |
| GO ID | Tissue | Disease Stage | Description | Gene Ratio | Bg Ratio | pvalue | p.adjust | Count |
| GO:000931412 | Breast | IDC | response to radiation | 62/1434 | 456/18723 | 6.91e-06 | 2.10e-04 | 62 |
| GO:00718976 | Breast | IDC | DNA biosynthetic process | 26/1434 | 180/18723 | 1.28e-03 | 1.35e-02 | 26 |
| GO:000931422 | Breast | DCIS | response to radiation | 62/1390 | 456/18723 | 2.56e-06 | 8.87e-05 | 62 |
| GO:007189712 | Breast | DCIS | DNA biosynthetic process | 24/1390 | 180/18723 | 3.74e-03 | 3.01e-02 | 24 |
| GO:00094111 | Breast | DCIS | response to UV | 20/1390 | 149/18723 | 7.13e-03 | 4.85e-02 | 20 |
| GO:00718977 | Endometrium | AEH | DNA biosynthetic process | 37/2100 | 180/18723 | 1.87e-04 | 2.39e-03 | 37 |
| GO:000931410 | Endometrium | AEH | response to radiation | 70/2100 | 456/18723 | 3.99e-03 | 2.68e-02 | 70 |
| GO:007189713 | Endometrium | EEC | DNA biosynthetic process | 39/2168 | 180/18723 | 7.68e-05 | 1.11e-03 | 39 |
| GO:000931413 | Endometrium | EEC | response to radiation | 71/2168 | 456/18723 | 5.69e-03 | 3.42e-02 | 71 |
| GO:000941113 | Esophagus | ESCC | response to UV | 115/8552 | 149/18723 | 3.29e-15 | 1.93e-13 | 115 |
| GO:00062604 | Esophagus | ESCC | DNA replication | 181/8552 | 260/18723 | 3.55e-15 | 2.05e-13 | 181 |
| GO:007189716 | Esophagus | ESCC | DNA biosynthetic process | 127/8552 | 180/18723 | 1.04e-11 | 3.85e-10 | 127 |
| GO:000931419 | Esophagus | ESCC | response to radiation | 277/8552 | 456/18723 | 4.42e-11 | 1.43e-09 | 277 |
| GO:00070982 | Esophagus | ESCC | centrosome cycle | 85/8552 | 130/18723 | 4.41e-06 | 4.69e-05 | 85 |
| GO:00310233 | Esophagus | ESCC | microtubule organizing center organization | 92/8552 | 143/18723 | 5.04e-06 | 5.31e-05 | 92 |
| GO:00063012 | Esophagus | ESCC | postreplication repair | 26/8552 | 31/18723 | 1.32e-05 | 1.21e-04 | 26 |
| GO:000941611 | Esophagus | ESCC | response to light stimulus | 183/8552 | 320/18723 | 2.03e-05 | 1.76e-04 | 183 |
| GO:0019985 | Esophagus | ESCC | translesion synthesis | 17/8552 | 21/18723 | 1.03e-03 | 5.19e-03 | 17 |
| GO:00062601 | Liver | HCC | DNA replication | 146/7958 | 260/18723 | 5.68e-06 | 7.02e-05 | 146 |
| GO:0009411 | Liver | HCC | response to UV | 85/7958 | 149/18723 | 2.34e-04 | 1.77e-03 | 85 |
| Page: 1 2 |
| Pathway ID | Tissue | Disease Stage | Description | Gene Ratio | Bg Ratio | pvalue | p.adjust | qvalue | Count |
| Page: 1 |
Top |
Cell-cell communication analysis |
| Identification of potential cell-cell interactions between two cell types and their ligand-receptor pairs for different disease states |
| Ligand | Receptor | LRpair | Pathway | Tissue | Disease Stage |
| Page: 1 |
Top |
Single-cell gene regulatory network inference analysis |
| Find out the significant the regulons (TFs) and the target genes of each regulon across cell types for different disease states |
| TF | Cell Type | Tissue | Disease Stage | Target Gene | RSS | Regulon Activity |
| ∗The dot plots of a searched regulon are shown for all cell subpopulations in each disease state of each tissue based on the regulon specific score inferred using pySCENIC and by calculating the average expression. |
| Page: 1 |
Top |
Somatic mutation of malignant transformation related genes |
| Annotation of somatic variants for genes involved in malignant transformation |
| Hugo Symbol | Variant Class | Variant Classification | dbSNP RS | HGVSc | HGVSp | HGVSp Short | SWISSPROT | BIOTYPE | SIFT | PolyPhen | Tumor Sample Barcode | Tissue | Histology | Sex | Age | Stage | Therapy Types | Drugs | Outcome |
| PCLAF | SNV | Missense_Mutation | c.227C>G | p.Ser76Cys | p.S76C | Q15004 | protein_coding | tolerated(0.06) | possibly_damaging(0.639) | TCGA-FU-A3WB-01 | Cervix | cervical & endocervical cancer | Female | <65 | I/II | Chemotherapy | cisplatin | CR | |
| PCLAF | SNV | Missense_Mutation | c.293N>T | p.Ala98Val | p.A98V | Q15004 | protein_coding | tolerated(0.26) | benign(0) | TCGA-AA-3811-01 | Colorectum | colon adenocarcinoma | Female | >=65 | III/IV | Unknown | Unknown | PD | |
| PCLAF | insertion | Frame_Shift_Ins | novel | c.189_190insA | p.Gly64ArgfsTer7 | p.G64Rfs*7 | Q15004 | protein_coding | TCGA-AU-6004-01 | Colorectum | colon adenocarcinoma | Female | >=65 | I/II | Unknown | Unknown | SD | ||
| PCLAF | SNV | Missense_Mutation | novel | c.56N>T | p.Ala19Val | p.A19V | Q15004 | protein_coding | tolerated(0.06) | benign(0.05) | TCGA-A5-A0G2-01 | Endometrium | uterine corpus endometrioid carcinoma | Female | <65 | III/IV | Unknown | Unknown | SD |
| PCLAF | SNV | Missense_Mutation | novel | c.319N>C | p.Asn107His | p.N107H | Q15004 | protein_coding | deleterious(0) | benign(0.124) | TCGA-B5-A3FC-01 | Endometrium | uterine corpus endometrioid carcinoma | Female | <65 | I/II | Unknown | Unknown | SD |
| PCLAF | SNV | Missense_Mutation | c.287G>T | p.Arg96Ile | p.R96I | Q15004 | protein_coding | deleterious(0) | possibly_damaging(0.549) | TCGA-BS-A0UF-01 | Endometrium | uterine corpus endometrioid carcinoma | Female | >=65 | I/II | Unknown | Unknown | SD | |
| PCLAF | SNV | Missense_Mutation | rs779642598 | c.204N>A | p.Phe68Leu | p.F68L | Q15004 | protein_coding | deleterious(0) | probably_damaging(0.994) | TCGA-D1-A17Q-01 | Endometrium | uterine corpus endometrioid carcinoma | Female | <65 | I/II | Unknown | Unknown | SD |
| PCLAF | SNV | Missense_Mutation | novel | c.312T>G | p.Asp104Glu | p.D104E | Q15004 | protein_coding | tolerated(0.2) | benign(0.419) | TCGA-PG-A917-01 | Endometrium | uterine corpus endometrioid carcinoma | Female | >=65 | I/II | Unknown | Unknown | SD |
| PCLAF | SNV | Missense_Mutation | c.148N>T | p.Gly50Trp | p.G50W | Q15004 | protein_coding | deleterious(0) | probably_damaging(1) | TCGA-62-A46O-01 | Lung | lung adenocarcinoma | Female | >=65 | I/II | Unknown | Unknown | PD | |
| PCLAF | SNV | Missense_Mutation | c.167N>C | p.Arg56Pro | p.R56P | Q15004 | protein_coding | deleterious(0) | possibly_damaging(0.875) | TCGA-18-3421-01 | Lung | lung squamous cell carcinoma | Male | >=65 | I/II | Unknown | Unknown | SD |
| Page: 1 2 |
Top |
Related drugs of malignant transformation related genes |
| Identification of chemicals and drugs interact with genes involved in malignant transfromation |
| (DGIdb 4.0) |
| Entrez ID | Symbol | Category | Interaction Types | Drug Claim Name | Drug Name | PMIDs |
| 9768 | PCLAF | TUMOR SUPPRESSOR | Indol-3-carbinol |
| Page: 1 |

Copyright 2023-Present -The University of Texas Health Science Center at Houston |