| Tissue | Expression Dynamics | Abbreviation |
| Colorectum (GSE201348) |  | FAP: Familial adenomatous polyposis |
| CRC: Colorectal cancer |
| Colorectum (HTA11) |  | AD: Adenomas |
| SER: Sessile serrated lesions |
| MSI-H: Microsatellite-high colorectal cancer |
| MSS: Microsatellite stable colorectal cancer |
| Esophagus | 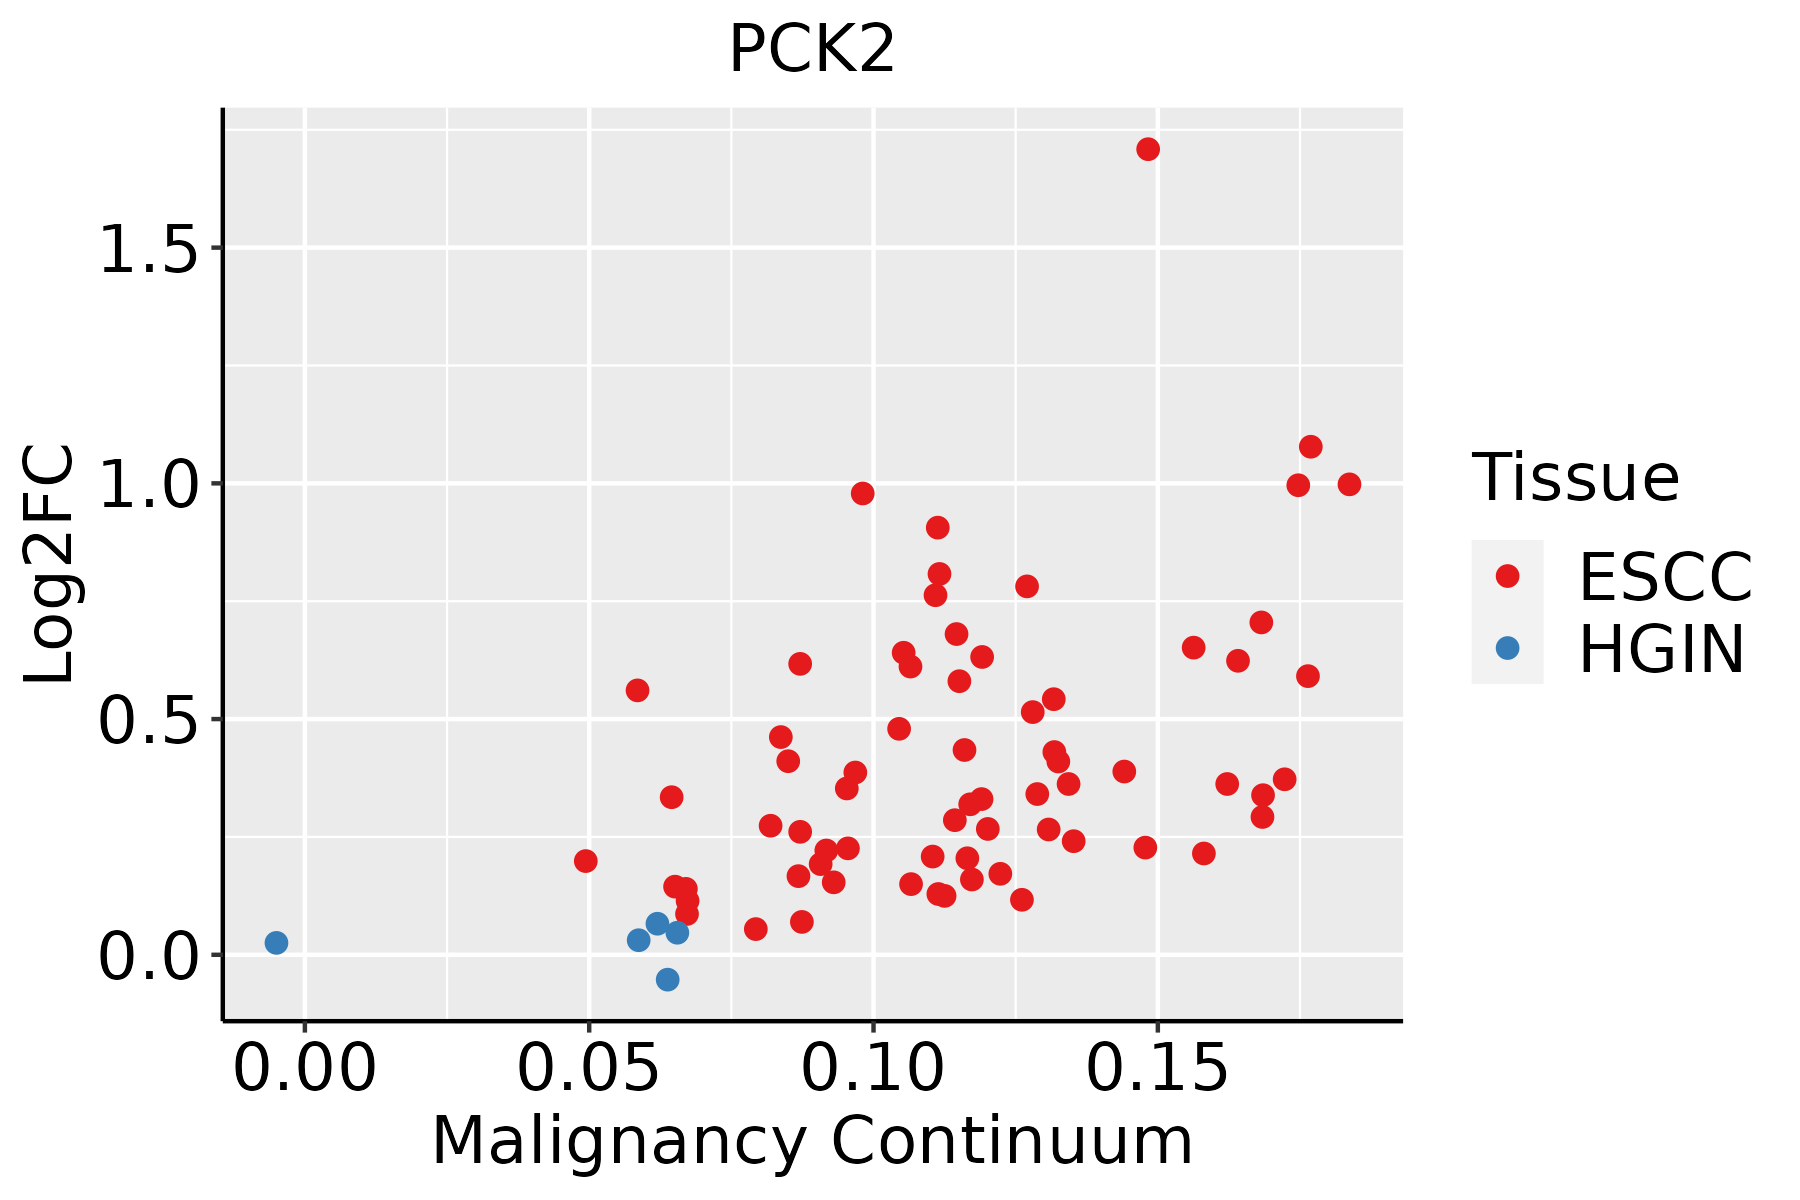 | ESCC: Esophageal squamous cell carcinoma |
| HGIN: High-grade intraepithelial neoplasias |
| LGIN: Low-grade intraepithelial neoplasias |
| GC | 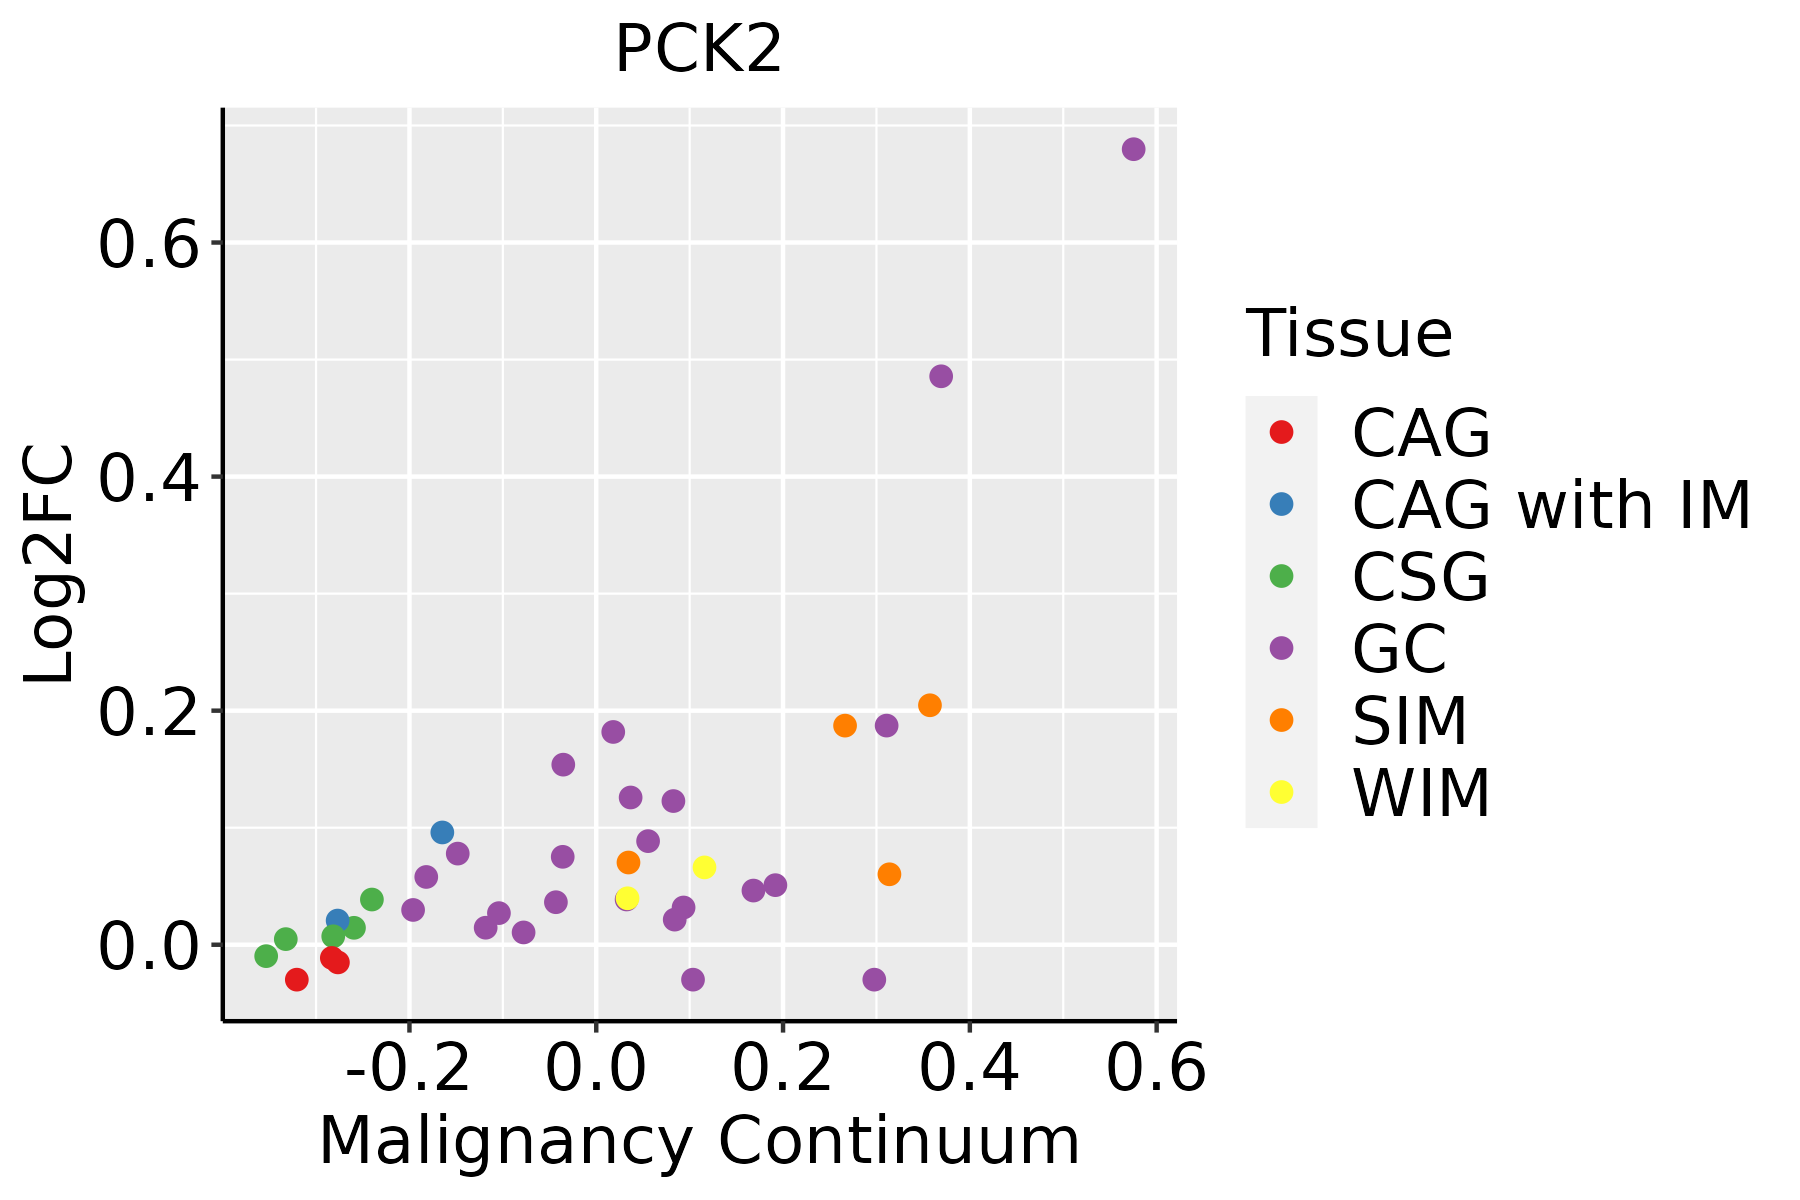 | CAG: Chronic atrophic gastritis |
| CAG with IM: Chronic atrophic gastritis with intestinal metaplasia |
| CSG: Chronic superficial gastritis |
| GC: Gastric cancer |
| SIM: Severe intestinal metaplasia |
| WIM: Wild intestinal metaplasia |
| Liver | 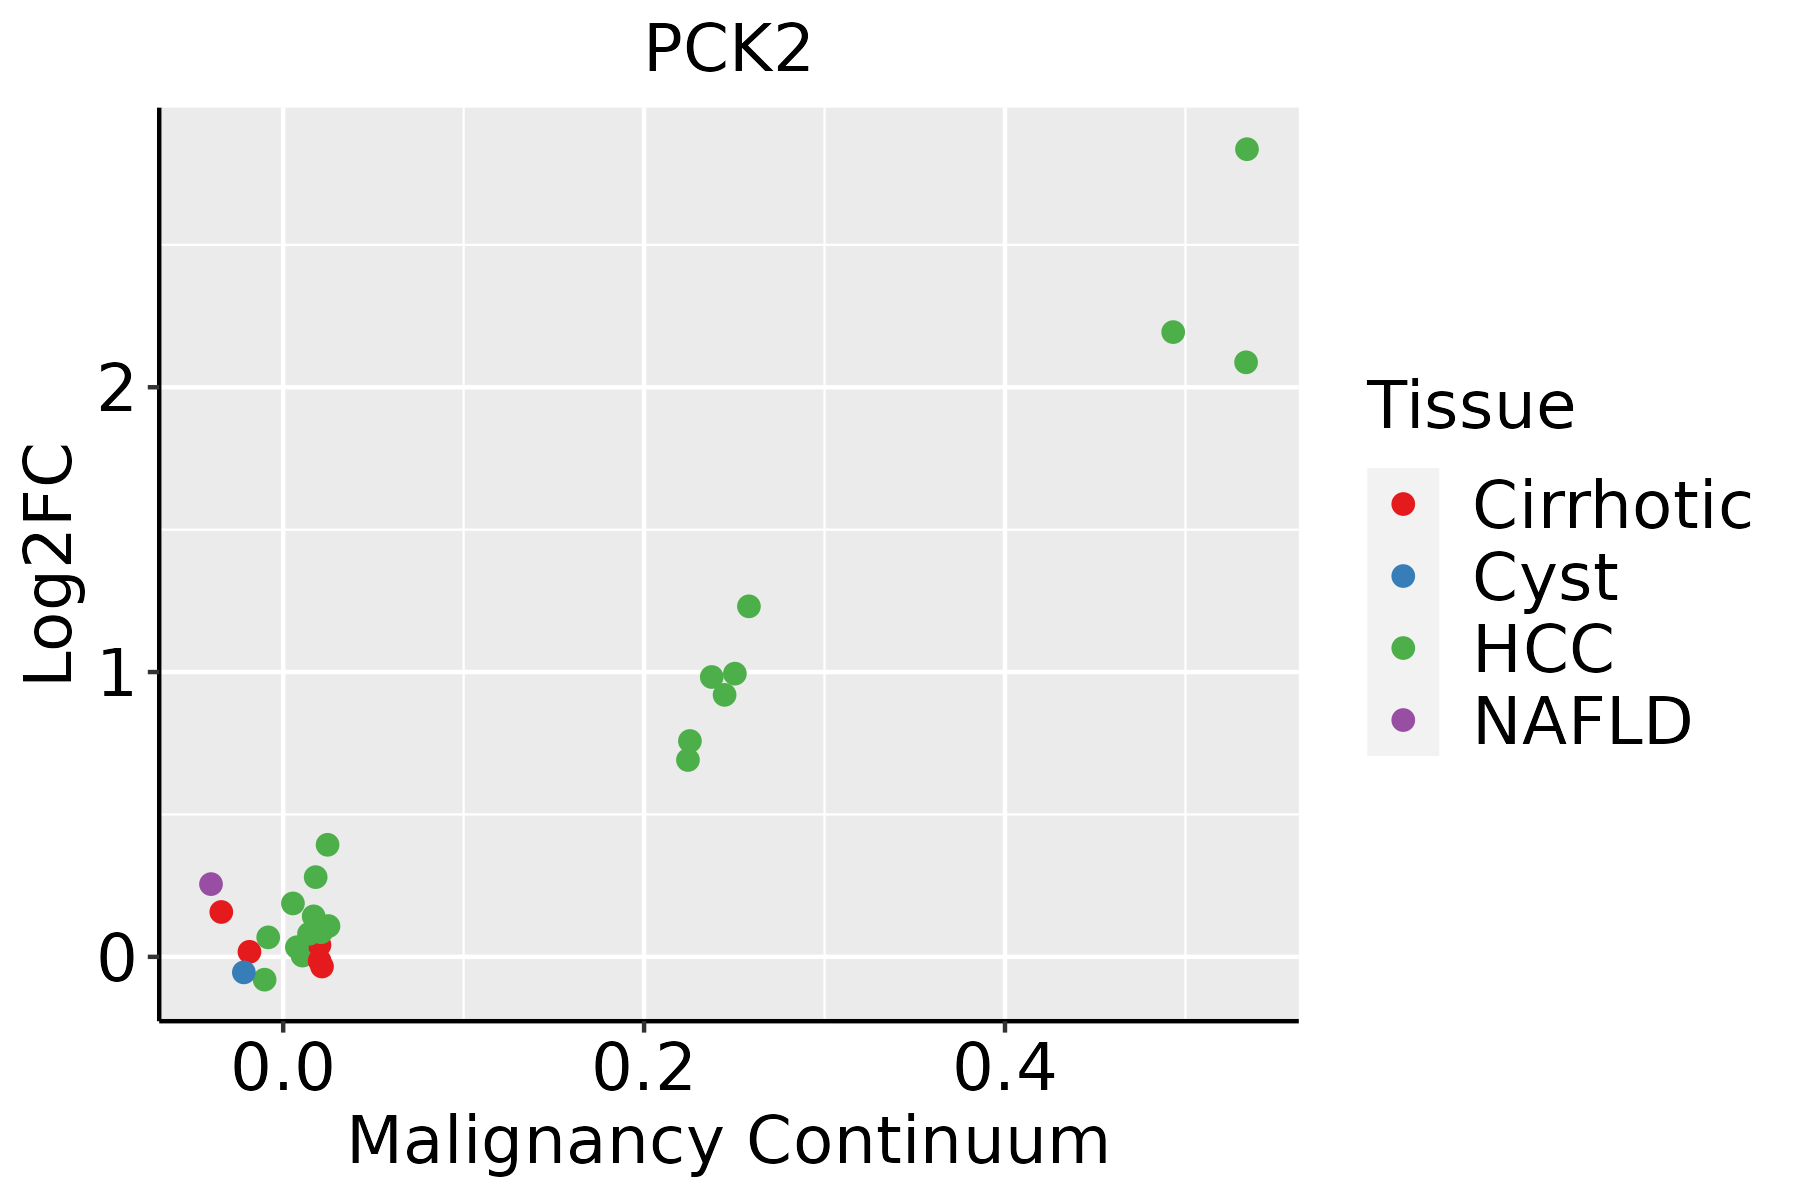 | HCC: Hepatocellular carcinoma |
| NAFLD: Non-alcoholic fatty liver disease |
| Oral Cavity | 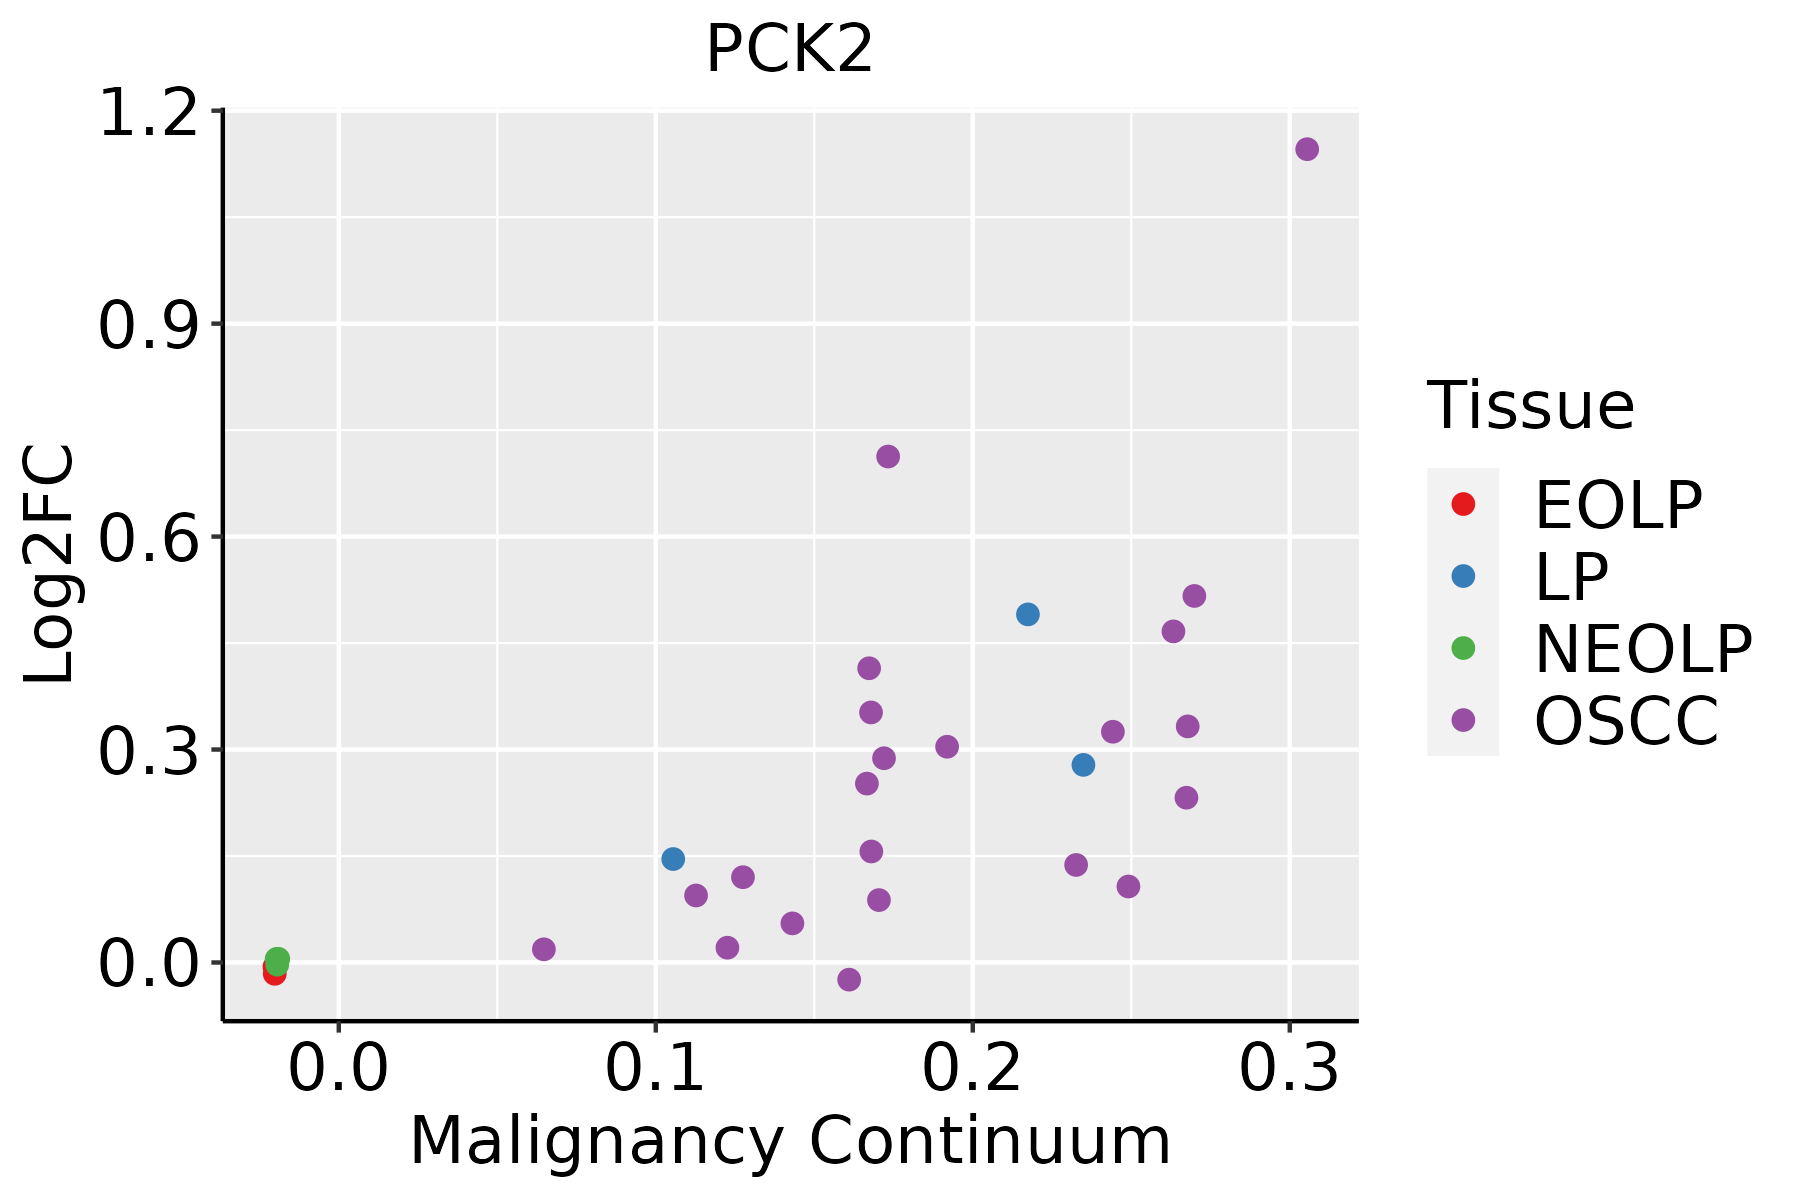 | EOLP: Erosive Oral lichen planus |
| LP: leukoplakia |
| NEOLP: Non-erosive oral lichen planus |
| OSCC: Oral squamous cell carcinoma |
| GO ID | Tissue | Disease Stage | Description | Gene Ratio | Bg Ratio | pvalue | p.adjust | Count |
| GO:0048732 | Colorectum | AD | gland development | 149/3918 | 436/18723 | 6.07e-11 | 6.33e-09 | 149 |
| GO:1904951 | Colorectum | AD | positive regulation of establishment of protein localization | 112/3918 | 319/18723 | 2.55e-09 | 1.80e-07 | 112 |
| GO:0051222 | Colorectum | AD | positive regulation of protein transport | 106/3918 | 303/18723 | 8.45e-09 | 5.08e-07 | 106 |
| GO:0006090 | Colorectum | AD | pyruvate metabolic process | 47/3918 | 106/18723 | 4.85e-08 | 2.55e-06 | 47 |
| GO:0032868 | Colorectum | AD | response to insulin | 91/3918 | 264/18723 | 2.02e-07 | 8.48e-06 | 91 |
| GO:0071383 | Colorectum | AD | cellular response to steroid hormone stimulus | 73/3918 | 204/18723 | 6.31e-07 | 2.24e-05 | 73 |
| GO:1901653 | Colorectum | AD | cellular response to peptide | 114/3918 | 359/18723 | 8.32e-07 | 2.88e-05 | 114 |
| GO:0009743 | Colorectum | AD | response to carbohydrate | 86/3918 | 253/18723 | 8.43e-07 | 2.90e-05 | 86 |
| GO:0044282 | Colorectum | AD | small molecule catabolic process | 118/3918 | 376/18723 | 1.05e-06 | 3.55e-05 | 118 |
| GO:0032869 | Colorectum | AD | cellular response to insulin stimulus | 72/3918 | 203/18723 | 1.10e-06 | 3.68e-05 | 72 |
| GO:0071375 | Colorectum | AD | cellular response to peptide hormone stimulus | 95/3918 | 290/18723 | 1.50e-06 | 4.66e-05 | 95 |
| GO:0043434 | Colorectum | AD | response to peptide hormone | 126/3918 | 414/18723 | 2.70e-06 | 7.86e-05 | 126 |
| GO:0009062 | Colorectum | AD | fatty acid catabolic process | 41/3918 | 100/18723 | 4.02e-06 | 1.09e-04 | 41 |
| GO:0034284 | Colorectum | AD | response to monosaccharide | 76/3918 | 225/18723 | 4.64e-06 | 1.23e-04 | 76 |
| GO:0061008 | Colorectum | AD | hepaticobiliary system development | 55/3918 | 150/18723 | 6.34e-06 | 1.59e-04 | 55 |
| GO:0001889 | Colorectum | AD | liver development | 54/3918 | 147/18723 | 7.20e-06 | 1.77e-04 | 54 |
| GO:0033500 | Colorectum | AD | carbohydrate homeostasis | 84/3918 | 259/18723 | 9.10e-06 | 2.15e-04 | 84 |
| GO:0009746 | Colorectum | AD | response to hexose | 73/3918 | 219/18723 | 1.20e-05 | 2.65e-04 | 73 |
| GO:0031667 | Colorectum | AD | response to nutrient levels | 138/3918 | 474/18723 | 1.22e-05 | 2.68e-04 | 138 |
| GO:0009749 | Colorectum | AD | response to glucose | 71/3918 | 212/18723 | 1.31e-05 | 2.85e-04 | 71 |
| Pathway ID | Tissue | Disease Stage | Description | Gene Ratio | Bg Ratio | pvalue | p.adjust | qvalue | Count |
| hsa00620 | Colorectum | AD | Pyruvate metabolism | 28/2092 | 47/8465 | 3.71e-07 | 5.41e-06 | 3.45e-06 | 28 |
| hsa00020 | Colorectum | AD | Citrate cycle (TCA cycle) | 20/2092 | 30/8465 | 1.43e-06 | 1.77e-05 | 1.13e-05 | 20 |
| hsa00010 | Colorectum | AD | Glycolysis / Gluconeogenesis | 34/2092 | 67/8465 | 3.63e-06 | 4.34e-05 | 2.77e-05 | 34 |
| hsa04152 | Colorectum | AD | AMPK signaling pathway | 47/2092 | 121/8465 | 3.74e-04 | 2.82e-03 | 1.80e-03 | 47 |
| hsa04922 | Colorectum | AD | Glucagon signaling pathway | 41/2092 | 107/8465 | 1.18e-03 | 7.75e-03 | 4.94e-03 | 41 |
| hsa04964 | Colorectum | AD | Proximal tubule bicarbonate reclamation | 11/2092 | 23/8465 | 1.35e-02 | 4.86e-02 | 3.10e-02 | 11 |
| hsa006201 | Colorectum | AD | Pyruvate metabolism | 28/2092 | 47/8465 | 3.71e-07 | 5.41e-06 | 3.45e-06 | 28 |
| hsa000201 | Colorectum | AD | Citrate cycle (TCA cycle) | 20/2092 | 30/8465 | 1.43e-06 | 1.77e-05 | 1.13e-05 | 20 |
| hsa000101 | Colorectum | AD | Glycolysis / Gluconeogenesis | 34/2092 | 67/8465 | 3.63e-06 | 4.34e-05 | 2.77e-05 | 34 |
| hsa041521 | Colorectum | AD | AMPK signaling pathway | 47/2092 | 121/8465 | 3.74e-04 | 2.82e-03 | 1.80e-03 | 47 |
| hsa049221 | Colorectum | AD | Glucagon signaling pathway | 41/2092 | 107/8465 | 1.18e-03 | 7.75e-03 | 4.94e-03 | 41 |
| hsa049641 | Colorectum | AD | Proximal tubule bicarbonate reclamation | 11/2092 | 23/8465 | 1.35e-02 | 4.86e-02 | 3.10e-02 | 11 |
| hsa006202 | Colorectum | SER | Pyruvate metabolism | 22/1580 | 47/8465 | 9.62e-06 | 1.33e-04 | 9.67e-05 | 22 |
| hsa000202 | Colorectum | SER | Citrate cycle (TCA cycle) | 16/1580 | 30/8465 | 2.06e-05 | 2.74e-04 | 1.99e-04 | 16 |
| hsa049222 | Colorectum | SER | Glucagon signaling pathway | 38/1580 | 107/8465 | 2.57e-05 | 3.28e-04 | 2.38e-04 | 38 |
| hsa000102 | Colorectum | SER | Glycolysis / Gluconeogenesis | 24/1580 | 67/8465 | 6.62e-04 | 5.36e-03 | 3.89e-03 | 24 |
| hsa049642 | Colorectum | SER | Proximal tubule bicarbonate reclamation | 10/1580 | 23/8465 | 5.33e-03 | 3.28e-02 | 2.38e-02 | 10 |
| hsa006203 | Colorectum | SER | Pyruvate metabolism | 22/1580 | 47/8465 | 9.62e-06 | 1.33e-04 | 9.67e-05 | 22 |
| hsa000203 | Colorectum | SER | Citrate cycle (TCA cycle) | 16/1580 | 30/8465 | 2.06e-05 | 2.74e-04 | 1.99e-04 | 16 |
| hsa049223 | Colorectum | SER | Glucagon signaling pathway | 38/1580 | 107/8465 | 2.57e-05 | 3.28e-04 | 2.38e-04 | 38 |
| Hugo Symbol | Variant Class | Variant Classification | dbSNP RS | HGVSc | HGVSp | HGVSp Short | SWISSPROT | BIOTYPE | SIFT | PolyPhen | Tumor Sample Barcode | Tissue | Histology | Sex | Age | Stage | Therapy Types | Drugs | Outcome |
| PCK2 | SNV | Missense_Mutation | | c.1014N>C | p.Glu338Asp | p.E338D | Q16822 | protein_coding | tolerated(1) | benign(0.003) | TCGA-BH-A0E2-01 | Breast | breast invasive carcinoma | Female | <65 | III/IV | Chemotherapy | doxorubicin | SD |
| PCK2 | SNV | Missense_Mutation | rs559309673 | c.1285C>T | p.Arg429Cys | p.R429C | Q16822 | protein_coding | deleterious(0.02) | possibly_damaging(0.785) | TCGA-BH-A18G-01 | Breast | breast invasive carcinoma | Female | >=65 | I/II | Unknown | Unknown | SD |
| PCK2 | SNV | Missense_Mutation | | c.1270N>C | p.Phe424Leu | p.F424L | Q16822 | protein_coding | deleterious(0) | probably_damaging(0.996) | TCGA-D8-A1JK-01 | Breast | breast invasive carcinoma | Female | >=65 | I/II | Unknown | Unknown | SD |
| PCK2 | SNV | Missense_Mutation | novel | c.530N>G | p.Gln177Arg | p.Q177R | Q16822 | protein_coding | deleterious(0.02) | probably_damaging(0.993) | TCGA-E9-A1ND-01 | Breast | breast invasive carcinoma | Female | >=65 | I/II | Hormone Therapy | aromasin | SD |
| PCK2 | SNV | Missense_Mutation | | c.1334N>A | p.Pro445His | p.P445H | Q16822 | protein_coding | deleterious(0) | possibly_damaging(0.456) | TCGA-E9-A22E-01 | Breast | breast invasive carcinoma | Female | <65 | III/IV | Chemotherapy | cyclophosphane | SD |
| PCK2 | insertion | Nonsense_Mutation | novel | c.1621_1622insTTTACTAACACCATCATTAA | p.Gly541ValfsTer3 | p.G541Vfs*3 | Q16822 | protein_coding | | | TCGA-A8-A092-01 | Breast | breast invasive carcinoma | Female | <65 | III/IV | Chemotherapy | paclitaxel | CR |
| PCK2 | SNV | Missense_Mutation | rs201059299 | c.157N>T | p.Arg53Cys | p.R53C | Q16822 | protein_coding | deleterious(0.01) | possibly_damaging(0.606) | TCGA-2W-A8YY-01 | Cervix | cervical & endocervical cancer | Female | <65 | I/II | Chemotherapy | cisplatin | CR |
| PCK2 | SNV | Missense_Mutation | | c.996N>C | p.Trp332Cys | p.W332C | Q16822 | protein_coding | deleterious(0) | probably_damaging(0.987) | TCGA-JX-A3Q0-01 | Cervix | cervical & endocervical cancer | Female | <65 | III/IV | Unknown | Unknown | SD |
| PCK2 | SNV | Missense_Mutation | rs2229660 | c.92N>A | p.Arg31Gln | p.R31Q | Q16822 | protein_coding | tolerated(0.54) | benign(0.011) | TCGA-MU-A8JM-01 | Cervix | cervical & endocervical cancer | Female | <65 | I/II | Unknown | Unknown | SD |
| PCK2 | SNV | Missense_Mutation | rs765912476 | c.311G>A | p.Arg104Gln | p.R104Q | Q16822 | protein_coding | deleterious(0) | probably_damaging(1) | TCGA-AA-3663-01 | Colorectum | colon adenocarcinoma | Male | <65 | I/II | Unknown | Unknown | SD |


