
|
|||||
|
 | |
| |
| |
| |
| |
| |
|
Gene: PCIF1 |
Gene summary for PCIF1 |
| Gene information | Species | Human | Gene symbol | PCIF1 | Gene ID | 63935 |
| Gene name | phosphorylated CTD interacting factor 1 | |
| Gene Alias | C20orf67 | |
| Cytomap | 20q13.12 | |
| Gene Type | protein-coding | GO ID | GO:0001510 | UniProtAcc | Q9H4Z3 |
Top |
Malignant transformation analysis |
| Identification of the aberrant gene expression in precancerous and cancerous lesions by comparing the gene expression of stem-like cells in diseased tissues with normal stem cells |
| Entrez ID | Symbol | Replicates | Species | Organ | Tissue | Adj P-value | Log2FC | Malignancy |
| 63935 | PCIF1 | LZE4T | Human | Esophagus | ESCC | 7.16e-18 | 4.63e-01 | 0.0811 |
| 63935 | PCIF1 | LZE7T | Human | Esophagus | ESCC | 4.98e-09 | 3.85e-01 | 0.0667 |
| 63935 | PCIF1 | LZE8T | Human | Esophagus | ESCC | 5.57e-13 | 3.89e-01 | 0.067 |
| 63935 | PCIF1 | LZE20T | Human | Esophagus | ESCC | 3.55e-03 | 1.70e-01 | 0.0662 |
| 63935 | PCIF1 | LZE24T | Human | Esophagus | ESCC | 6.57e-21 | 5.22e-01 | 0.0596 |
| 63935 | PCIF1 | LZE21T | Human | Esophagus | ESCC | 3.64e-04 | 2.96e-01 | 0.0655 |
| 63935 | PCIF1 | LZE6T | Human | Esophagus | ESCC | 2.26e-10 | 2.63e-01 | 0.0845 |
| 63935 | PCIF1 | P1T-E | Human | Esophagus | ESCC | 1.23e-13 | 4.04e-01 | 0.0875 |
| 63935 | PCIF1 | P2T-E | Human | Esophagus | ESCC | 1.79e-29 | 5.12e-01 | 0.1177 |
| 63935 | PCIF1 | P4T-E | Human | Esophagus | ESCC | 2.98e-25 | 4.79e-01 | 0.1323 |
| 63935 | PCIF1 | P5T-E | Human | Esophagus | ESCC | 1.13e-09 | 2.05e-01 | 0.1327 |
| 63935 | PCIF1 | P8T-E | Human | Esophagus | ESCC | 3.26e-32 | 5.47e-01 | 0.0889 |
| 63935 | PCIF1 | P9T-E | Human | Esophagus | ESCC | 9.31e-19 | 4.35e-01 | 0.1131 |
| 63935 | PCIF1 | P10T-E | Human | Esophagus | ESCC | 1.58e-47 | 7.97e-01 | 0.116 |
| 63935 | PCIF1 | P11T-E | Human | Esophagus | ESCC | 4.40e-12 | 5.83e-01 | 0.1426 |
| 63935 | PCIF1 | P12T-E | Human | Esophagus | ESCC | 1.05e-41 | 8.03e-01 | 0.1122 |
| 63935 | PCIF1 | P15T-E | Human | Esophagus | ESCC | 1.30e-35 | 7.50e-01 | 0.1149 |
| 63935 | PCIF1 | P16T-E | Human | Esophagus | ESCC | 8.37e-37 | 7.27e-01 | 0.1153 |
| 63935 | PCIF1 | P17T-E | Human | Esophagus | ESCC | 5.84e-15 | 6.12e-01 | 0.1278 |
| 63935 | PCIF1 | P19T-E | Human | Esophagus | ESCC | 3.09e-02 | 5.32e-01 | 0.1662 |
| Page: 1 2 3 4 5 |
| Tissue | Expression Dynamics | Abbreviation |
| Esophagus | 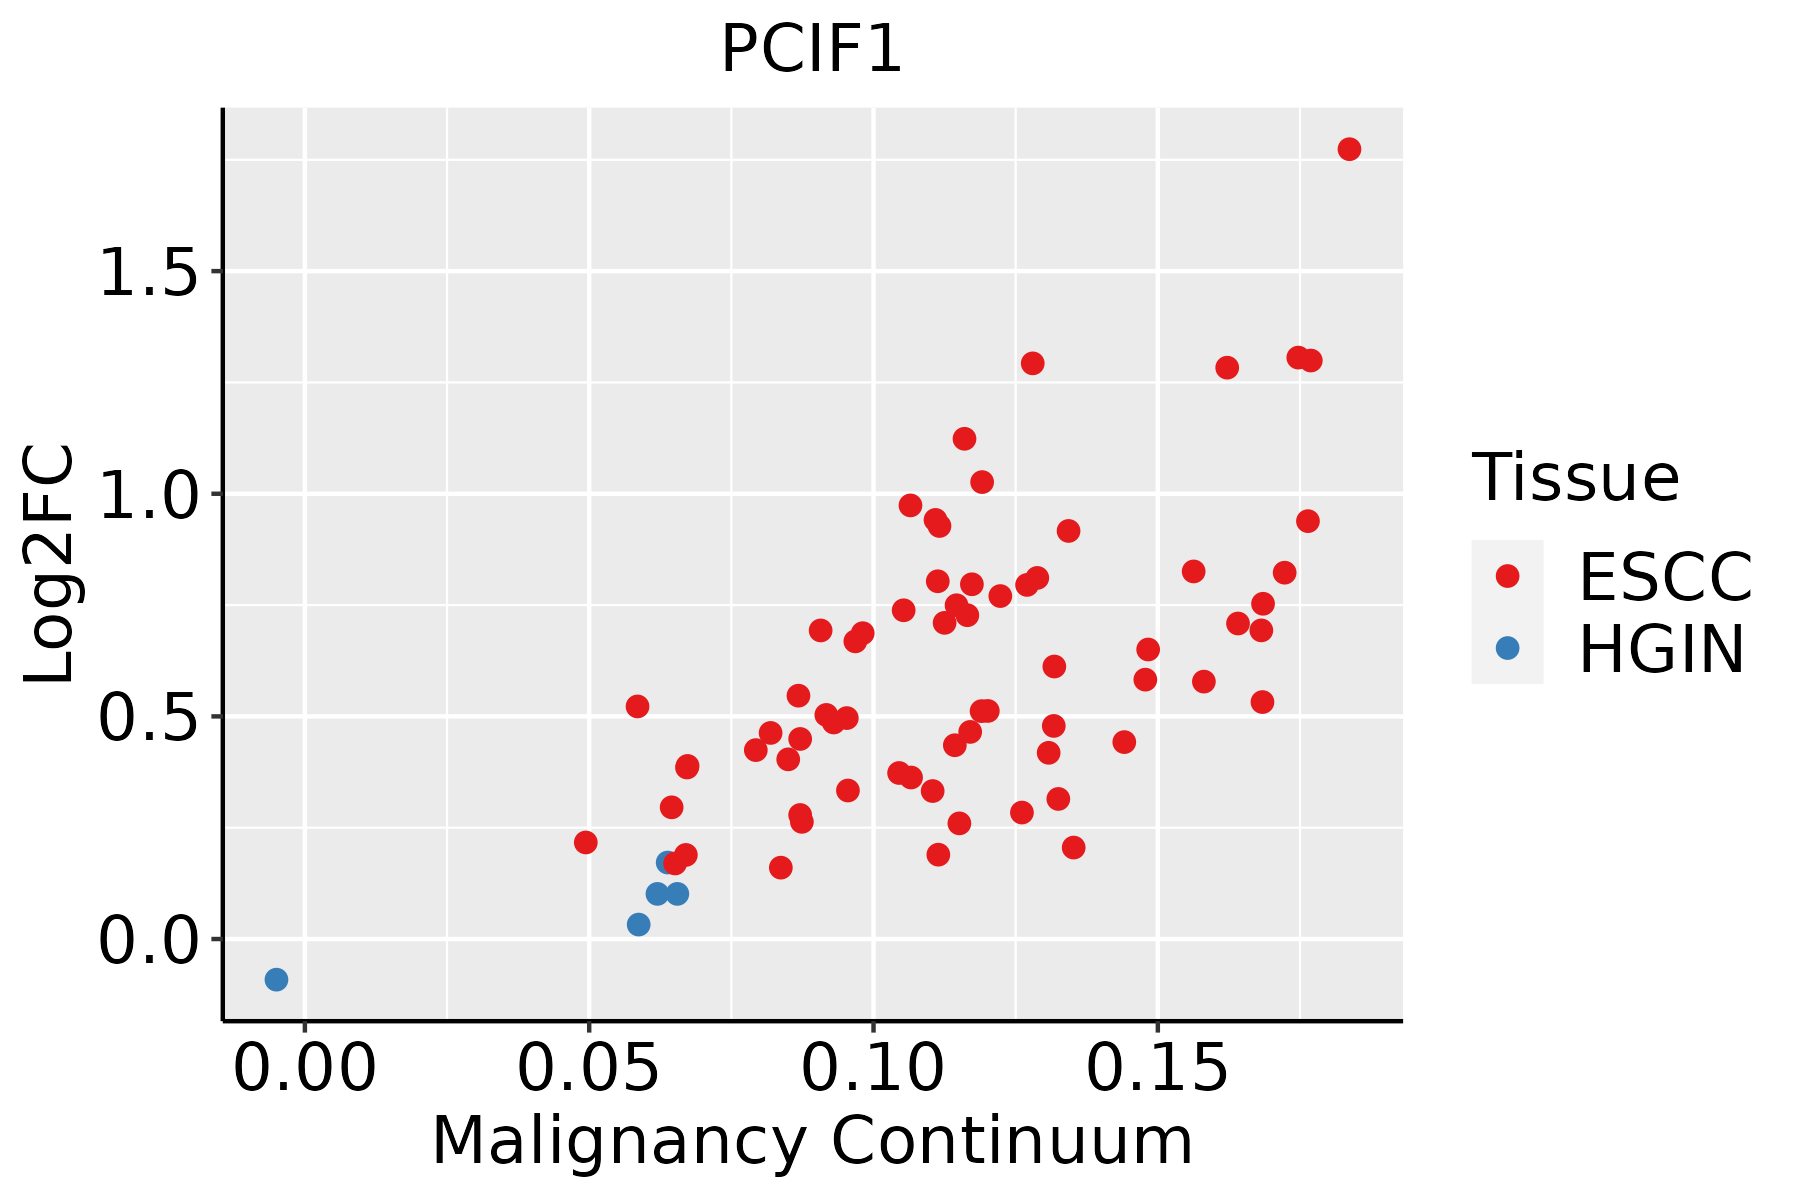 | ESCC: Esophageal squamous cell carcinoma |
| HGIN: High-grade intraepithelial neoplasias | ||
| LGIN: Low-grade intraepithelial neoplasias | ||
| Liver | 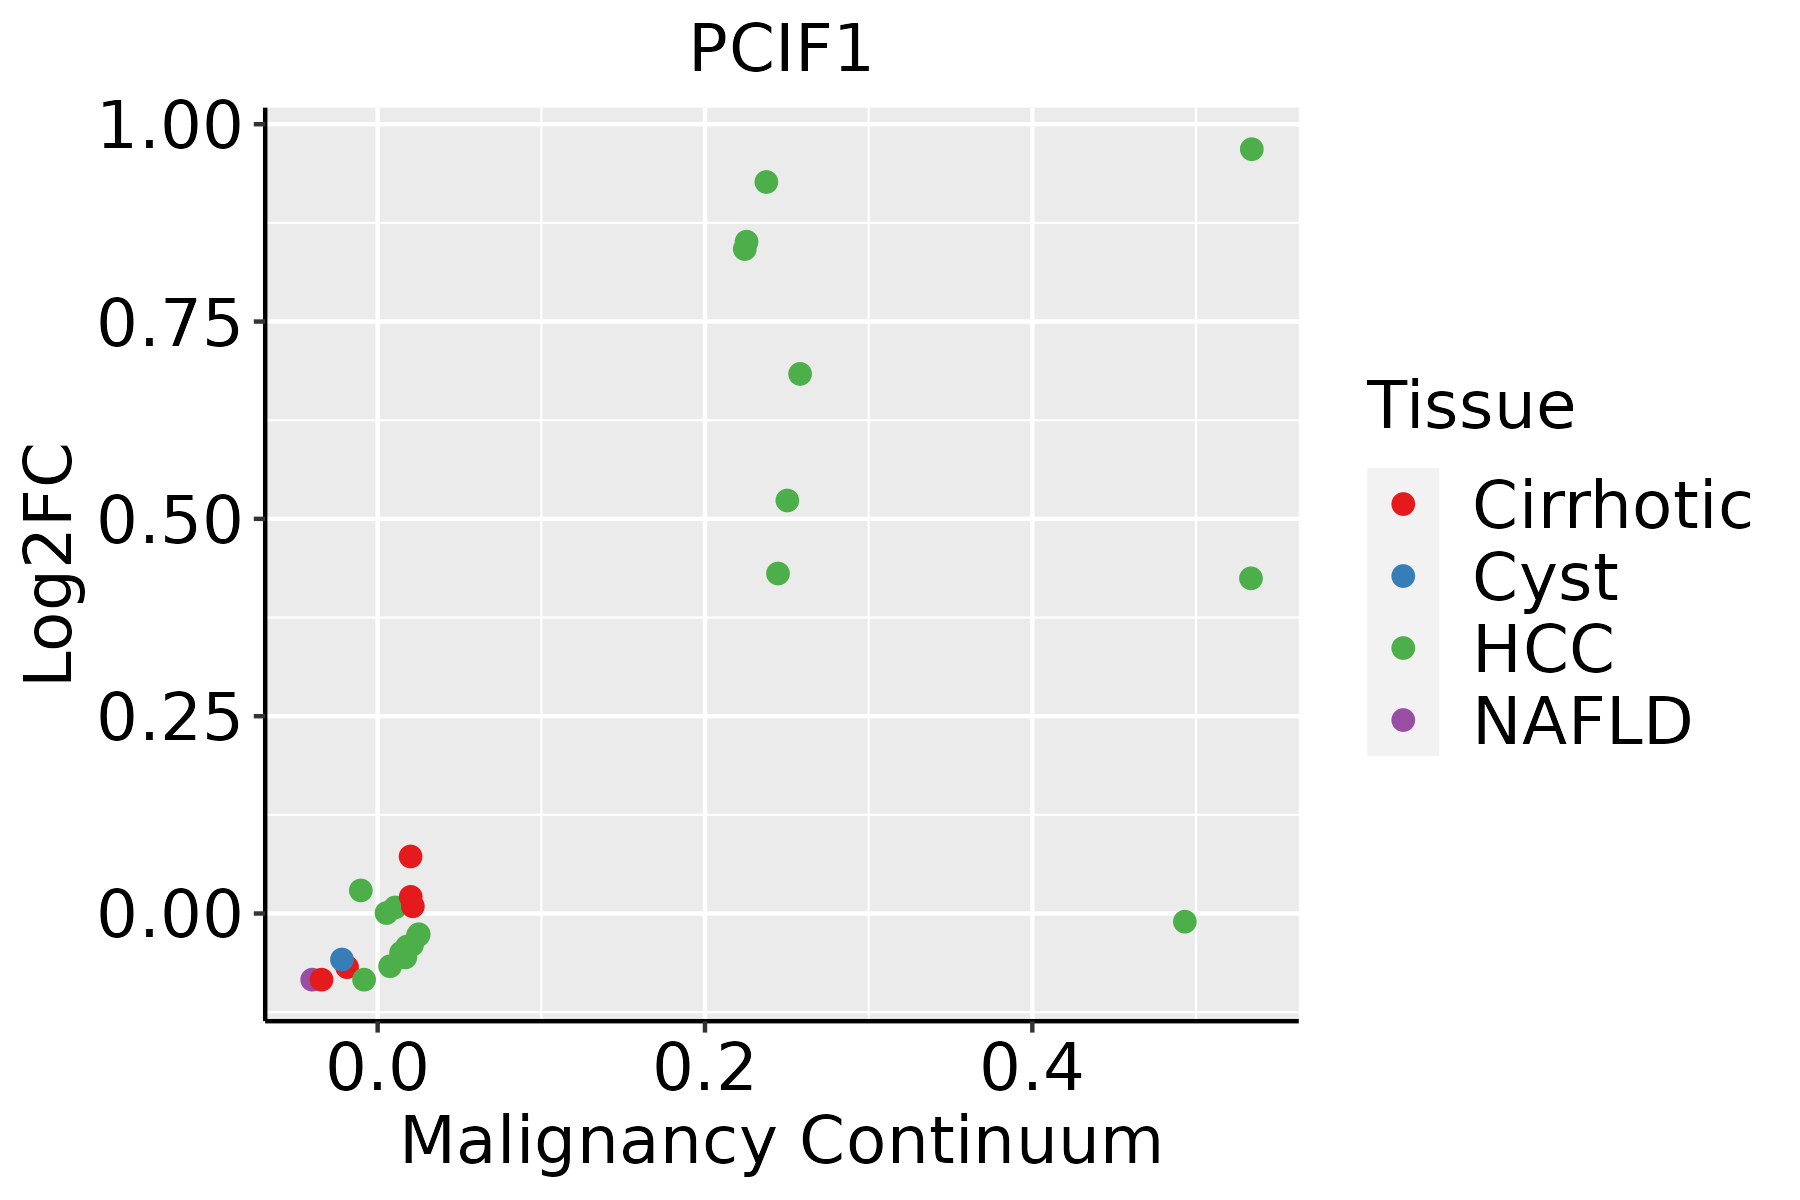 | HCC: Hepatocellular carcinoma |
| NAFLD: Non-alcoholic fatty liver disease | ||
| Oral Cavity | 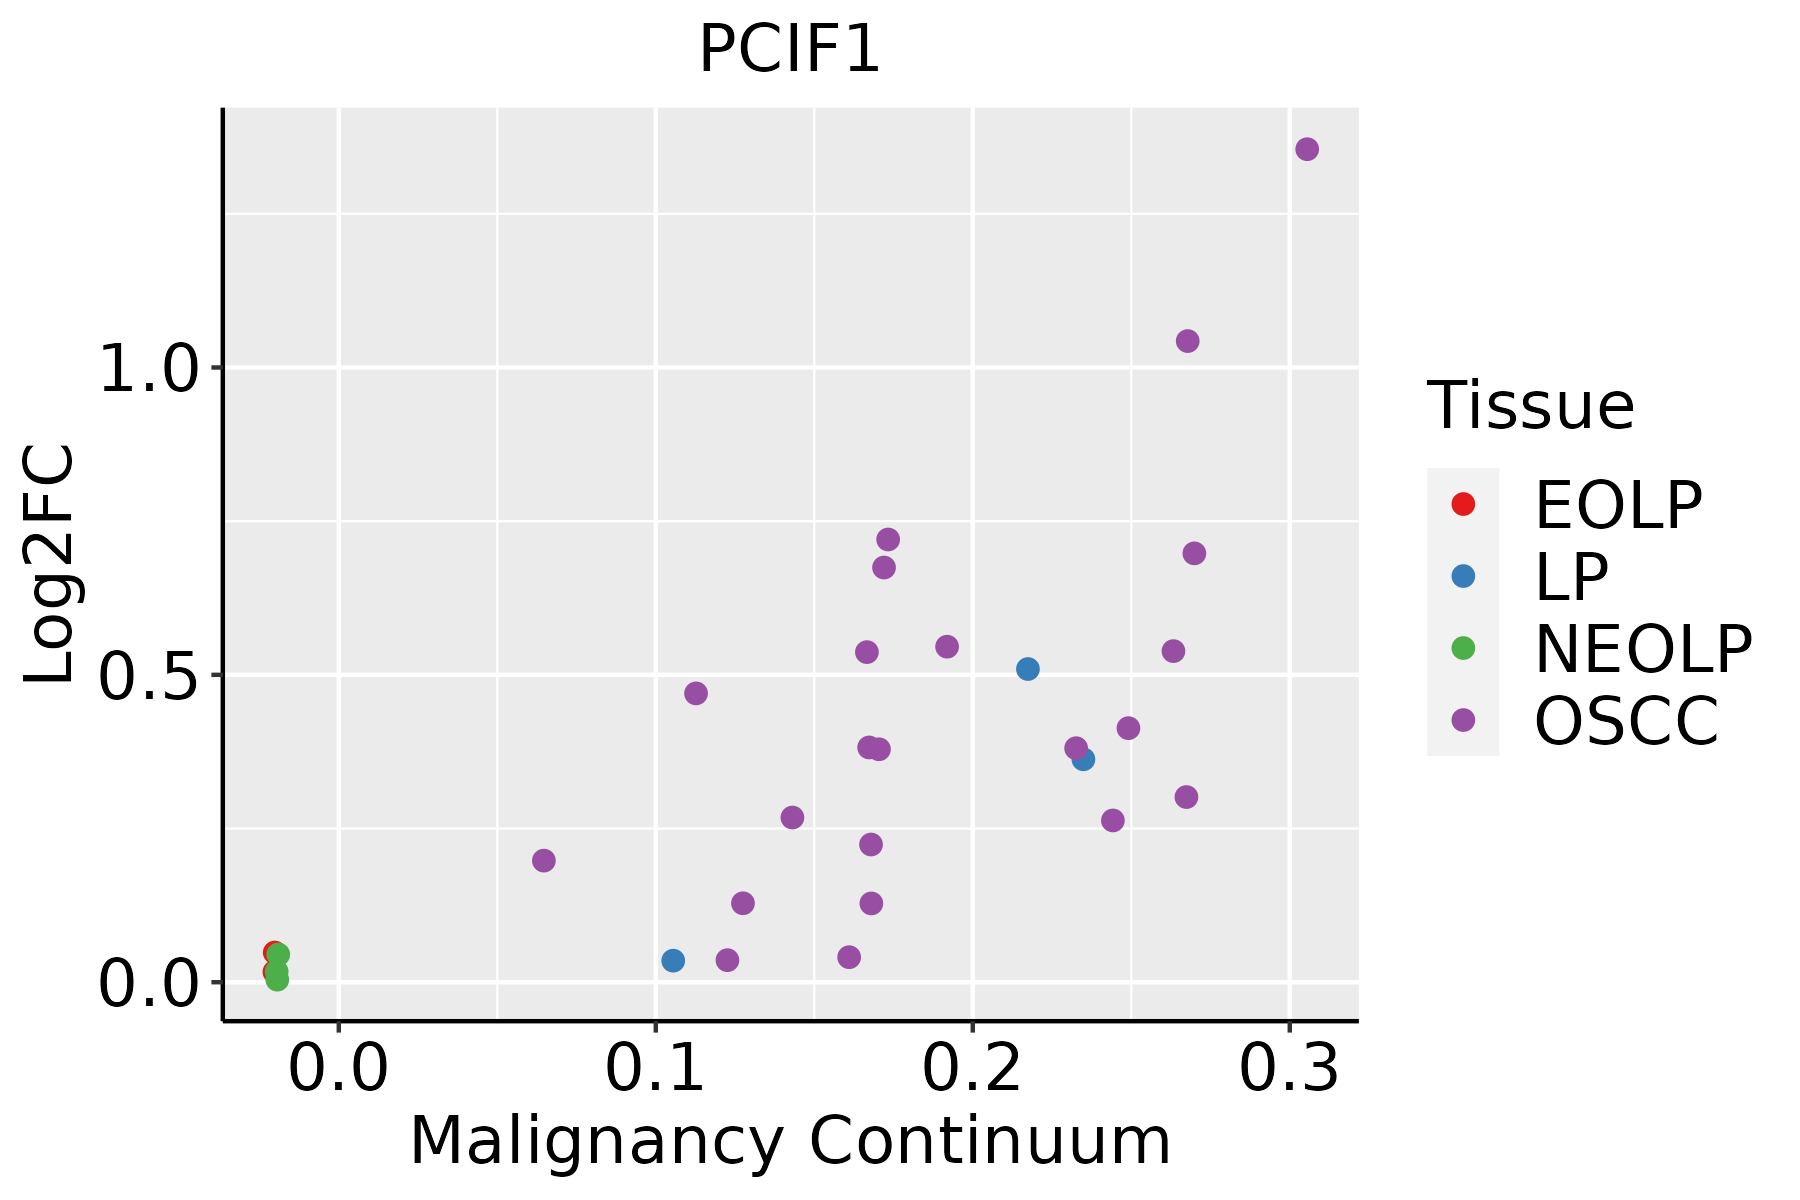 | EOLP: Erosive Oral lichen planus |
| LP: leukoplakia | ||
| NEOLP: Non-erosive oral lichen planus | ||
| OSCC: Oral squamous cell carcinoma |
| ∗log2FC in expression of this searched gene in stem-like cells from each diseased tissue sample relative to stem-like cells in normal samples in each tissue plotted against the malignancy continuum. Samples are colored based on if they are from different disease stage. |
Top |
Malignant transformation related pathway analysis |
| Find out the enriched GO biological processes and KEGG pathways involved in transition from healthy to precancer to cancer |
| Tissue | Disease Stage | Enriched GO biological Processes |
| Colorectum | AD |  |
| Colorectum | SER |  |
| Colorectum | MSS |  |
| Colorectum | MSI-H |  |
| Colorectum | FAP |  |
| ∗Top 15 enriched GO BP terms are showed in the bar plot of each disease state in each tissue. Each row represents a significant GO biological process which is colored according to the -log10(p.adjust). |
| Page: 1 2 3 4 5 6 7 8 9 |
| GO ID | Tissue | Disease Stage | Description | Gene Ratio | Bg Ratio | pvalue | p.adjust | Count |
| GO:0006417111 | Esophagus | ESCC | regulation of translation | 304/8552 | 468/18723 | 1.53e-17 | 1.33e-15 | 304 |
| GO:0045727111 | Esophagus | ESCC | positive regulation of translation | 107/8552 | 136/18723 | 2.79e-15 | 1.68e-13 | 107 |
| GO:0034250111 | Esophagus | ESCC | positive regulation of cellular amide metabolic process | 123/8552 | 162/18723 | 3.32e-15 | 1.93e-13 | 123 |
| GO:00434143 | Esophagus | ESCC | macromolecule methylation | 199/8552 | 316/18723 | 3.44e-10 | 9.57e-09 | 199 |
| GO:00322592 | Esophagus | ESCC | methylation | 222/8552 | 364/18723 | 2.26e-09 | 5.09e-08 | 222 |
| GO:00094512 | Esophagus | ESCC | RNA modification | 114/8552 | 167/18723 | 2.76e-09 | 6.04e-08 | 114 |
| GO:00015101 | Esophagus | ESCC | RNA methylation | 58/8552 | 83/18723 | 6.87e-06 | 6.94e-05 | 58 |
| GO:00800092 | Esophagus | ESCC | mRNA methylation | 14/8552 | 16/18723 | 6.78e-04 | 3.56e-03 | 14 |
| GO:00165561 | Esophagus | ESCC | mRNA modification | 21/8552 | 27/18723 | 6.88e-04 | 3.61e-03 | 21 |
| GO:003424914 | Esophagus | ESCC | negative regulation of cellular amide metabolic process | 144/8552 | 273/18723 | 1.08e-02 | 3.67e-02 | 144 |
| GO:000641722 | Liver | HCC | regulation of translation | 287/7958 | 468/18723 | 8.79e-17 | 8.08e-15 | 287 |
| GO:004572712 | Liver | HCC | positive regulation of translation | 97/7958 | 136/18723 | 8.51e-12 | 3.55e-10 | 97 |
| GO:003425022 | Liver | HCC | positive regulation of cellular amide metabolic process | 110/7958 | 162/18723 | 5.14e-11 | 1.92e-09 | 110 |
| GO:00434141 | Liver | HCC | macromolecule methylation | 183/7958 | 316/18723 | 2.00e-08 | 4.72e-07 | 183 |
| GO:0032259 | Liver | HCC | methylation | 206/7958 | 364/18723 | 3.35e-08 | 7.53e-07 | 206 |
| GO:0009451 | Liver | HCC | RNA modification | 101/7958 | 167/18723 | 2.02e-06 | 2.78e-05 | 101 |
| GO:0001510 | Liver | HCC | RNA methylation | 53/7958 | 83/18723 | 6.96e-05 | 6.29e-04 | 53 |
| GO:003424921 | Liver | HCC | negative regulation of cellular amide metabolic process | 144/7958 | 273/18723 | 3.80e-04 | 2.61e-03 | 144 |
| GO:001714821 | Liver | HCC | negative regulation of translation | 129/7958 | 245/18723 | 8.14e-04 | 4.87e-03 | 129 |
| GO:0080009 | Liver | HCC | mRNA methylation | 12/7958 | 16/18723 | 8.74e-03 | 3.40e-02 | 12 |
| Page: 1 2 |
| Pathway ID | Tissue | Disease Stage | Description | Gene Ratio | Bg Ratio | pvalue | p.adjust | qvalue | Count |
| Page: 1 |
Top |
Cell-cell communication analysis |
| Identification of potential cell-cell interactions between two cell types and their ligand-receptor pairs for different disease states |
| Ligand | Receptor | LRpair | Pathway | Tissue | Disease Stage |
| Page: 1 |
Top |
Single-cell gene regulatory network inference analysis |
| Find out the significant the regulons (TFs) and the target genes of each regulon across cell types for different disease states |
| TF | Cell Type | Tissue | Disease Stage | Target Gene | RSS | Regulon Activity |
| ∗The dot plots of a searched regulon are shown for all cell subpopulations in each disease state of each tissue based on the regulon specific score inferred using pySCENIC and by calculating the average expression. |
| Page: 1 |
Top |
Somatic mutation of malignant transformation related genes |
| Annotation of somatic variants for genes involved in malignant transformation |
| Hugo Symbol | Variant Class | Variant Classification | dbSNP RS | HGVSc | HGVSp | HGVSp Short | SWISSPROT | BIOTYPE | SIFT | PolyPhen | Tumor Sample Barcode | Tissue | Histology | Sex | Age | Stage | Therapy Types | Drugs | Outcome |
| PCIF1 | SNV | Missense_Mutation | c.1865N>G | p.Ser622Cys | p.S622C | Q9H4Z3 | protein_coding | tolerated(0.11) | possibly_damaging(0.775) | TCGA-A7-A26H-01 | Breast | breast invasive carcinoma | Female | >=65 | I/II | Hormone Therapy | anastrozole | PD | |
| PCIF1 | SNV | Missense_Mutation | rs200149076 | c.1970C>T | p.Pro657Leu | p.P657L | Q9H4Z3 | protein_coding | tolerated(0.08) | benign(0.057) | TCGA-AC-A23H-01 | Breast | breast invasive carcinoma | Female | >=65 | I/II | Unknown | Unknown | PD |
| PCIF1 | SNV | Missense_Mutation | novel | c.1951N>T | p.Ala651Ser | p.A651S | Q9H4Z3 | protein_coding | tolerated(0.12) | benign(0.291) | TCGA-C8-A1HI-01 | Breast | breast invasive carcinoma | Female | <65 | III/IV | Unknown | Unknown | SD |
| PCIF1 | insertion | Frame_Shift_Ins | novel | c.598_599insGCCTTGCTTTTTACAAC | p.Glu200GlyfsTer17 | p.E200Gfs*17 | Q9H4Z3 | protein_coding | TCGA-BH-A0HF-01 | Breast | breast invasive carcinoma | Female | >=65 | I/II | Hormone Therapy | arimidex | SD | ||
| PCIF1 | deletion | Frame_Shift_Del | novel | c.1499delN | p.Leu501SerfsTer41 | p.L501Sfs*41 | Q9H4Z3 | protein_coding | TCGA-EW-A2FV-01 | Breast | breast invasive carcinoma | Female | <65 | III/IV | Chemotherapy | docetaxel | SD | ||
| PCIF1 | SNV | Missense_Mutation | rs772130243 | c.251N>T | p.Ser84Leu | p.S84L | Q9H4Z3 | protein_coding | deleterious(0.01) | benign(0.407) | TCGA-2W-A8YY-01 | Cervix | cervical & endocervical cancer | Female | <65 | I/II | Chemotherapy | cisplatin | CR |
| PCIF1 | SNV | Missense_Mutation | novel | c.1010N>A | p.Arg337His | p.R337H | Q9H4Z3 | protein_coding | deleterious(0) | probably_damaging(0.999) | TCGA-2W-A8YY-01 | Cervix | cervical & endocervical cancer | Female | <65 | I/II | Chemotherapy | cisplatin | CR |
| PCIF1 | SNV | Missense_Mutation | c.685N>T | p.Pro229Ser | p.P229S | Q9H4Z3 | protein_coding | deleterious(0) | probably_damaging(1) | TCGA-C5-A7CH-01 | Cervix | cervical & endocervical cancer | Female | <65 | I/II | Unspecific | SD | ||
| PCIF1 | SNV | Missense_Mutation | c.975N>T | p.Lys325Asn | p.K325N | Q9H4Z3 | protein_coding | deleterious(0) | benign(0.358) | TCGA-C5-A905-01 | Cervix | cervical & endocervical cancer | Female | <65 | I/II | Unknown | Unknown | SD | |
| PCIF1 | SNV | Missense_Mutation | novel | c.1781N>T | p.Pro594Leu | p.P594L | Q9H4Z3 | protein_coding | tolerated(0.14) | possibly_damaging(0.542) | TCGA-DS-A1OB-01 | Cervix | cervical & endocervical cancer | Female | <65 | I/II | Chemotherapy | carboplatin | PD |
| Page: 1 2 3 4 5 6 7 8 |
Top |
Related drugs of malignant transformation related genes |
| Identification of chemicals and drugs interact with genes involved in malignant transfromation |
| (DGIdb 4.0) |
| Entrez ID | Symbol | Category | Interaction Types | Drug Claim Name | Drug Name | PMIDs |
| Page: 1 |

Copyright 2023-Present -The University of Texas Health Science Center at Houston |